
|
|||||
|
 | |
| |
| |
| |
| |
| |
|
Gene: NDUFA5 |
Gene summary for NDUFA5 |
| Gene information | Species | Human | Gene symbol | NDUFA5 | Gene ID | 4698 |
| Gene name | NADH:ubiquinone oxidoreductase subunit A5 | |
| Gene Alias | B13 | |
| Cytomap | 7q31.32 | |
| Gene Type | protein-coding | GO ID | GO:0006091 | UniProtAcc | A0A087X1G1 |
Top |
Malignant transformation analysis |
| Identification of the aberrant gene expression in precancerous and cancerous lesions by comparing the gene expression of stem-like cells in diseased tissues with normal stem cells |
| Entrez ID | Symbol | Replicates | Species | Organ | Tissue | Adj P-value | Log2FC | Malignancy |
| 4698 | NDUFA5 | HTA11_78_2000001011 | Human | Colorectum | AD | 1.41e-03 | 3.73e-01 | -0.1088 |
| 4698 | NDUFA5 | HTA11_347_2000001011 | Human | Colorectum | AD | 1.66e-07 | 4.31e-01 | -0.1954 |
| 4698 | NDUFA5 | HTA11_99999970781_79442 | Human | Colorectum | MSS | 1.77e-02 | 2.97e-01 | 0.294 |
| 4698 | NDUFA5 | A015-C-203 | Human | Colorectum | FAP | 1.59e-07 | -2.10e-01 | -0.1294 |
| 4698 | NDUFA5 | A002-C-201 | Human | Colorectum | FAP | 1.24e-02 | -1.46e-01 | 0.0324 |
| 4698 | NDUFA5 | A001-C-119 | Human | Colorectum | FAP | 8.39e-03 | -2.14e-01 | -0.1557 |
| 4698 | NDUFA5 | A001-C-108 | Human | Colorectum | FAP | 5.11e-04 | -1.64e-01 | -0.0272 |
| 4698 | NDUFA5 | A002-C-205 | Human | Colorectum | FAP | 8.23e-07 | -2.25e-01 | -0.1236 |
| 4698 | NDUFA5 | A001-C-104 | Human | Colorectum | FAP | 1.65e-03 | -1.70e-01 | 0.0184 |
| 4698 | NDUFA5 | A015-C-006 | Human | Colorectum | FAP | 1.97e-03 | -2.18e-01 | -0.0994 |
| 4698 | NDUFA5 | A015-C-106 | Human | Colorectum | FAP | 6.30e-06 | -1.62e-01 | -0.0511 |
| 4698 | NDUFA5 | A002-C-114 | Human | Colorectum | FAP | 4.36e-03 | -1.75e-01 | -0.1561 |
| 4698 | NDUFA5 | A015-C-104 | Human | Colorectum | FAP | 1.26e-06 | -1.65e-01 | -0.1899 |
| 4698 | NDUFA5 | A001-C-014 | Human | Colorectum | FAP | 1.87e-04 | -1.74e-01 | 0.0135 |
| 4698 | NDUFA5 | A002-C-016 | Human | Colorectum | FAP | 1.34e-03 | -1.76e-01 | 0.0521 |
| 4698 | NDUFA5 | A015-C-002 | Human | Colorectum | FAP | 4.57e-04 | -2.40e-01 | -0.0763 |
| 4698 | NDUFA5 | A001-C-203 | Human | Colorectum | FAP | 1.42e-03 | -1.40e-01 | -0.0481 |
| 4698 | NDUFA5 | A002-C-116 | Human | Colorectum | FAP | 1.15e-08 | -1.66e-01 | -0.0452 |
| 4698 | NDUFA5 | A014-C-008 | Human | Colorectum | FAP | 8.01e-03 | -2.19e-01 | -0.191 |
| 4698 | NDUFA5 | A018-E-020 | Human | Colorectum | FAP | 6.73e-05 | -2.08e-01 | -0.2034 |
| Page: 1 2 3 4 5 6 7 8 9 |
| Tissue | Expression Dynamics | Abbreviation |
| Colorectum (GSE201348) |  | FAP: Familial adenomatous polyposis |
| CRC: Colorectal cancer | ||
| Colorectum (HTA11) |  | AD: Adenomas |
| SER: Sessile serrated lesions | ||
| MSI-H: Microsatellite-high colorectal cancer | ||
| MSS: Microsatellite stable colorectal cancer | ||
| Endometrium |  | AEH: Atypical endometrial hyperplasia |
| EEC: Endometrioid Cancer | ||
| Esophagus | 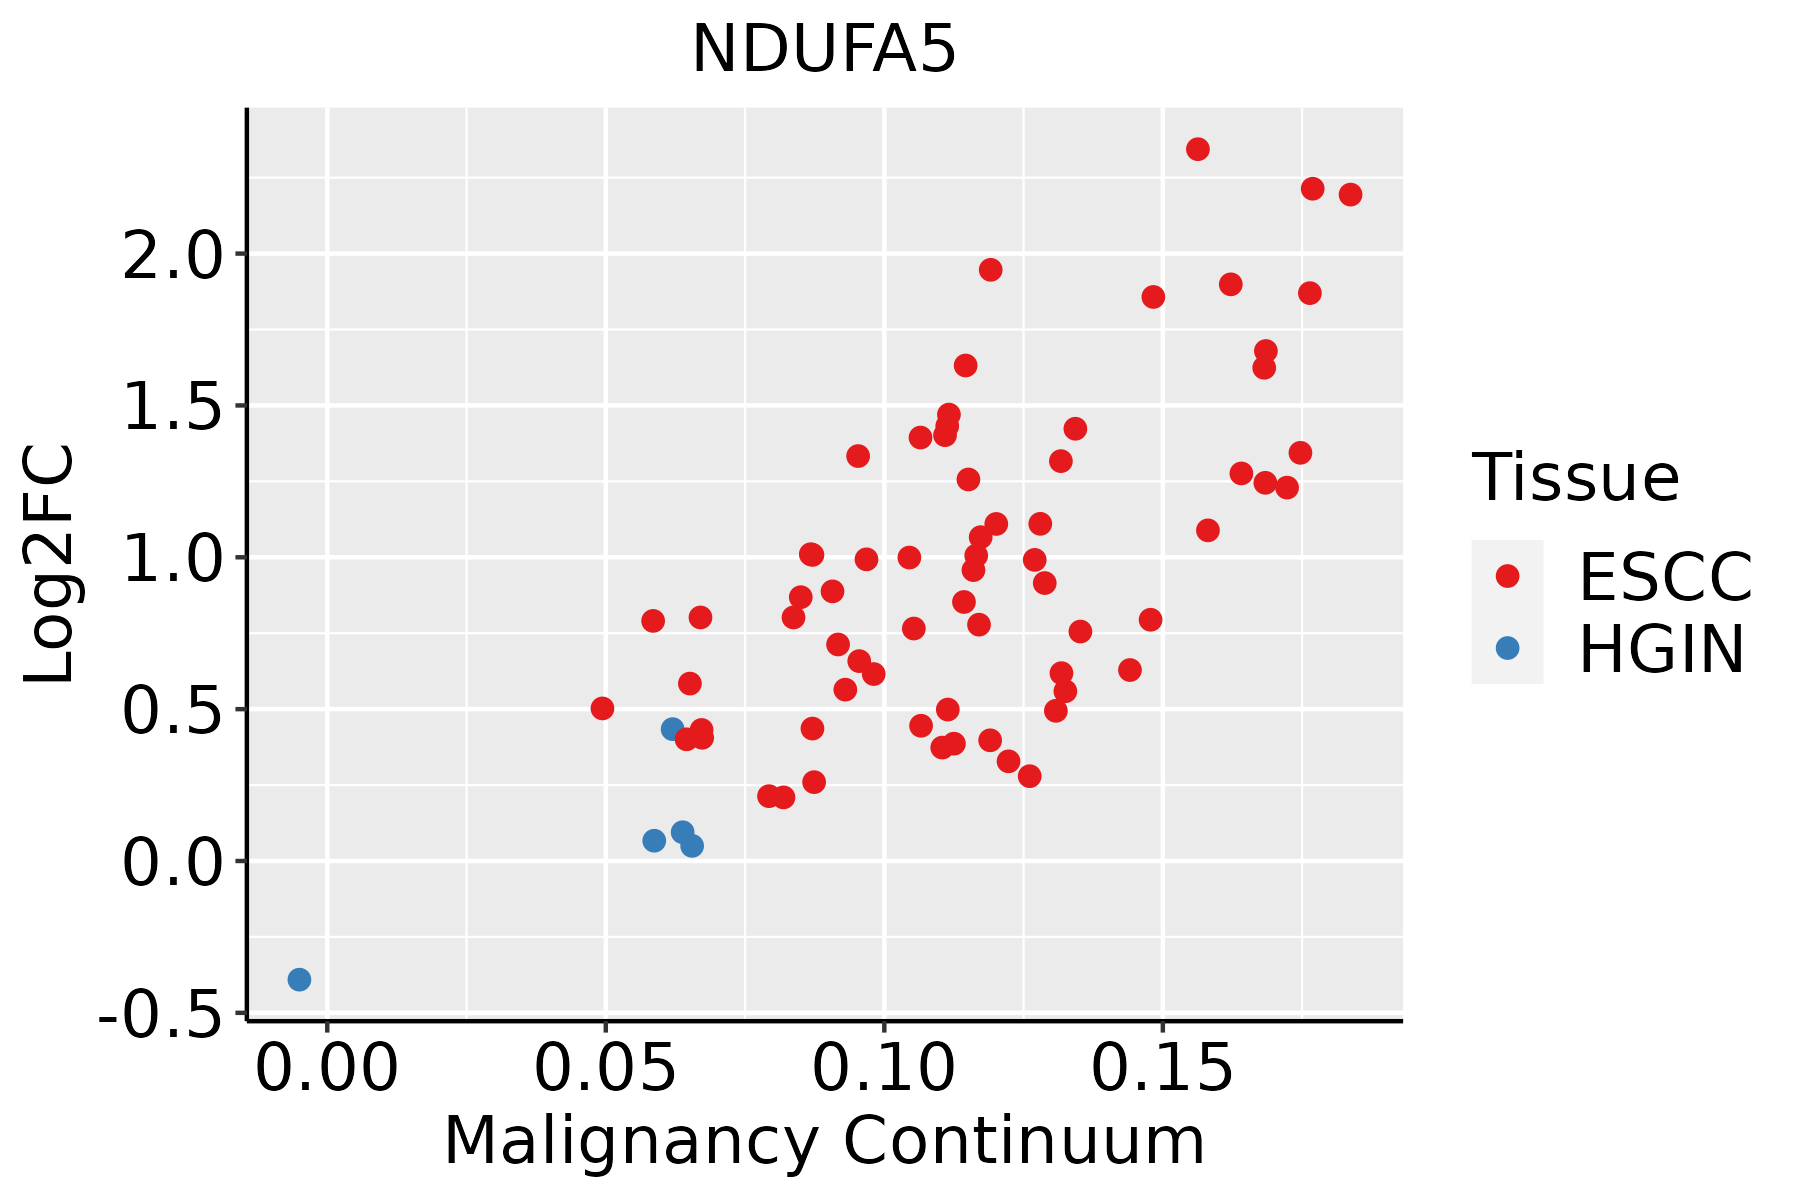 | ESCC: Esophageal squamous cell carcinoma |
| HGIN: High-grade intraepithelial neoplasias | ||
| LGIN: Low-grade intraepithelial neoplasias | ||
| Liver | 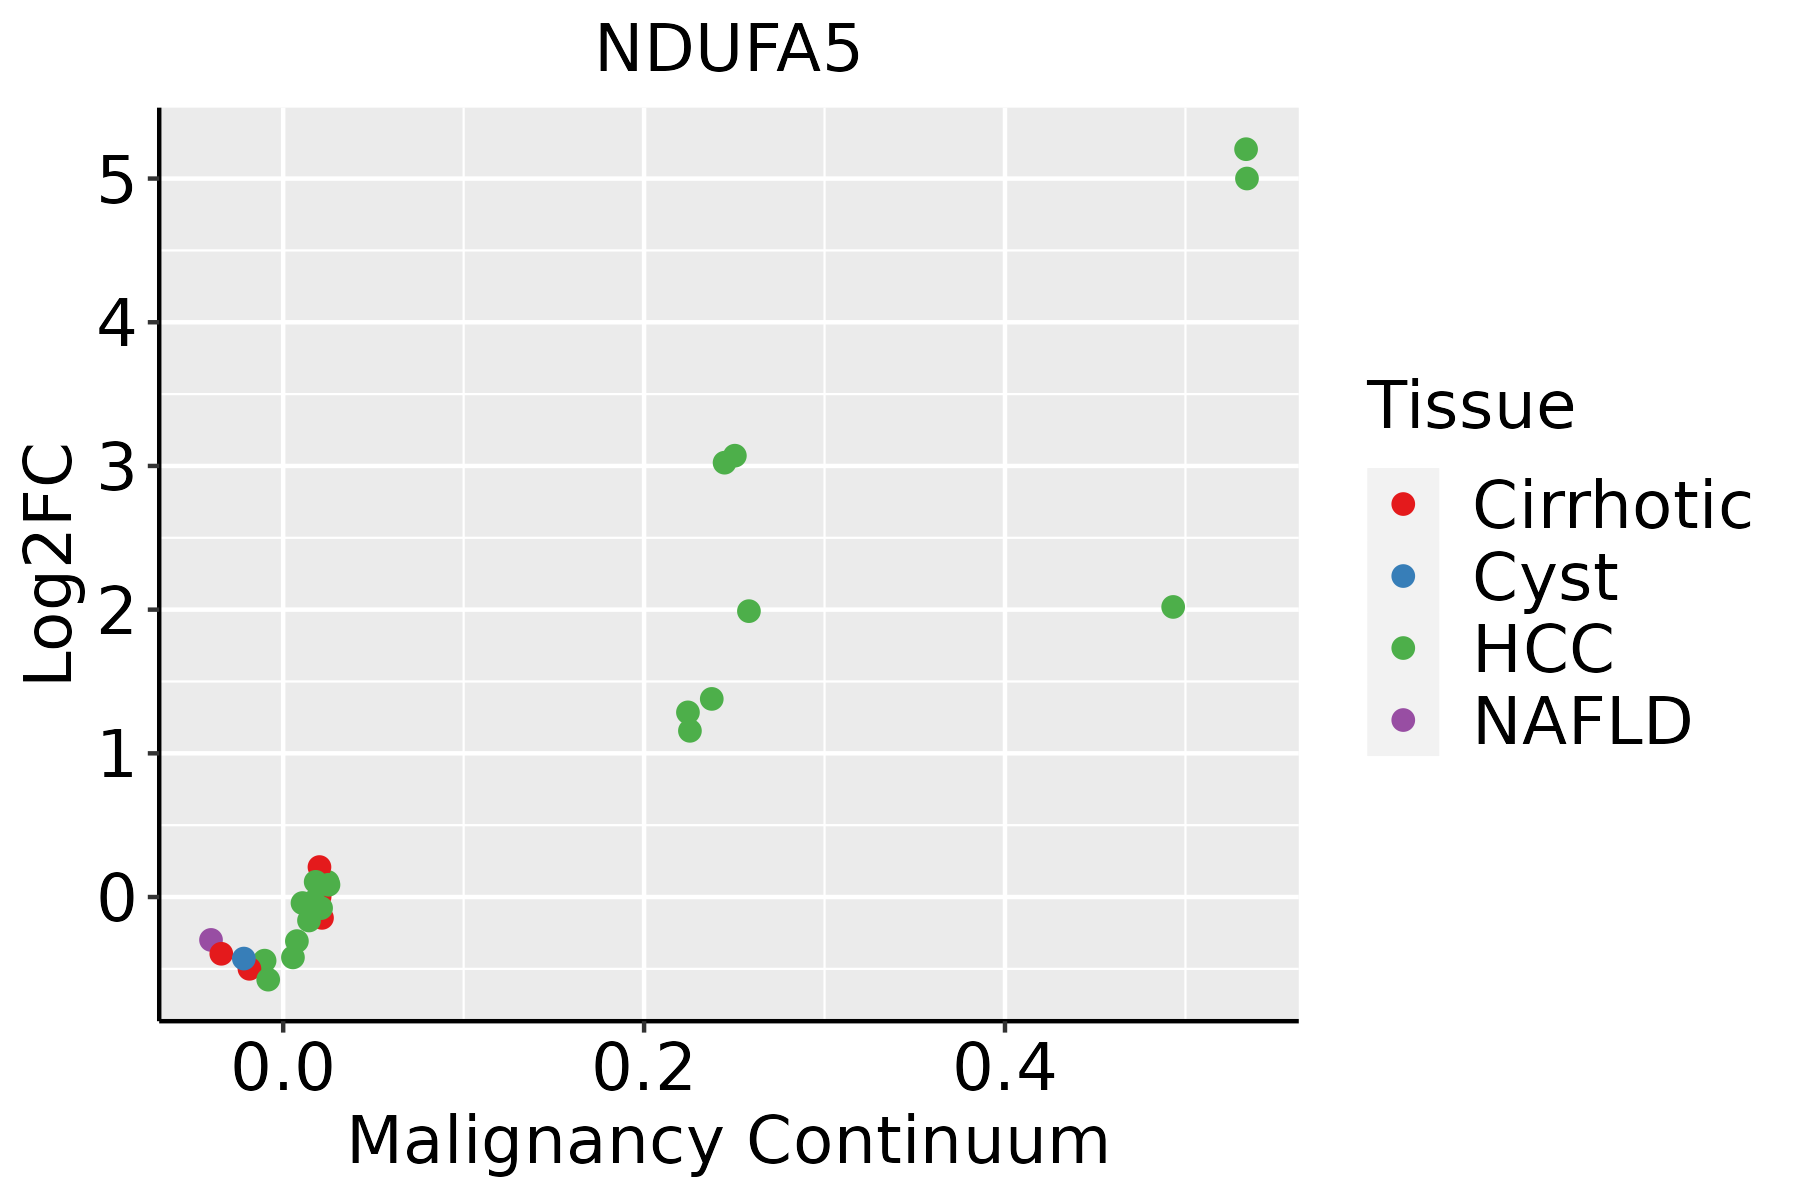 | HCC: Hepatocellular carcinoma |
| NAFLD: Non-alcoholic fatty liver disease | ||
| Oral Cavity |  | EOLP: Erosive Oral lichen planus |
| LP: leukoplakia | ||
| NEOLP: Non-erosive oral lichen planus | ||
| OSCC: Oral squamous cell carcinoma | ||
| Prostate |  | BPH: Benign Prostatic Hyperplasia |
| Skin | 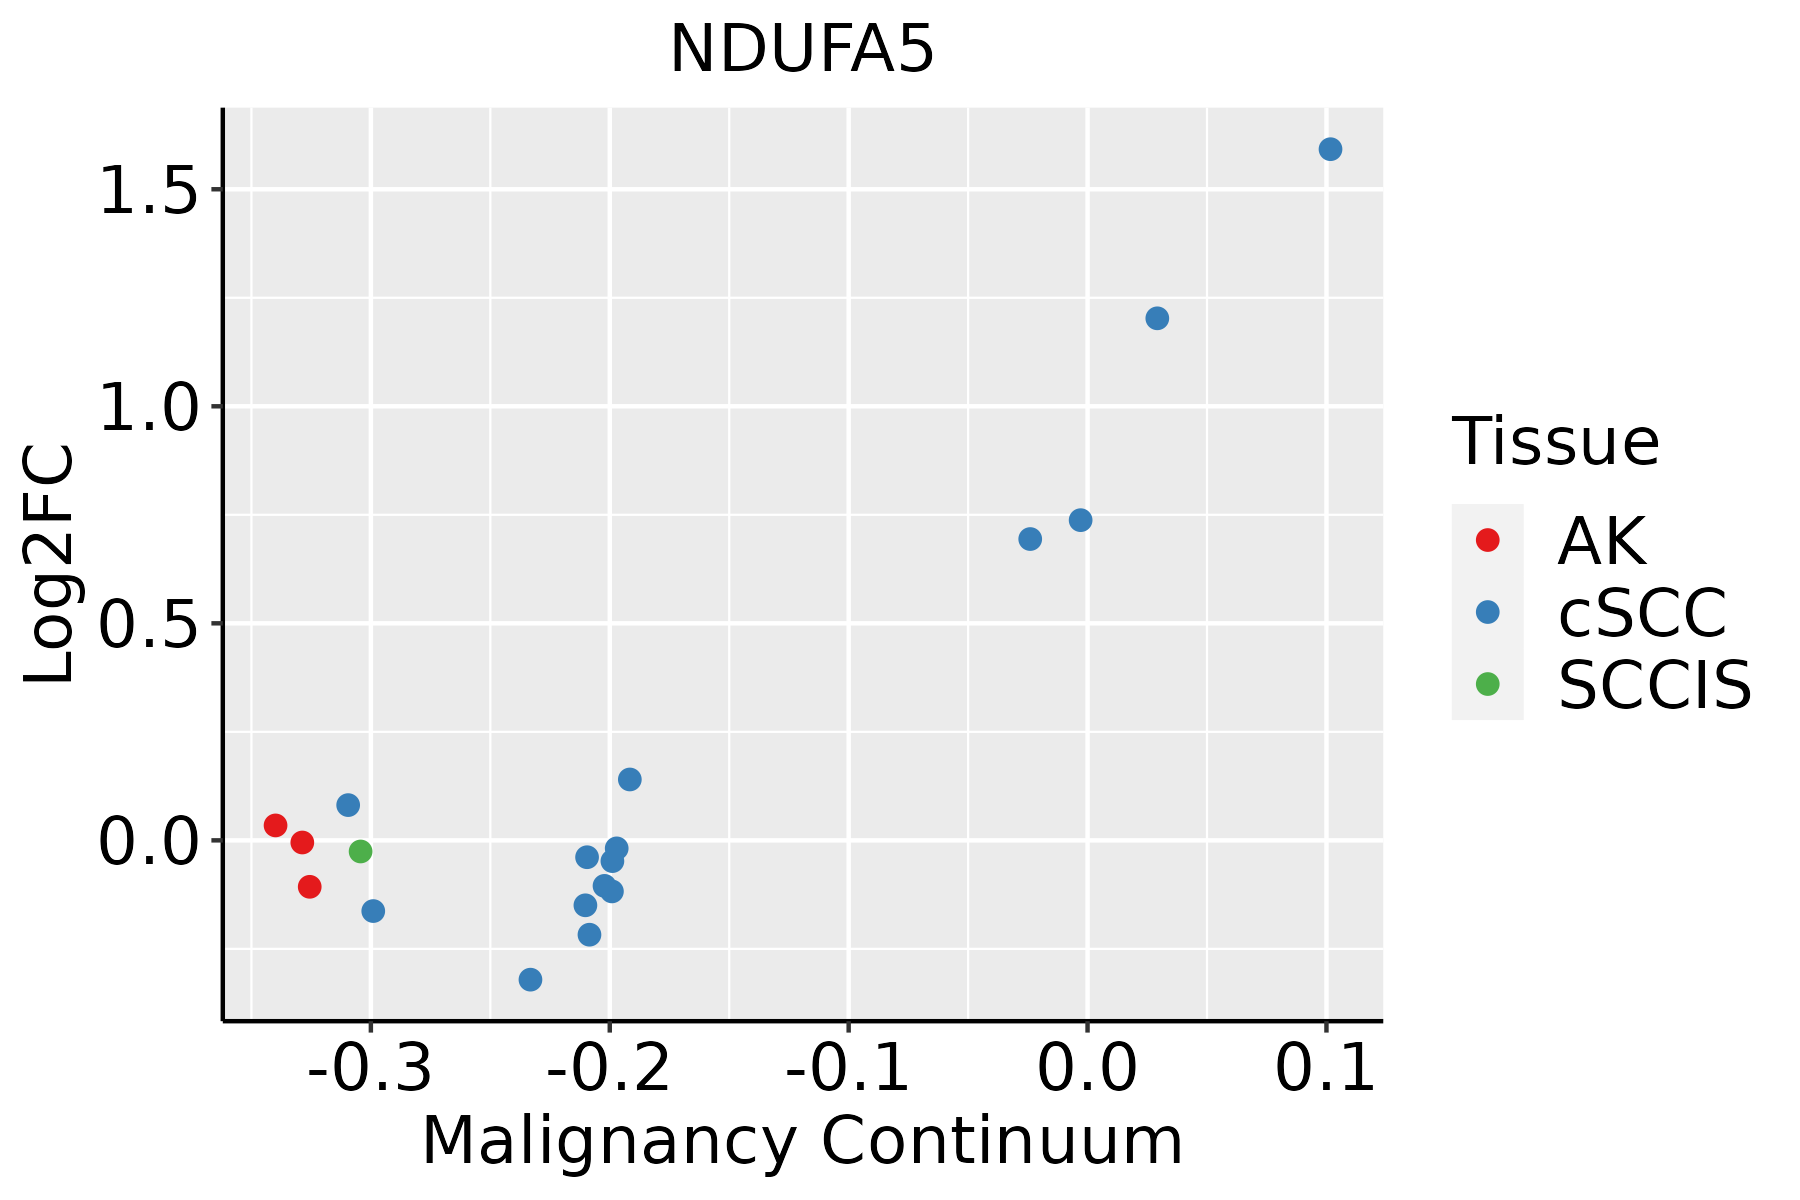 | AK: Actinic keratosis |
| cSCC: Cutaneous squamous cell carcinoma | ||
| SCCIS:squamous cell carcinoma in situ | ||
| Thyroid | 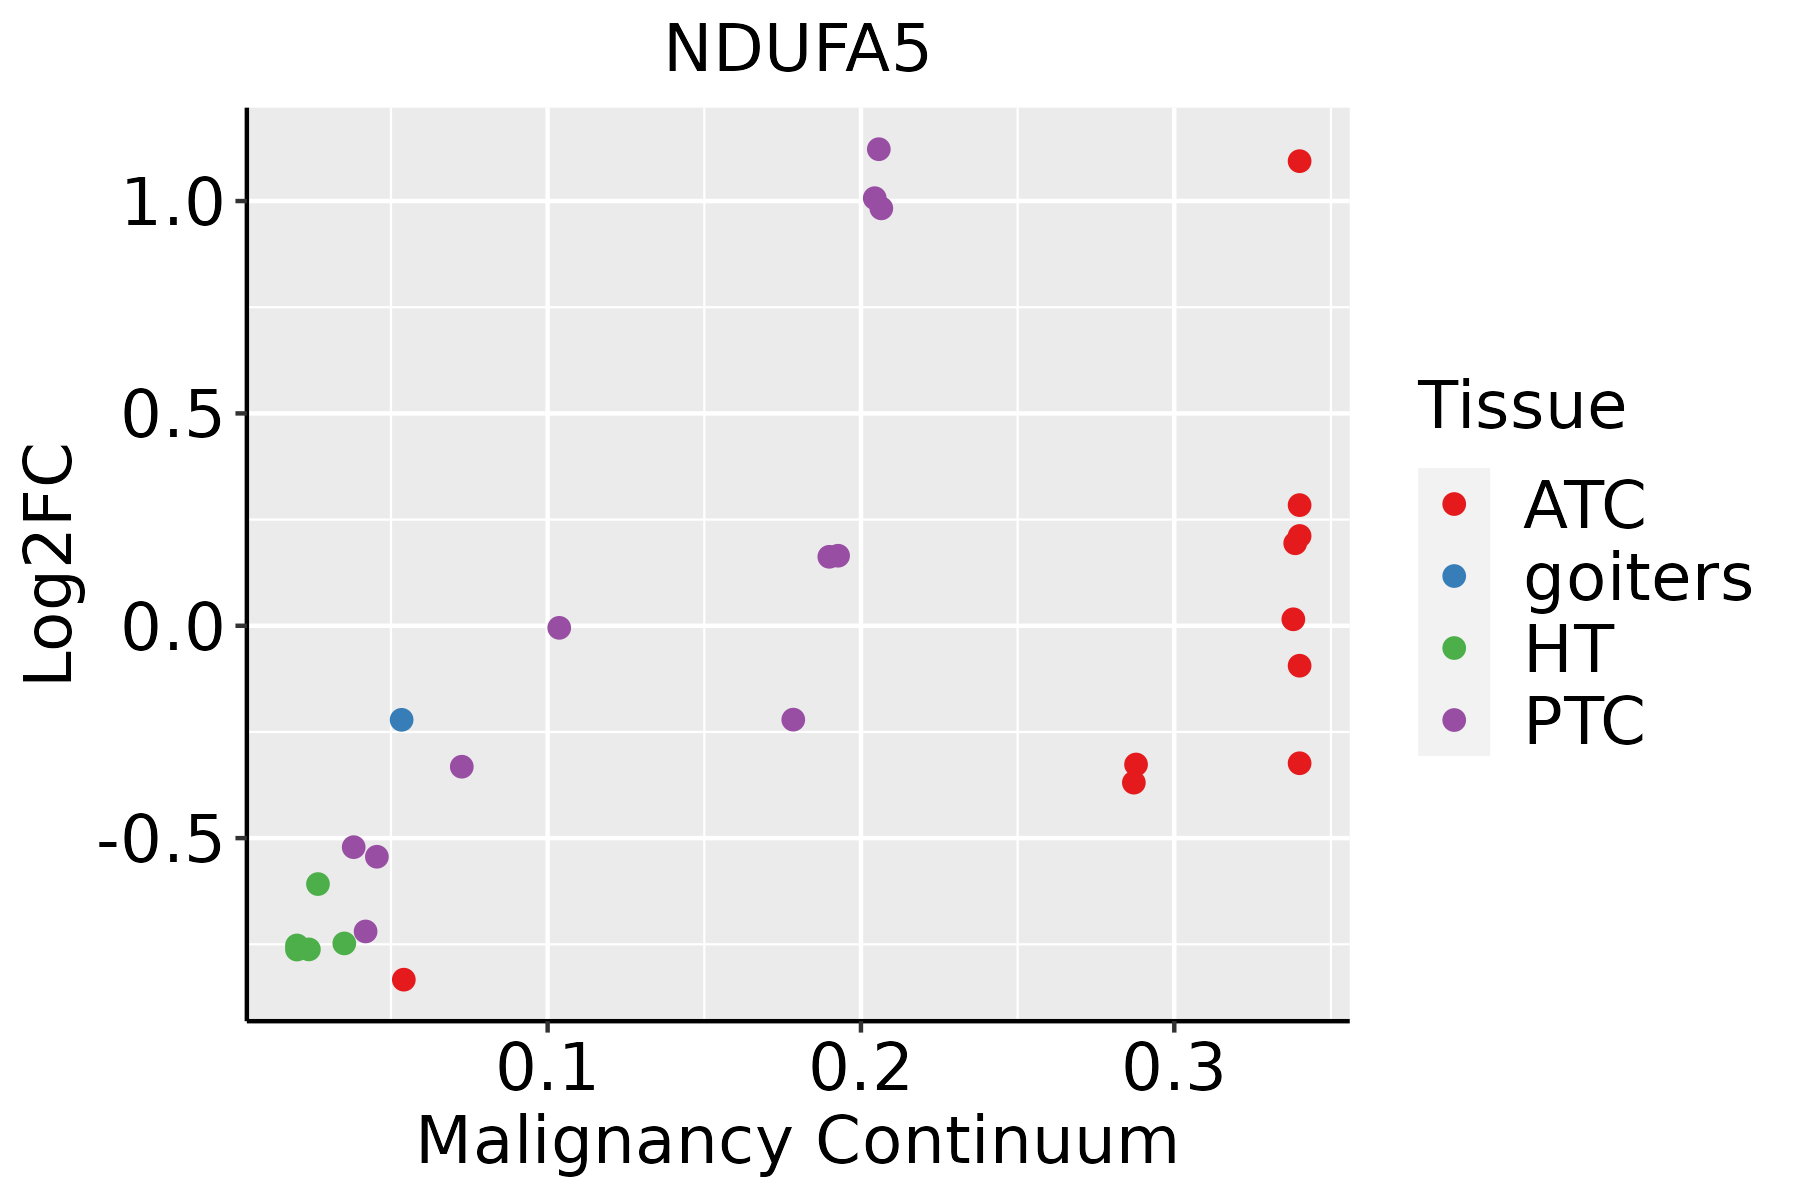 | ATC: Anaplastic thyroid cancer |
| HT: Hashimoto's thyroiditis | ||
| PTC: Papillary thyroid cancer |
| ∗log2FC in expression of this searched gene in stem-like cells from each diseased tissue sample relative to stem-like cells in normal samples in each tissue plotted against the malignancy continuum. Samples are colored based on if they are from different disease stage. |
Top |
Malignant transformation related pathway analysis |
| Find out the enriched GO biological processes and KEGG pathways involved in transition from healthy to precancer to cancer |
| Tissue | Disease Stage | Enriched GO biological Processes |
| Colorectum | AD |  |
| Colorectum | SER |  |
| Colorectum | MSS |  |
| Colorectum | MSI-H |  |
| Colorectum | FAP |  |
| ∗Top 15 enriched GO BP terms are showed in the bar plot of each disease state in each tissue. Each row represents a significant GO biological process which is colored according to the -log10(p.adjust). |
| Page: 1 2 3 4 5 6 7 8 9 |
| GO ID | Tissue | Disease Stage | Description | Gene Ratio | Bg Ratio | pvalue | p.adjust | Count |
| GO:0046034 | Colorectum | AD | ATP metabolic process | 142/3918 | 277/18723 | 2.64e-29 | 8.26e-26 | 142 |
| GO:0006091 | Colorectum | AD | generation of precursor metabolites and energy | 209/3918 | 490/18723 | 3.17e-28 | 6.61e-25 | 209 |
| GO:0009060 | Colorectum | AD | aerobic respiration | 108/3918 | 189/18723 | 9.14e-28 | 1.43e-24 | 108 |
| GO:0045333 | Colorectum | AD | cellular respiration | 119/3918 | 230/18723 | 3.21e-25 | 4.02e-22 | 119 |
| GO:0006119 | Colorectum | AD | oxidative phosphorylation | 83/3918 | 141/18723 | 7.95e-23 | 8.30e-20 | 83 |
| GO:0015980 | Colorectum | AD | energy derivation by oxidation of organic compounds | 143/3918 | 318/18723 | 2.78e-22 | 2.49e-19 | 143 |
| GO:0022900 | Colorectum | AD | electron transport chain | 89/3918 | 175/18723 | 1.42e-18 | 8.91e-16 | 89 |
| GO:0019646 | Colorectum | AD | aerobic electron transport chain | 53/3918 | 87/18723 | 5.58e-16 | 2.16e-13 | 53 |
| GO:0042773 | Colorectum | AD | ATP synthesis coupled electron transport | 56/3918 | 95/18723 | 6.76e-16 | 2.22e-13 | 56 |
| GO:0042775 | Colorectum | AD | mitochondrial ATP synthesis coupled electron transport | 56/3918 | 95/18723 | 6.76e-16 | 2.22e-13 | 56 |
| GO:0022904 | Colorectum | AD | respiratory electron transport chain | 63/3918 | 114/18723 | 8.23e-16 | 2.45e-13 | 63 |
| GO:0006120 | Colorectum | AD | mitochondrial electron transport, NADH to ubiquinone | 32/3918 | 51/18723 | 1.12e-10 | 1.11e-08 | 32 |
| GO:0010257 | Colorectum | AD | NADH dehydrogenase complex assembly | 34/3918 | 57/18723 | 2.15e-10 | 1.89e-08 | 34 |
| GO:0032981 | Colorectum | AD | mitochondrial respiratory chain complex I assembly | 34/3918 | 57/18723 | 2.15e-10 | 1.89e-08 | 34 |
| GO:0033108 | Colorectum | AD | mitochondrial respiratory chain complex assembly | 46/3918 | 93/18723 | 8.95e-10 | 6.91e-08 | 46 |
| GO:00090602 | Colorectum | MSS | aerobic respiration | 98/3467 | 189/18723 | 3.35e-25 | 1.05e-21 | 98 |
| GO:00060912 | Colorectum | MSS | generation of precursor metabolites and energy | 186/3467 | 490/18723 | 1.14e-24 | 2.15e-21 | 186 |
| GO:00460342 | Colorectum | MSS | ATP metabolic process | 125/3467 | 277/18723 | 1.38e-24 | 2.15e-21 | 125 |
| GO:00453332 | Colorectum | MSS | cellular respiration | 107/3467 | 230/18723 | 1.64e-22 | 2.05e-19 | 107 |
| GO:00159802 | Colorectum | MSS | energy derivation by oxidation of organic compounds | 131/3467 | 318/18723 | 2.60e-21 | 2.70e-18 | 131 |
| Page: 1 2 3 4 5 6 7 8 9 10 11 12 13 |
| Pathway ID | Tissue | Disease Stage | Description | Gene Ratio | Bg Ratio | pvalue | p.adjust | qvalue | Count |
| hsa05012 | Colorectum | AD | Parkinson disease | 147/2092 | 266/8465 | 2.53e-27 | 8.48e-25 | 5.41e-25 | 147 |
| hsa05208 | Colorectum | AD | Chemical carcinogenesis - reactive oxygen species | 126/2092 | 223/8465 | 1.01e-24 | 1.68e-22 | 1.07e-22 | 126 |
| hsa00190 | Colorectum | AD | Oxidative phosphorylation | 86/2092 | 134/8465 | 2.47e-22 | 2.76e-20 | 1.76e-20 | 86 |
| hsa05415 | Colorectum | AD | Diabetic cardiomyopathy | 114/2092 | 203/8465 | 3.65e-22 | 3.06e-20 | 1.95e-20 | 114 |
| hsa05010 | Colorectum | AD | Alzheimer disease | 174/2092 | 384/8465 | 1.82e-19 | 9.26e-18 | 5.91e-18 | 174 |
| hsa05016 | Colorectum | AD | Huntington disease | 147/2092 | 306/8465 | 1.93e-19 | 9.26e-18 | 5.91e-18 | 147 |
| hsa04714 | Colorectum | AD | Thermogenesis | 120/2092 | 232/8465 | 2.76e-19 | 1.16e-17 | 7.37e-18 | 120 |
| hsa04932 | Colorectum | AD | Non-alcoholic fatty liver disease | 90/2092 | 155/8465 | 4.83e-19 | 1.80e-17 | 1.15e-17 | 90 |
| hsa05020 | Colorectum | AD | Prion disease | 133/2092 | 273/8465 | 2.47e-18 | 8.29e-17 | 5.29e-17 | 133 |
| hsa05014 | Colorectum | AD | Amyotrophic lateral sclerosis | 164/2092 | 364/8465 | 4.28e-18 | 1.27e-16 | 8.09e-17 | 164 |
| hsa05022 | Colorectum | AD | Pathways of neurodegeneration - multiple diseases | 201/2092 | 476/8465 | 4.54e-18 | 1.27e-16 | 8.09e-17 | 201 |
| hsa04723 | Colorectum | AD | Retrograde endocannabinoid signaling | 59/2092 | 148/8465 | 2.94e-05 | 2.73e-04 | 1.74e-04 | 59 |
| hsa050121 | Colorectum | AD | Parkinson disease | 147/2092 | 266/8465 | 2.53e-27 | 8.48e-25 | 5.41e-25 | 147 |
| hsa052081 | Colorectum | AD | Chemical carcinogenesis - reactive oxygen species | 126/2092 | 223/8465 | 1.01e-24 | 1.68e-22 | 1.07e-22 | 126 |
| hsa001901 | Colorectum | AD | Oxidative phosphorylation | 86/2092 | 134/8465 | 2.47e-22 | 2.76e-20 | 1.76e-20 | 86 |
| hsa054151 | Colorectum | AD | Diabetic cardiomyopathy | 114/2092 | 203/8465 | 3.65e-22 | 3.06e-20 | 1.95e-20 | 114 |
| hsa050101 | Colorectum | AD | Alzheimer disease | 174/2092 | 384/8465 | 1.82e-19 | 9.26e-18 | 5.91e-18 | 174 |
| hsa050161 | Colorectum | AD | Huntington disease | 147/2092 | 306/8465 | 1.93e-19 | 9.26e-18 | 5.91e-18 | 147 |
| hsa047141 | Colorectum | AD | Thermogenesis | 120/2092 | 232/8465 | 2.76e-19 | 1.16e-17 | 7.37e-18 | 120 |
| hsa049321 | Colorectum | AD | Non-alcoholic fatty liver disease | 90/2092 | 155/8465 | 4.83e-19 | 1.80e-17 | 1.15e-17 | 90 |
| Page: 1 2 3 4 5 6 7 8 9 10 11 12 13 14 15 16 |
Top |
Cell-cell communication analysis |
| Identification of potential cell-cell interactions between two cell types and their ligand-receptor pairs for different disease states |
| Ligand | Receptor | LRpair | Pathway | Tissue | Disease Stage |
| Page: 1 |
Top |
Single-cell gene regulatory network inference analysis |
| Find out the significant the regulons (TFs) and the target genes of each regulon across cell types for different disease states |
| TF | Cell Type | Tissue | Disease Stage | Target Gene | RSS | Regulon Activity |
| ∗The dot plots of a searched regulon are shown for all cell subpopulations in each disease state of each tissue based on the regulon specific score inferred using pySCENIC and by calculating the average expression. |
| Page: 1 |
Top |
Somatic mutation of malignant transformation related genes |
| Annotation of somatic variants for genes involved in malignant transformation |
| Hugo Symbol | Variant Class | Variant Classification | dbSNP RS | HGVSc | HGVSp | HGVSp Short | SWISSPROT | BIOTYPE | SIFT | PolyPhen | Tumor Sample Barcode | Tissue | Histology | Sex | Age | Stage | Therapy Types | Drugs | Outcome |
| NDUFA5 | SNV | Missense_Mutation | c.314A>G | p.Glu105Gly | p.E105G | Q16718 | protein_coding | tolerated(0.1) | benign(0.127) | TCGA-A8-A07W-01 | Breast | breast invasive carcinoma | Female | >=65 | III/IV | Hormone Therapy | exemestane | SD | |
| NDUFA5 | deletion | Frame_Shift_Del | c.122delN | p.Asn41MetfsTer28 | p.N41Mfs*28 | Q16718 | protein_coding | TCGA-CK-5916-01 | Colorectum | colon adenocarcinoma | Female | >=65 | I/II | Unknown | Unknown | PD | |||
| NDUFA5 | SNV | Missense_Mutation | novel | c.320C>T | p.Pro107Leu | p.P107L | Q16718 | protein_coding | deleterious(0.04) | benign(0.111) | TCGA-A5-A0G1-01 | Endometrium | uterine corpus endometrioid carcinoma | Female | >=65 | I/II | Unknown | Unknown | SD |
| NDUFA5 | SNV | Missense_Mutation | novel | c.320N>T | p.Pro107Leu | p.P107L | Q16718 | protein_coding | deleterious(0.04) | benign(0.111) | TCGA-A5-A0GG-01 | Endometrium | uterine corpus endometrioid carcinoma | Female | >=65 | I/II | Unknown | Unknown | SD |
| NDUFA5 | SNV | Missense_Mutation | novel | c.134N>T | p.Arg45Ile | p.R45I | Q16718 | protein_coding | deleterious(0) | probably_damaging(0.995) | TCGA-AP-A1DV-01 | Endometrium | uterine corpus endometrioid carcinoma | Female | <65 | I/II | Unknown | Unknown | SD |
| NDUFA5 | SNV | Missense_Mutation | novel | c.212N>G | p.Gln71Arg | p.Q71R | Q16718 | protein_coding | tolerated(0.16) | benign(0.003) | TCGA-B5-A3FA-01 | Endometrium | uterine corpus endometrioid carcinoma | Female | >=65 | I/II | Unknown | Unknown | SD |
| NDUFA5 | SNV | Missense_Mutation | novel | c.90N>T | p.Lys30Asn | p.K30N | Q16718 | protein_coding | deleterious(0.02) | benign(0.208) | TCGA-D1-A16X-01 | Endometrium | uterine corpus endometrioid carcinoma | Female | <65 | I/II | Unknown | Unknown | SD |
| NDUFA5 | SNV | Missense_Mutation | c.28N>T | p.Gly10Cys | p.G10C | Q16718 | protein_coding | deleterious(0) | probably_damaging(0.98) | TCGA-CC-A3MC-01 | Liver | liver hepatocellular carcinoma | Male | <65 | III/IV | Unknown | Unknown | PD | |
| NDUFA5 | SNV | Missense_Mutation | novel | c.149A>T | p.Gln50Leu | p.Q50L | Q16718 | protein_coding | deleterious(0.04) | possibly_damaging(0.735) | TCGA-DD-AACL-01 | Liver | liver hepatocellular carcinoma | Female | >=65 | I/II | Unknown | Unknown | SD |
| NDUFA5 | SNV | Missense_Mutation | novel | c.282G>A | p.Met94Ile | p.M94I | Q16718 | protein_coding | tolerated(0.1) | benign(0.14) | TCGA-78-7156-01 | Lung | lung adenocarcinoma | Male | <65 | III/IV | Unknown | Unknown | SD |
| Page: 1 2 |
Top |
Related drugs of malignant transformation related genes |
| Identification of chemicals and drugs interact with genes involved in malignant transfromation |
| (DGIdb 4.0) |
| Entrez ID | Symbol | Category | Interaction Types | Drug Claim Name | Drug Name | PMIDs |
| 4698 | NDUFA5 | ENZYME | inhibitor | CHEMBL3545320 | ME-344 | |
| 4698 | NDUFA5 | ENZYME | inhibitor | CHEMBL1703 | METFORMIN HYDROCHLORIDE | |
| 4698 | NDUFA5 | ENZYME | inhibitor | CHEMBL3545135 | NV-128 |
| Page: 1 |

Copyright 2023-Present -The University of Texas Health Science Center at Houston |