| Tissue | Expression Dynamics | Abbreviation |
| Breast | 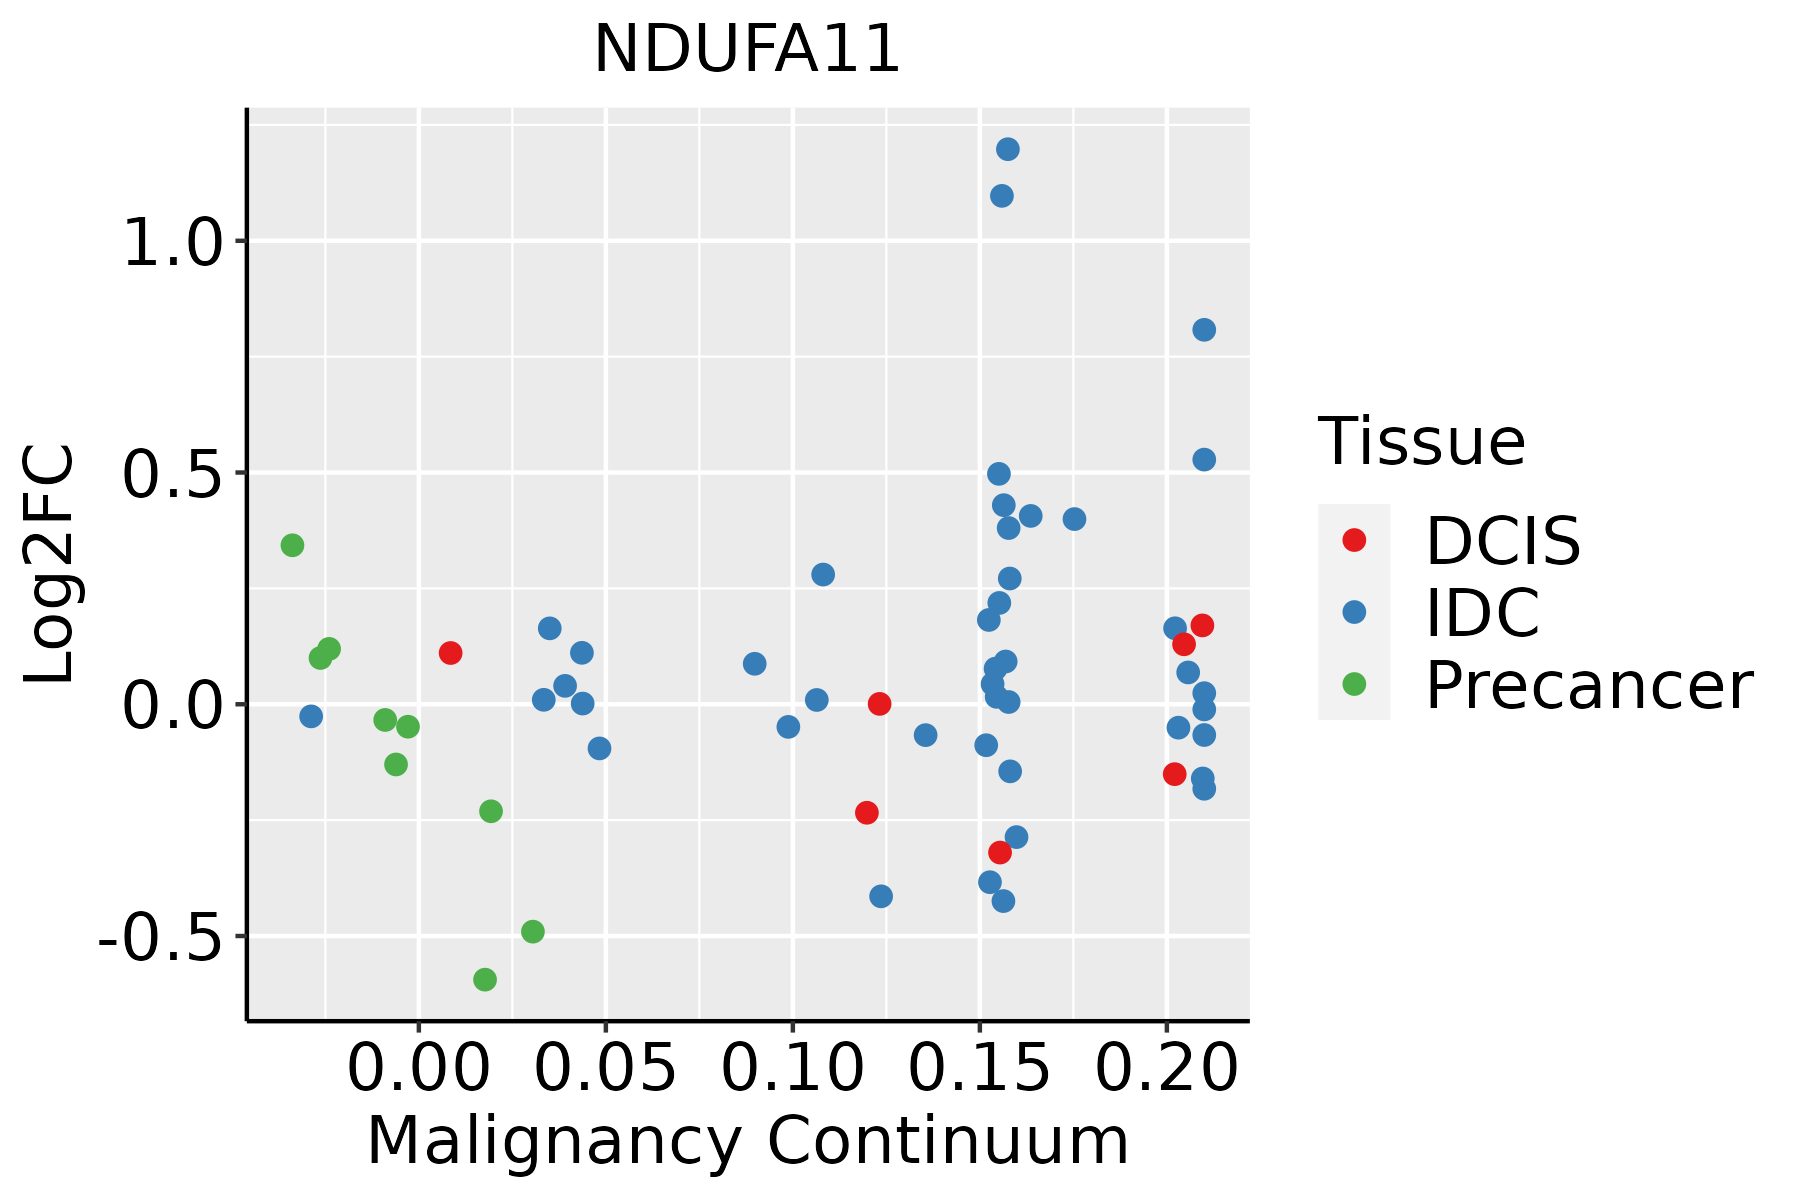 | IDC: Invasive ductal carcinoma |
| DCIS: Ductal carcinoma in situ |
| Precancer(BRCA1-mut): Precancerous lesion from BRCA1 mutation carriers |
| Cervix | 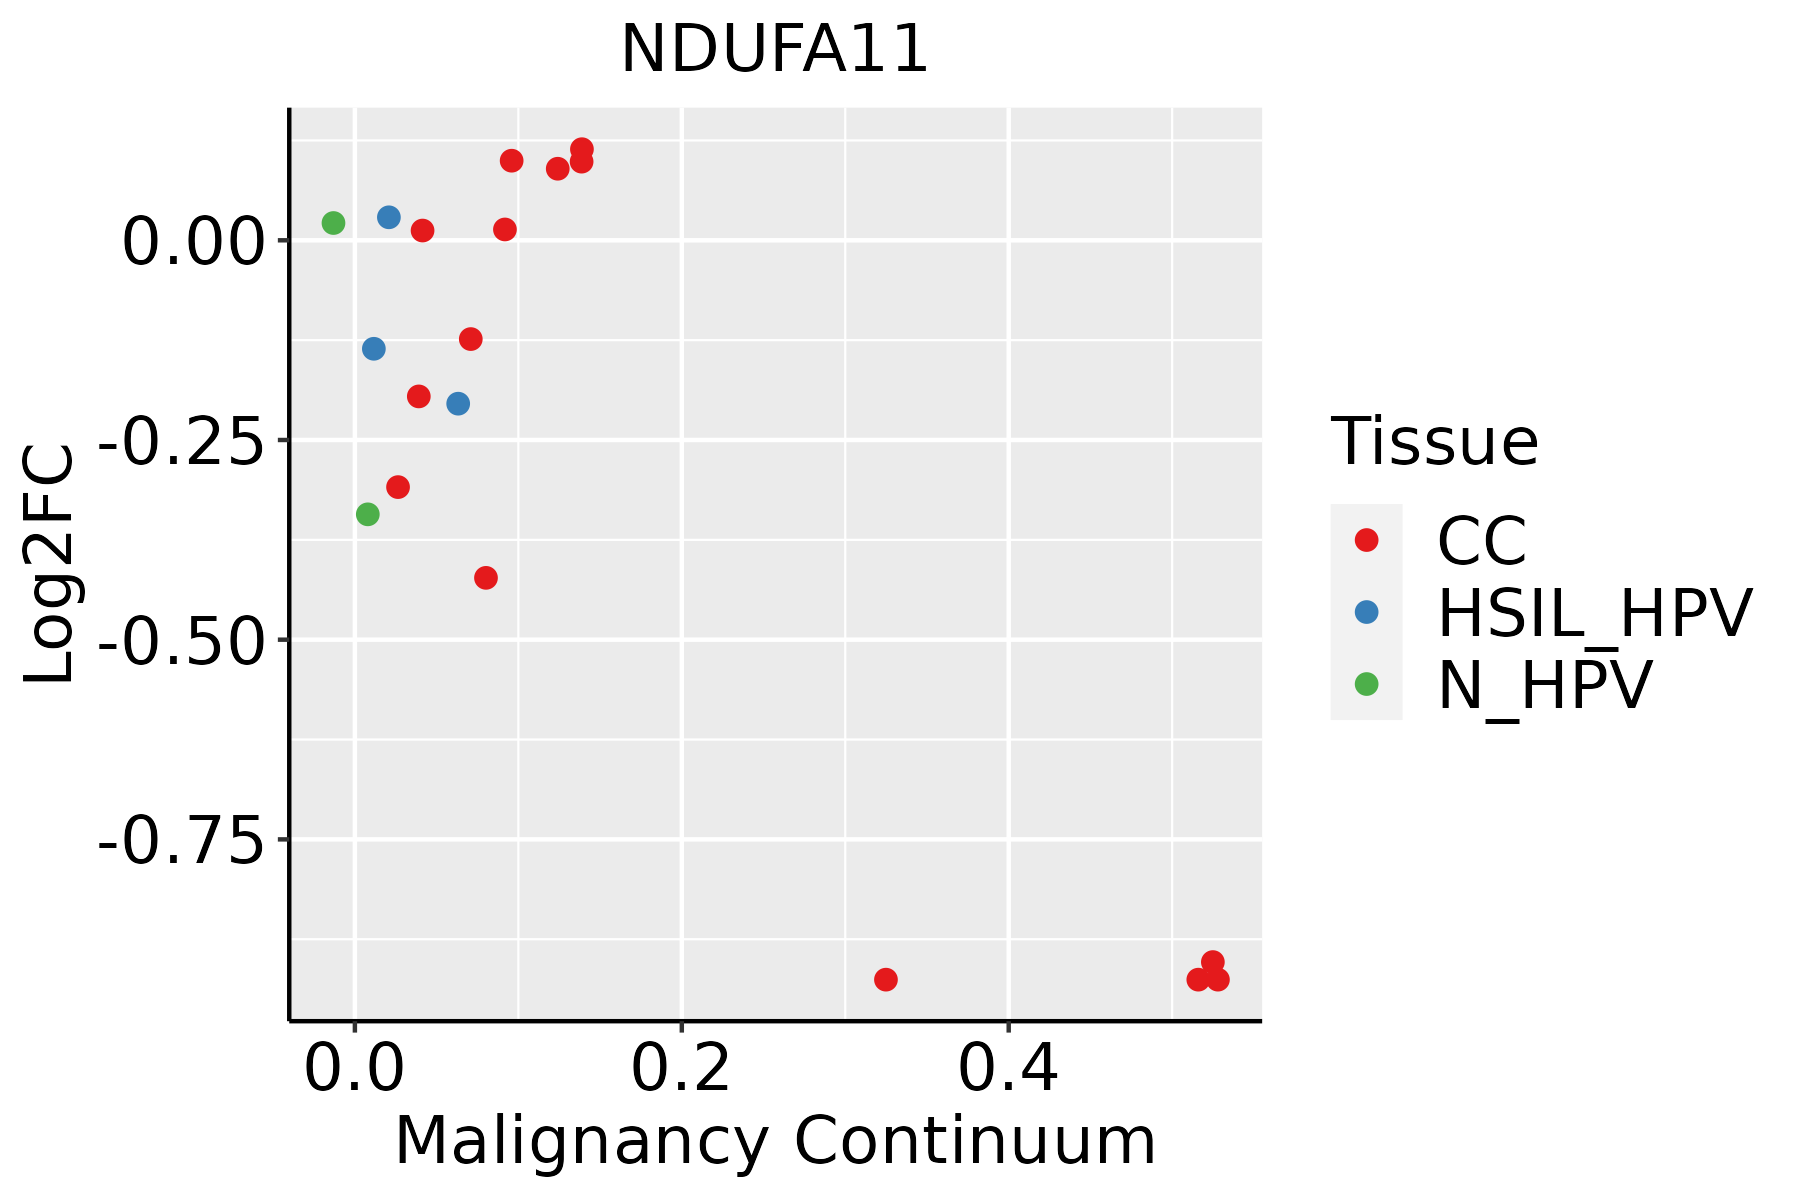 | CC: Cervix cancer |
| HSIL_HPV: HPV-infected high-grade squamous intraepithelial lesions |
| N_HPV: HPV-infected normal cervix |
| Colorectum (GSE201348) |  | FAP: Familial adenomatous polyposis |
| CRC: Colorectal cancer |
| Colorectum (HTA11) |  | AD: Adenomas |
| SER: Sessile serrated lesions |
| MSI-H: Microsatellite-high colorectal cancer |
| MSS: Microsatellite stable colorectal cancer |
| Endometrium | 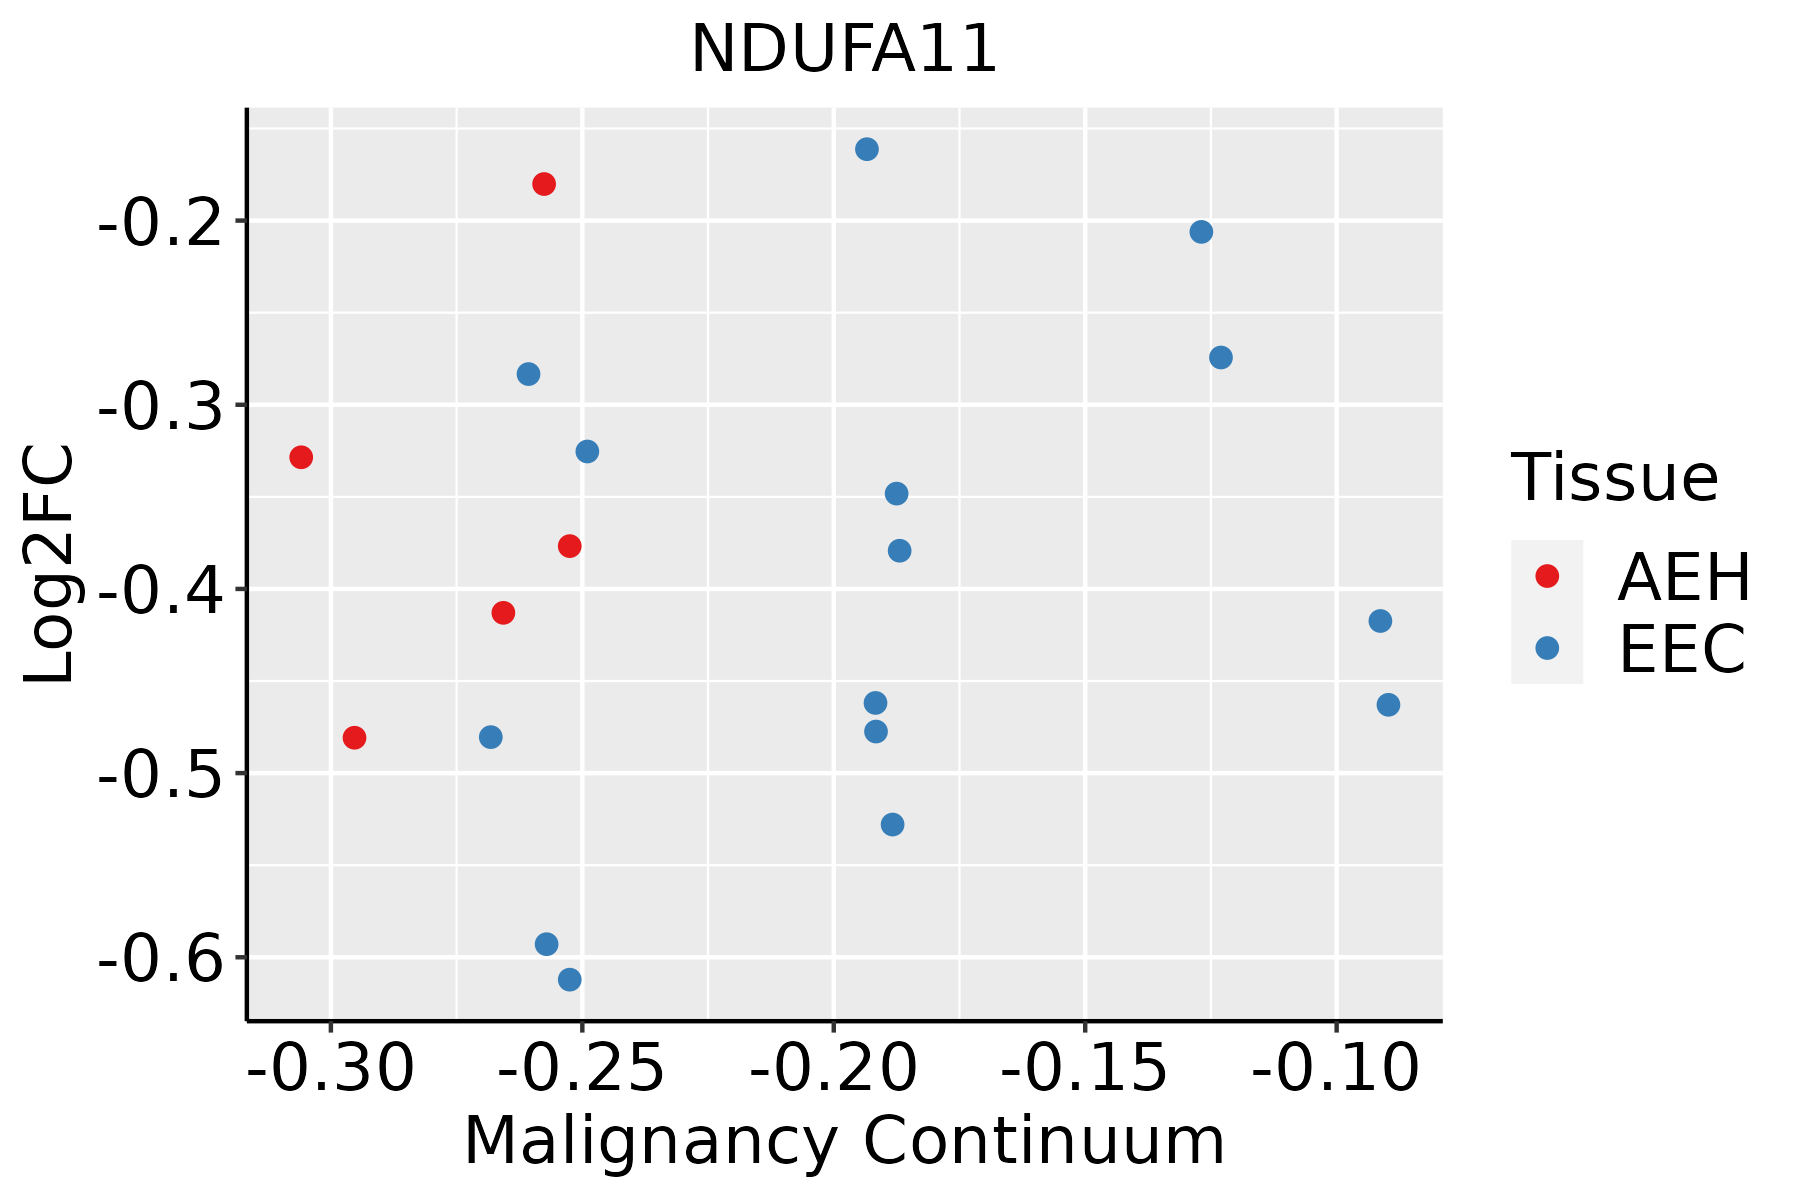 | AEH: Atypical endometrial hyperplasia |
| EEC: Endometrioid Cancer |
| Esophagus | 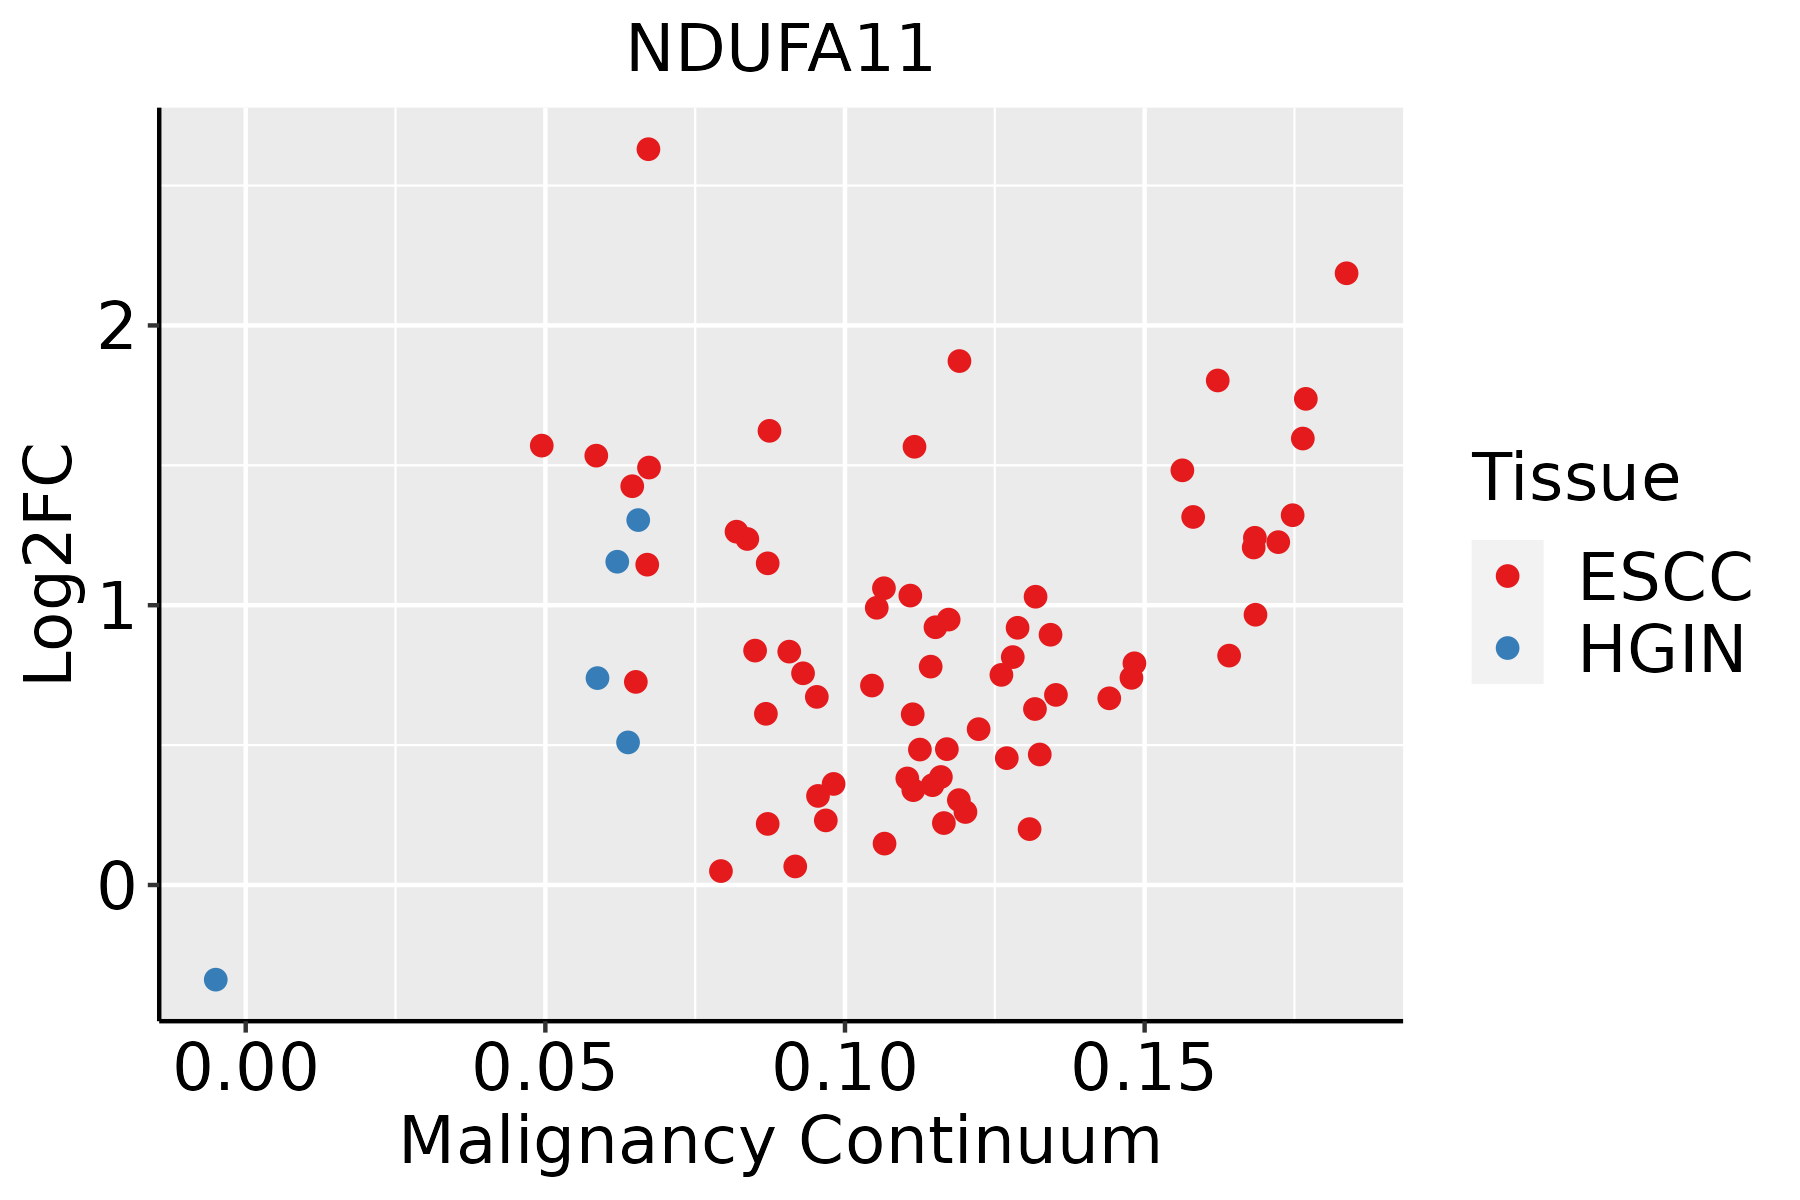 | ESCC: Esophageal squamous cell carcinoma |
| HGIN: High-grade intraepithelial neoplasias |
| LGIN: Low-grade intraepithelial neoplasias |
| GC |  | CAG: Chronic atrophic gastritis |
| CAG with IM: Chronic atrophic gastritis with intestinal metaplasia |
| CSG: Chronic superficial gastritis |
| GC: Gastric cancer |
| SIM: Severe intestinal metaplasia |
| WIM: Wild intestinal metaplasia |
| Liver | 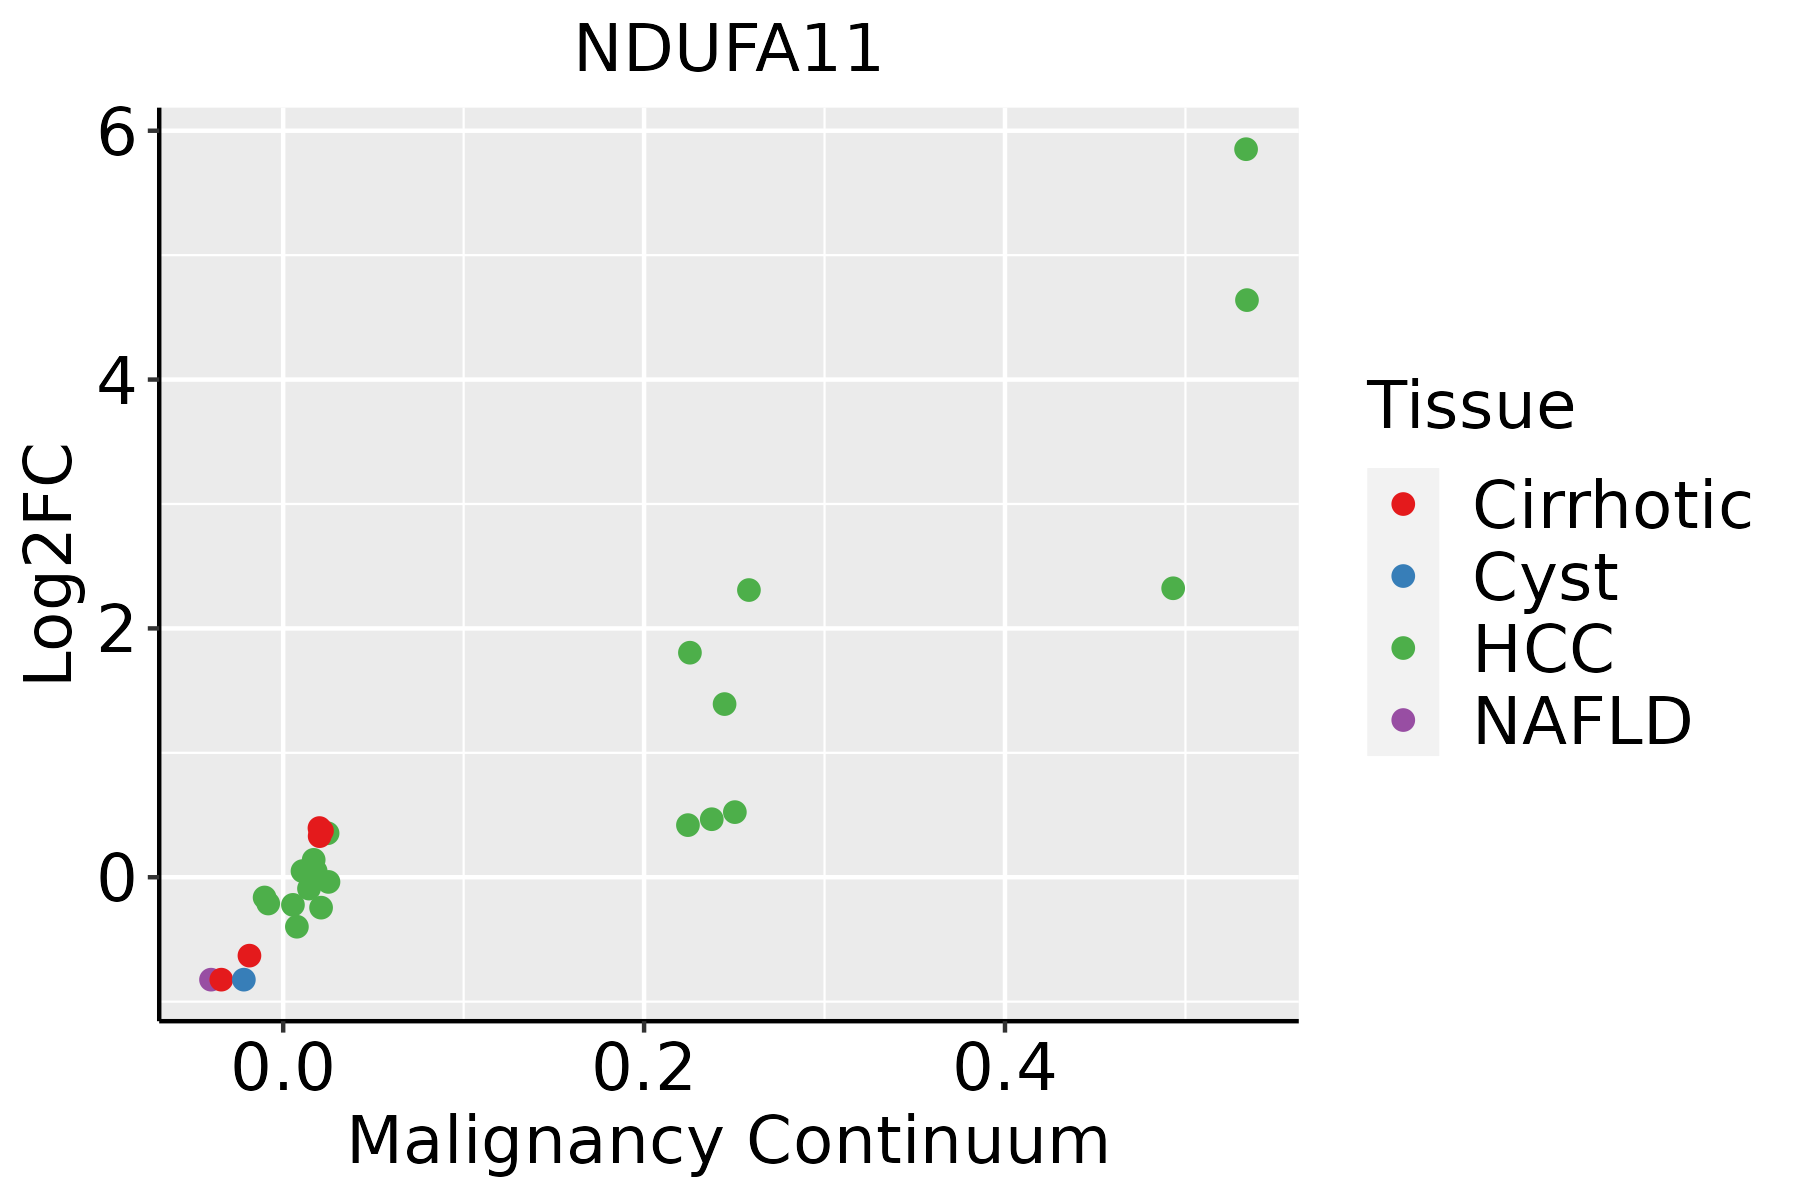 | HCC: Hepatocellular carcinoma |
| NAFLD: Non-alcoholic fatty liver disease |
| Oral Cavity |  | EOLP: Erosive Oral lichen planus |
| LP: leukoplakia |
| NEOLP: Non-erosive oral lichen planus |
| OSCC: Oral squamous cell carcinoma |
| Prostate | 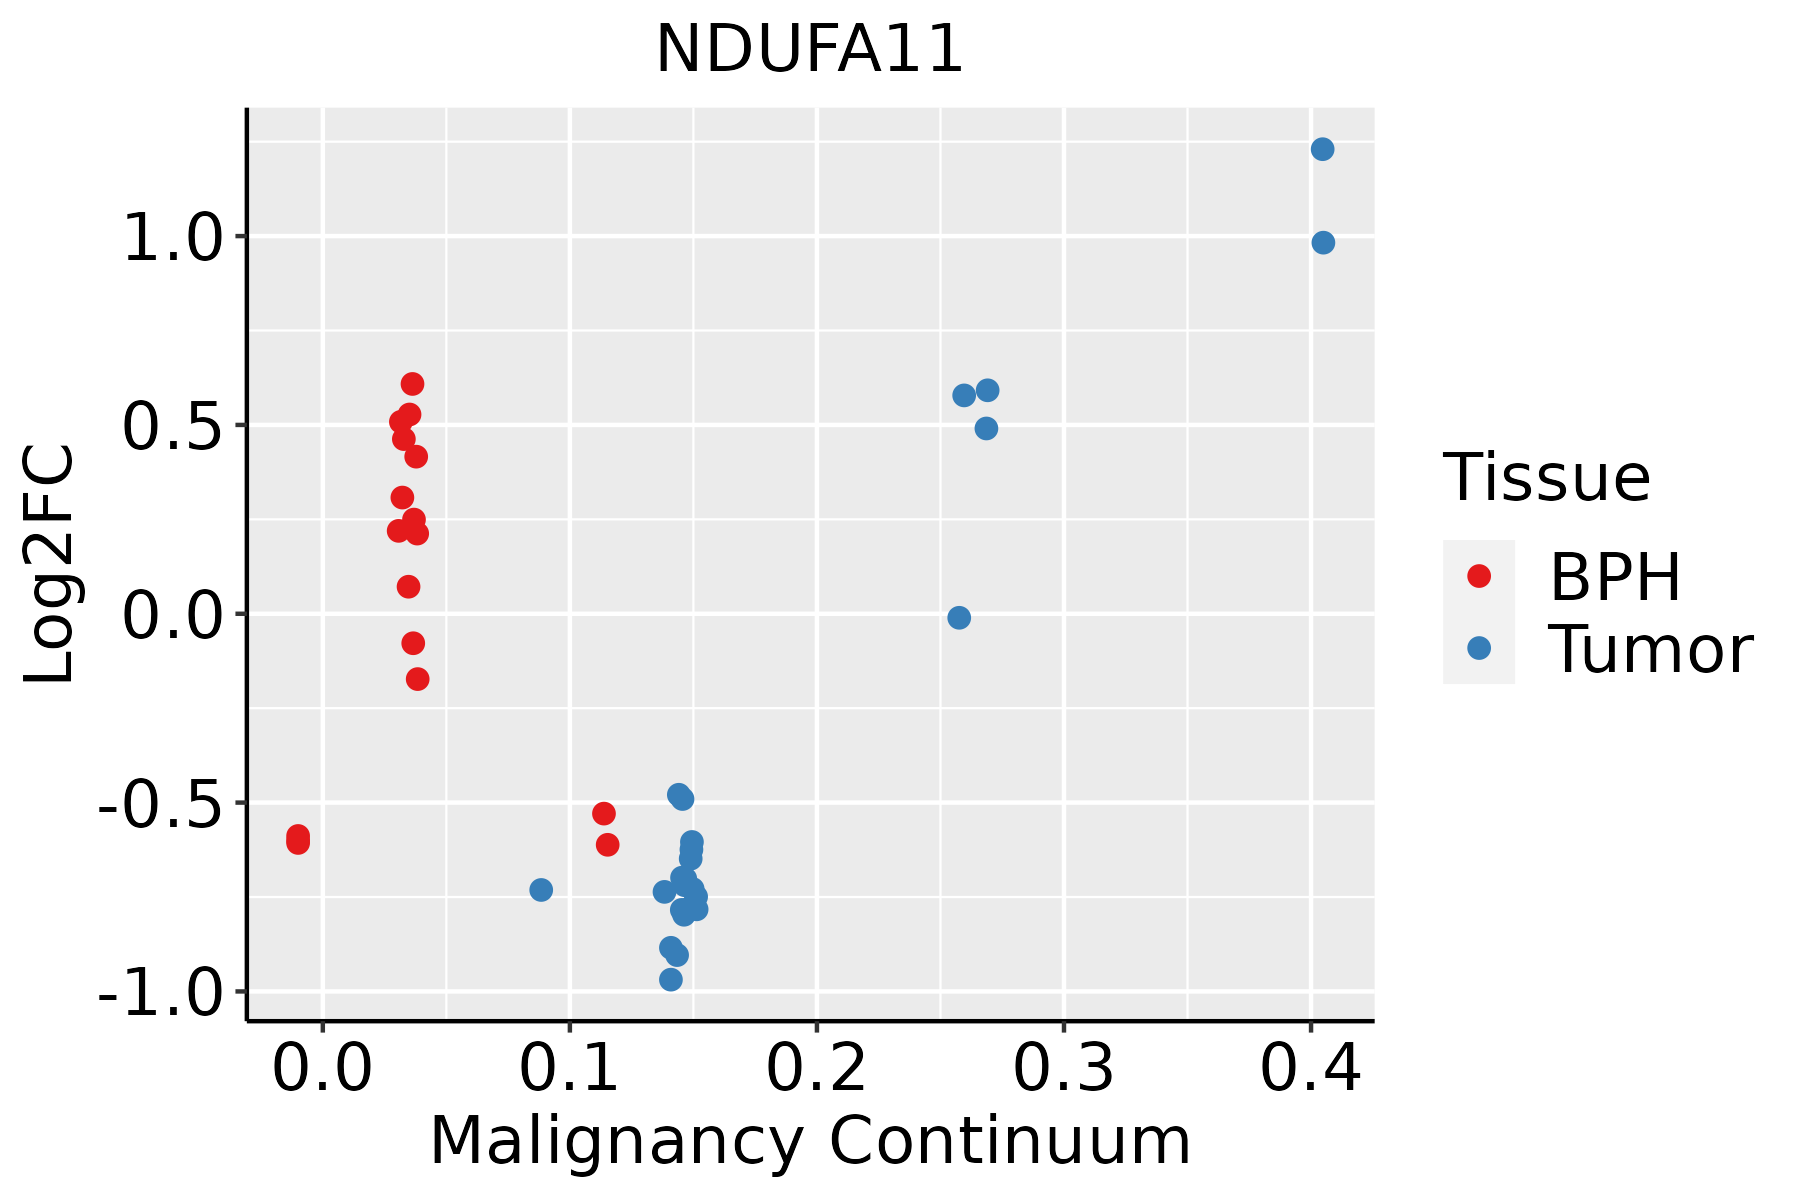 | BPH: Benign Prostatic Hyperplasia |
| Skin | 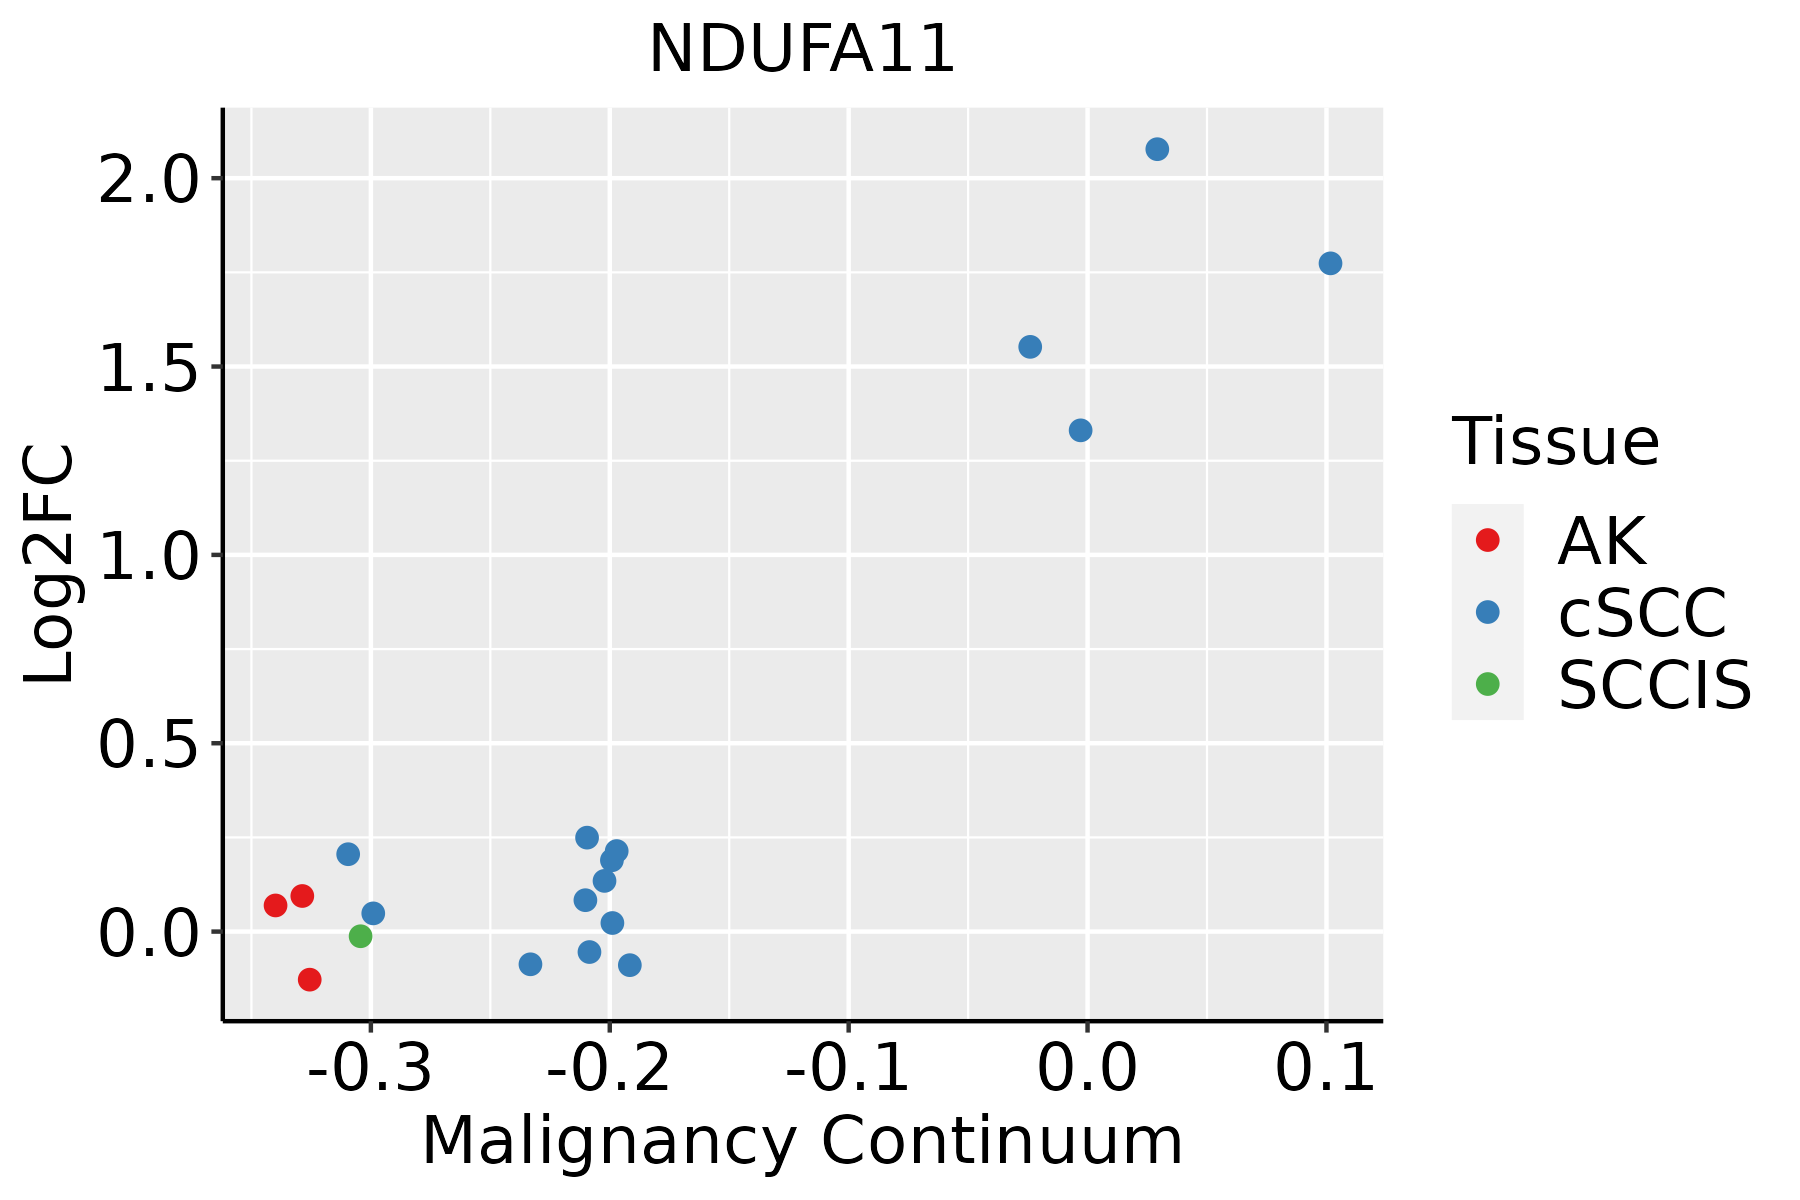 | AK: Actinic keratosis |
| cSCC: Cutaneous squamous cell carcinoma |
| SCCIS:squamous cell carcinoma in situ |
| Thyroid |  | ATC: Anaplastic thyroid cancer |
| HT: Hashimoto's thyroiditis |
| PTC: Papillary thyroid cancer |
| GO ID | Tissue | Disease Stage | Description | Gene Ratio | Bg Ratio | pvalue | p.adjust | Count |
| GO:00102578 | Breast | Precancer | NADH dehydrogenase complex assembly | 19/1080 | 57/18723 | 1.93e-10 | 1.92e-08 | 19 |
| GO:00329818 | Breast | Precancer | mitochondrial respiratory chain complex I assembly | 19/1080 | 57/18723 | 1.93e-10 | 1.92e-08 | 19 |
| GO:00331088 | Breast | Precancer | mitochondrial respiratory chain complex assembly | 24/1080 | 93/18723 | 3.39e-10 | 3.16e-08 | 24 |
| GO:001025713 | Breast | IDC | NADH dehydrogenase complex assembly | 22/1434 | 57/18723 | 6.20e-11 | 8.80e-09 | 22 |
| GO:003298113 | Breast | IDC | mitochondrial respiratory chain complex I assembly | 22/1434 | 57/18723 | 6.20e-11 | 8.80e-09 | 22 |
| GO:003310813 | Breast | IDC | mitochondrial respiratory chain complex assembly | 28/1434 | 93/18723 | 1.54e-10 | 1.83e-08 | 28 |
| GO:001025723 | Breast | DCIS | NADH dehydrogenase complex assembly | 22/1390 | 57/18723 | 3.38e-11 | 5.17e-09 | 22 |
| GO:003298123 | Breast | DCIS | mitochondrial respiratory chain complex I assembly | 22/1390 | 57/18723 | 3.38e-11 | 5.17e-09 | 22 |
| GO:003310823 | Breast | DCIS | mitochondrial respiratory chain complex assembly | 28/1390 | 93/18723 | 7.50e-11 | 9.43e-09 | 28 |
| GO:00102579 | Cervix | CC | NADH dehydrogenase complex assembly | 22/2311 | 57/18723 | 4.28e-07 | 1.67e-05 | 22 |
| GO:00329819 | Cervix | CC | mitochondrial respiratory chain complex I assembly | 22/2311 | 57/18723 | 4.28e-07 | 1.67e-05 | 22 |
| GO:00331089 | Cervix | CC | mitochondrial respiratory chain complex assembly | 26/2311 | 93/18723 | 3.97e-05 | 6.18e-04 | 26 |
| GO:001025714 | Cervix | N_HPV | NADH dehydrogenase complex assembly | 10/534 | 57/18723 | 4.24e-06 | 1.65e-04 | 10 |
| GO:003298114 | Cervix | N_HPV | mitochondrial respiratory chain complex I assembly | 10/534 | 57/18723 | 4.24e-06 | 1.65e-04 | 10 |
| GO:003310814 | Cervix | N_HPV | mitochondrial respiratory chain complex assembly | 10/534 | 93/18723 | 3.17e-04 | 4.75e-03 | 10 |
| GO:0010257 | Colorectum | AD | NADH dehydrogenase complex assembly | 34/3918 | 57/18723 | 2.15e-10 | 1.89e-08 | 34 |
| GO:0032981 | Colorectum | AD | mitochondrial respiratory chain complex I assembly | 34/3918 | 57/18723 | 2.15e-10 | 1.89e-08 | 34 |
| GO:0033108 | Colorectum | AD | mitochondrial respiratory chain complex assembly | 46/3918 | 93/18723 | 8.95e-10 | 6.91e-08 | 46 |
| GO:00102571 | Colorectum | SER | NADH dehydrogenase complex assembly | 30/2897 | 57/18723 | 7.92e-11 | 1.19e-08 | 30 |
| GO:00329811 | Colorectum | SER | mitochondrial respiratory chain complex I assembly | 30/2897 | 57/18723 | 7.92e-11 | 1.19e-08 | 30 |
| Pathway ID | Tissue | Disease Stage | Description | Gene Ratio | Bg Ratio | pvalue | p.adjust | qvalue | Count |
| hsa0501218 | Breast | Precancer | Parkinson disease | 99/684 | 266/8465 | 3.58e-42 | 5.65e-40 | 4.33e-40 | 99 |
| hsa0502016 | Breast | Precancer | Prion disease | 95/684 | 273/8465 | 1.39e-37 | 1.46e-35 | 1.12e-35 | 95 |
| hsa0501616 | Breast | Precancer | Huntington disease | 98/684 | 306/8465 | 2.85e-35 | 2.25e-33 | 1.72e-33 | 98 |
| hsa0019016 | Breast | Precancer | Oxidative phosphorylation | 59/684 | 134/8465 | 6.15e-30 | 3.24e-28 | 2.48e-28 | 59 |
| hsa0501016 | Breast | Precancer | Alzheimer disease | 103/684 | 384/8465 | 1.03e-29 | 4.66e-28 | 3.57e-28 | 103 |
| hsa0501416 | Breast | Precancer | Amyotrophic lateral sclerosis | 98/684 | 364/8465 | 2.13e-28 | 8.41e-27 | 6.44e-27 | 98 |
| hsa0502216 | Breast | Precancer | Pathways of neurodegeneration - multiple diseases | 112/684 | 476/8465 | 6.96e-27 | 2.44e-25 | 1.87e-25 | 112 |
| hsa0520818 | Breast | Precancer | Chemical carcinogenesis - reactive oxygen species | 68/684 | 223/8465 | 3.61e-23 | 1.14e-21 | 8.73e-22 | 68 |
| hsa0471418 | Breast | Precancer | Thermogenesis | 68/684 | 232/8465 | 4.40e-22 | 1.26e-20 | 9.69e-21 | 68 |
| hsa0541518 | Breast | Precancer | Diabetic cardiomyopathy | 63/684 | 203/8465 | 5.63e-22 | 1.48e-20 | 1.14e-20 | 63 |
| hsa0493216 | Breast | Precancer | Non-alcoholic fatty liver disease | 48/684 | 155/8465 | 6.16e-17 | 1.50e-15 | 1.15e-15 | 48 |
| hsa0472316 | Breast | Precancer | Retrograde endocannabinoid signaling | 25/684 | 148/8465 | 3.05e-04 | 2.47e-03 | 1.89e-03 | 25 |
| hsa0501219 | Breast | Precancer | Parkinson disease | 99/684 | 266/8465 | 3.58e-42 | 5.65e-40 | 4.33e-40 | 99 |
| hsa0502017 | Breast | Precancer | Prion disease | 95/684 | 273/8465 | 1.39e-37 | 1.46e-35 | 1.12e-35 | 95 |
| hsa0501617 | Breast | Precancer | Huntington disease | 98/684 | 306/8465 | 2.85e-35 | 2.25e-33 | 1.72e-33 | 98 |
| hsa0019017 | Breast | Precancer | Oxidative phosphorylation | 59/684 | 134/8465 | 6.15e-30 | 3.24e-28 | 2.48e-28 | 59 |
| hsa0501017 | Breast | Precancer | Alzheimer disease | 103/684 | 384/8465 | 1.03e-29 | 4.66e-28 | 3.57e-28 | 103 |
| hsa0501417 | Breast | Precancer | Amyotrophic lateral sclerosis | 98/684 | 364/8465 | 2.13e-28 | 8.41e-27 | 6.44e-27 | 98 |
| hsa0502217 | Breast | Precancer | Pathways of neurodegeneration - multiple diseases | 112/684 | 476/8465 | 6.96e-27 | 2.44e-25 | 1.87e-25 | 112 |
| hsa0520819 | Breast | Precancer | Chemical carcinogenesis - reactive oxygen species | 68/684 | 223/8465 | 3.61e-23 | 1.14e-21 | 8.73e-22 | 68 |
| Hugo Symbol | Variant Class | Variant Classification | dbSNP RS | HGVSc | HGVSp | HGVSp Short | SWISSPROT | BIOTYPE | SIFT | PolyPhen | Tumor Sample Barcode | Tissue | Histology | Sex | Age | Stage | Therapy Types | Drugs | Outcome |
| NDUFA11 | SNV | Missense_Mutation | novel | c.170N>C | p.Gly57Ala | p.G57A | Q86Y39 | protein_coding | tolerated_low_confidence(0.29) | probably_damaging(0.998) | TCGA-C8-A8HQ-01 | Breast | breast invasive carcinoma | Female | <65 | I/II | Unknown | Unknown | SD |
| NDUFA11 | SNV | Missense_Mutation | novel | c.411G>A | p.Met137Ile | p.M137I | Q86Y39 | protein_coding | tolerated_low_confidence(0.07) | benign(0) | TCGA-VS-A8QM-01 | Cervix | cervical & endocervical cancer | Female | <65 | I/II | Chemotherapy | cisplatin | PD |
| NDUFA11 | SNV | Missense_Mutation | | c.221N>T | p.Thr74Ile | p.T74I | Q86Y39 | protein_coding | deleterious_low_confidence(0) | benign(0.153) | TCGA-AZ-5407-01 | Colorectum | colon adenocarcinoma | Female | <65 | I/II | Unknown | Unknown | SD |
| NDUFA11 | SNV | Missense_Mutation | novel | c.643N>T | p.Ile215Leu | p.I215L | Q86Y39 | protein_coding | | benign(0) | TCGA-EO-A22X-01 | Endometrium | uterine corpus endometrioid carcinoma | Female | <65 | III/IV | Unspecific | Carboplatin | Complete Response |
| NDUFA11 | deletion | Frame_Shift_Del | novel | c.514delG | p.Ala172HisfsTer21 | p.A172Hfs*21 | Q86Y39 | protein_coding | | | TCGA-AP-A1DH-01 | Endometrium | uterine corpus endometrioid carcinoma | Female | <65 | I/II | Unknown | Unknown | SD |
| NDUFA11 | deletion | Frame_Shift_Del | novel | c.514delN | p.Ala172HisfsTer21 | p.A172Hfs*21 | Q86Y39 | protein_coding | | | TCGA-DI-A1BU-01 | Endometrium | uterine corpus endometrioid carcinoma | Female | <65 | I/II | Chemotherapy | paclitaxel | SD |
| NDUFA11 | insertion | Frame_Shift_Ins | novel | c.514dupG | p.Ala172GlyfsTer256 | p.A172Gfs*256 | Q86Y39 | protein_coding | | | TCGA-EO-A22U-01 | Endometrium | uterine corpus endometrioid carcinoma | Female | >=65 | I/II | Unknown | Unknown | SD |


