Schematic overview of the cellular and molecular mechanisms involved in the cancer progression, including the proposed cellular and molecular mechanisms in cancer cells trajectory. AT1: alveolar type 1 cells; AT2: alveolar type 2 cells; AAH: atypical adenomatous hyperplasia; AIS: adenocarcinoma in situ; MIA: minimally invasive adenocarcinoma; IA: invasive adenocarcinoma; EMT: epithelial-mesenchymal transition

Home

Download

Statistics

Help

Contact

Center for Computational Systems Medicine
leaf

Gene summary

leaf

Malignant transformation analysis

leaf

Malignant transformation related pathway analysis

leaf

Cell-cell communication analysis

leaf

Single-cell gene regulatory network inference analysis

leaf

Somatic mutation of malignant transformation related genes

leaf

Related drugs of malignant transformation related genes

Gene: NDST1

Gene summary for NDST1

check button Gene summary.

Gene informationSpeciesHuman
Gene symbol

NDST1

Gene ID

3340

Gene nameN-deacetylase and N-sulfotransferase 1
Gene AliasHSST
Cytomap5q33.1
Gene Typeprotein-coding
GO ID

GO:0000165

UniProtAcc

B7Z1Q0


Top

Malignant transformation analysis

check button Identification of the aberrant gene expression in precancerous and cancerous lesions by comparing the gene expression of stem-like cells in diseased tissues with normal stem cells
check button Malignant transformation involving gene list.
Entrez IDSymbolReplicatesSpeciesOrganTissueAdj P-valueLog2FCMalignancy
3340NDST1LZE24THumanEsophagusESCC3.85e-028.68e-020.0596
3340NDST1P2T-EHumanEsophagusESCC9.72e-071.14e-010.1177
3340NDST1P5T-EHumanEsophagusESCC5.50e-089.51e-020.1327
3340NDST1P8T-EHumanEsophagusESCC2.17e-077.37e-020.0889
3340NDST1P9T-EHumanEsophagusESCC8.59e-061.28e-010.1131
3340NDST1P10T-EHumanEsophagusESCC5.99e-038.35e-020.116
3340NDST1P11T-EHumanEsophagusESCC1.37e-073.34e-010.1426
3340NDST1P12T-EHumanEsophagusESCC6.62e-061.46e-010.1122
3340NDST1P15T-EHumanEsophagusESCC2.50e-031.22e-010.1149
3340NDST1P16T-EHumanEsophagusESCC9.22e-121.06e-010.1153
3340NDST1P17T-EHumanEsophagusESCC4.06e-041.49e-010.1278
3340NDST1P19T-EHumanEsophagusESCC3.58e-053.34e-010.1662
3340NDST1P21T-EHumanEsophagusESCC6.69e-131.70e-010.1617
3340NDST1P22T-EHumanEsophagusESCC1.91e-099.90e-020.1236
3340NDST1P23T-EHumanEsophagusESCC1.25e-049.99e-020.108
3340NDST1P24T-EHumanEsophagusESCC4.13e-068.47e-020.1287
3340NDST1P26T-EHumanEsophagusESCC1.40e-057.42e-020.1276
3340NDST1P27T-EHumanEsophagusESCC3.35e-111.26e-010.1055
3340NDST1P28T-EHumanEsophagusESCC2.41e-091.79e-010.1149
3340NDST1P30T-EHumanEsophagusESCC1.76e-072.65e-010.137
Page: 1 2 3 4 

check button Transcriptomic changes along malignancy continuum.
TissueExpression DynamicsAbbreviation
EsophagusThe image shows the transcriptomic changes along malignancy continuum.log2FC in expression of this searched gene in stem-like cells from each diseased tissue sample relative to stem-like cells in normal samples in each tissue plotted against the malignancy continuum. Samples are colored based on if they are from different disease stage.ESCC: Esophageal squamous cell carcinoma
HGIN: High-grade intraepithelial neoplasias
LGIN: Low-grade intraepithelial neoplasias
LiverThe image shows the transcriptomic changes along malignancy continuum.log2FC in expression of this searched gene in stem-like cells from each diseased tissue sample relative to stem-like cells in normal samples in each tissue plotted against the malignancy continuum. Samples are colored based on if they are from different disease stage.
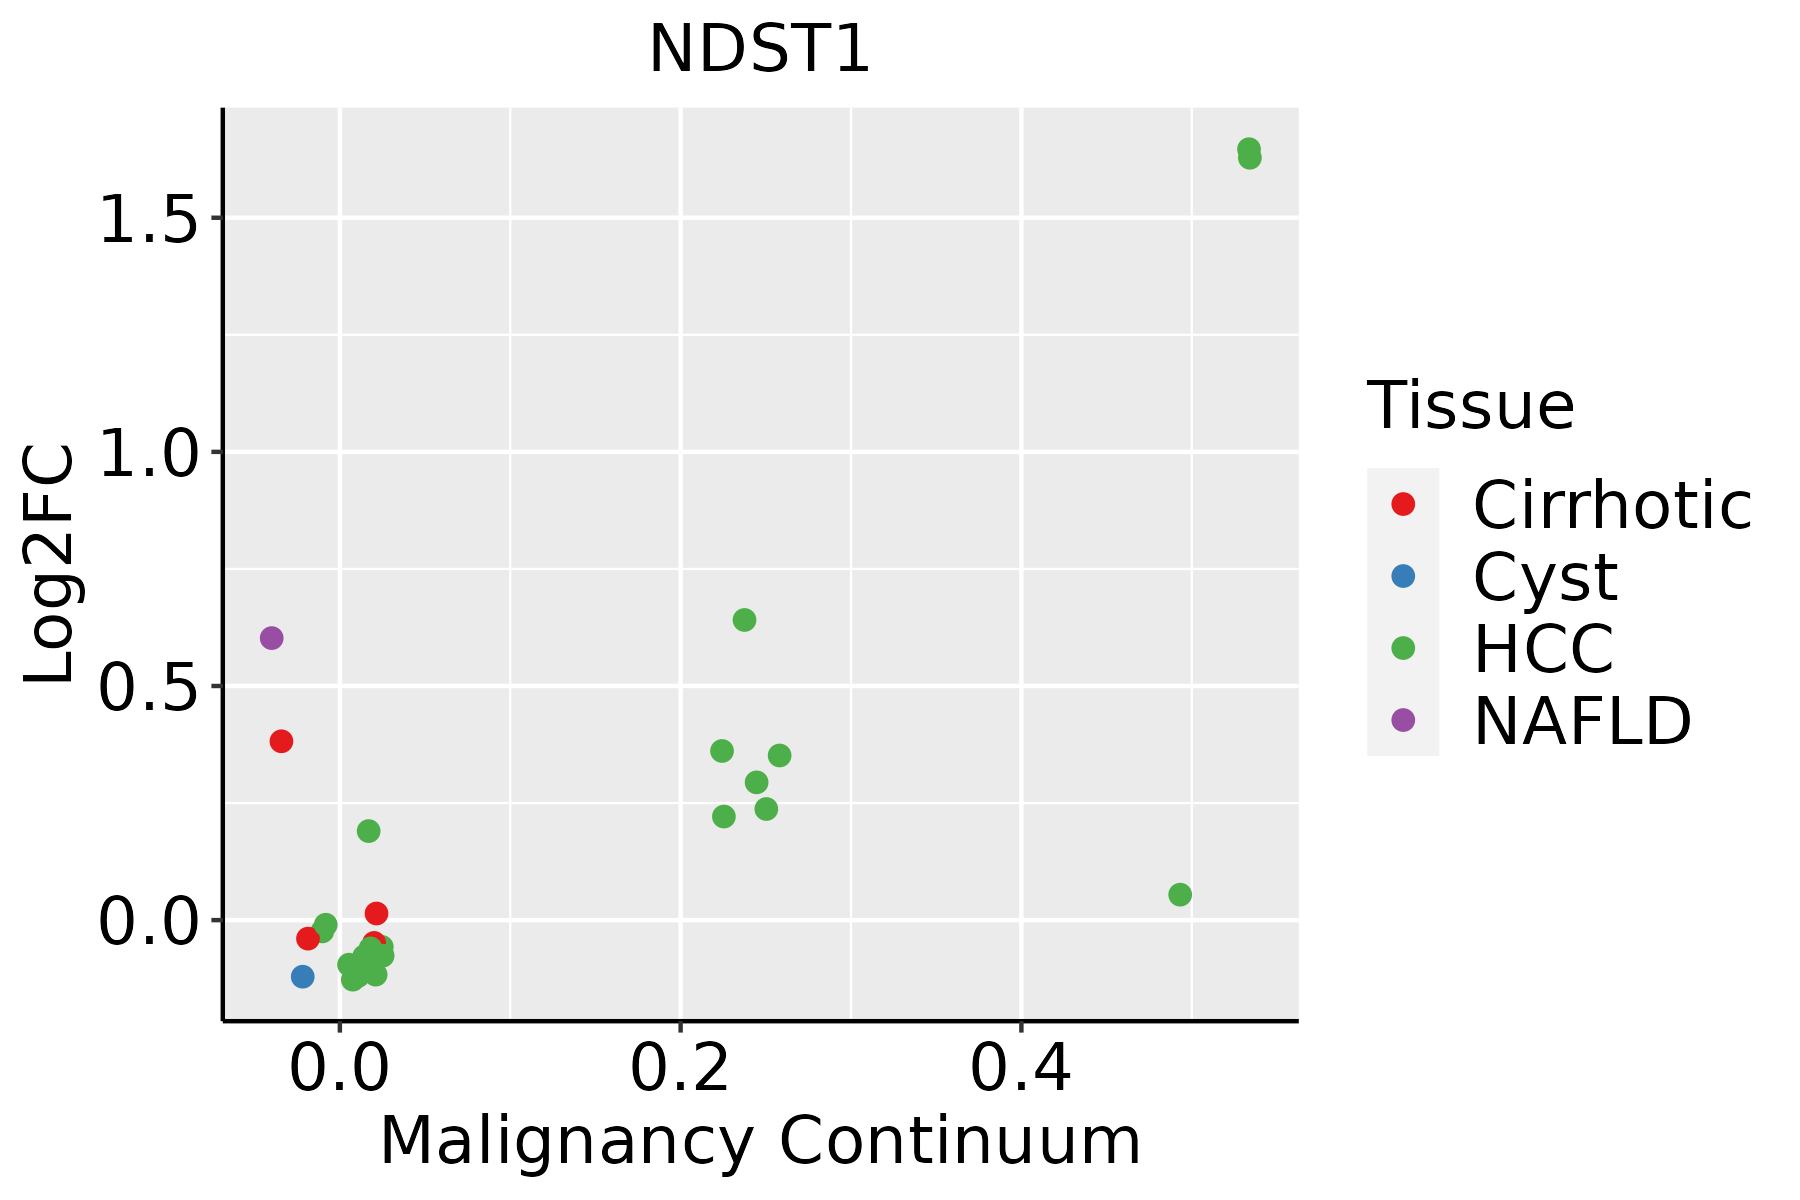
HCC: Hepatocellular carcinoma
NAFLD: Non-alcoholic fatty liver disease
Oral CavityThe image shows the transcriptomic changes along malignancy continuum.log2FC in expression of this searched gene in stem-like cells from each diseased tissue sample relative to stem-like cells in normal samples in each tissue plotted against the malignancy continuum. Samples are colored based on if they are from different disease stage.EOLP: Erosive Oral lichen planus
LP: leukoplakia
NEOLP: Non-erosive oral lichen planus
OSCC: Oral squamous cell carcinoma
ThyroidThe image shows the transcriptomic changes along malignancy continuum.log2FC in expression of this searched gene in stem-like cells from each diseased tissue sample relative to stem-like cells in normal samples in each tissue plotted against the malignancy continuum. Samples are colored based on if they are from different disease stage.
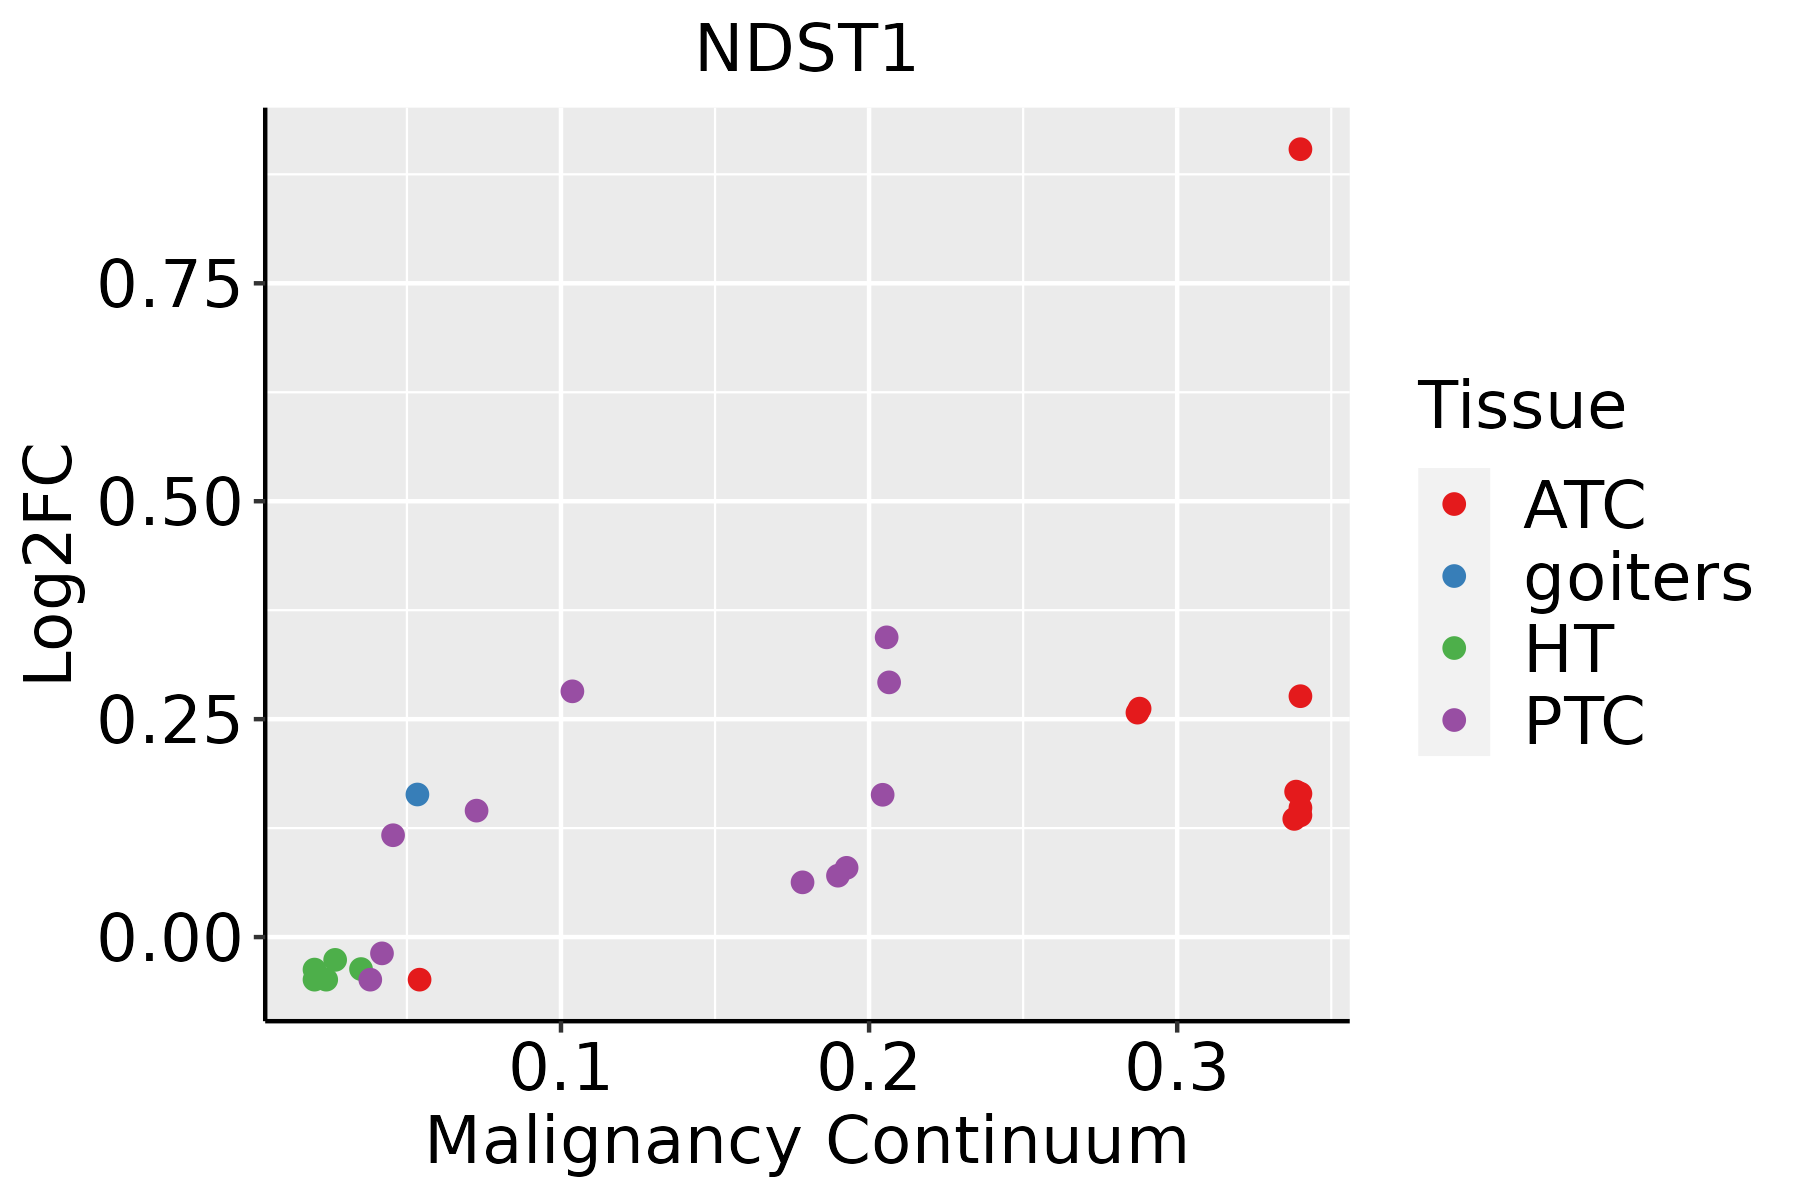
ATC: Anaplastic thyroid cancer
HT: Hashimoto's thyroiditis
PTC: Papillary thyroid cancer
∗log2FC in expression of this searched gene in stem-like cells from each diseased tissue sample relative to stem-like cells in normal samples in each tissue plotted against the malignancy continuum. Samples are colored based on if they are from different disease stage.

Top

Malignant transformation related pathway analysis

check buttonFind out the enriched GO biological processes and KEGG pathways involved in transition from healthy to precancer to cancer
check button Figure of enriched GO biological processes.
TissueDisease StageEnriched GO biological Processes
ColorectumADGO analysis - Figure of enriched GO biological processes: Top 15 enriched GO BP terms are showed in the bar plot of each disease state in each tissue. Each row represents a significant GO biological process which is colored according to the -log10(p.adjust).
ColorectumSERGO analysis - Figure of enriched GO biological processes: Top 15 enriched GO BP terms are showed in the bar plot of each disease state in each tissue. Each row represents a significant GO biological process which is colored according to the -log10(p.adjust).
ColorectumMSSGO analysis - Figure of enriched GO biological processes: Top 15 enriched GO BP terms are showed in the bar plot of each disease state in each tissue. Each row represents a significant GO biological process which is colored according to the -log10(p.adjust).
ColorectumMSI-HGO analysis - Figure of enriched GO biological processes: Top 15 enriched GO BP terms are showed in the bar plot of each disease state in each tissue. Each row represents a significant GO biological process which is colored according to the -log10(p.adjust).
ColorectumFAPGO analysis - Figure of enriched GO biological processes: Top 15 enriched GO BP terms are showed in the bar plot of each disease state in each tissue. Each row represents a significant GO biological process which is colored according to the -log10(p.adjust).
∗Top 15 enriched GO BP terms are showed in the bar plot of each disease state in each tissue. Each row represents a significant GO biological process which is colored according to the -log10(p.adjust).
Page: 1 2 3 4 5 6 7 8 9 

check button Enriched GO biological processes.
GO IDTissueDisease StageDescriptionGene RatioBg Ratiopvaluep.adjustCount
GO:00091002EsophagusESCCglycoprotein metabolic process226/8552387/187232.64e-073.94e-06226
GO:00067906EsophagusESCCsulfur compound metabolic process201/8552339/187232.64e-073.94e-06201
GO:00442725EsophagusESCCsulfur compound biosynthetic process96/8552148/187231.86e-062.16e-0596
GO:00091012EsophagusESCCglycoprotein biosynthetic process181/8552317/187232.54e-052.15e-04181
GO:00442626EsophagusESCCcellular carbohydrate metabolic process160/8552283/187231.43e-049.66e-04160
GO:003090118EsophagusESCCmidbrain development58/855290/187232.52e-041.55e-0358
GO:00160514EsophagusESCCcarbohydrate biosynthetic process117/8552202/187232.96e-041.79e-03117
GO:00485687EsophagusESCCembryonic organ development228/8552427/187237.28e-043.79e-03228
GO:00487052EsophagusESCCskeletal system morphogenesis120/8552220/187234.90e-031.89e-02120
GO:0006029EsophagusESCCproteoglycan metabolic process48/855279/187234.93e-031.89e-0248
GO:0030166EsophagusESCCproteoglycan biosynthetic process35/855256/187238.30e-032.94e-0235
GO:0006024EsophagusESCCglycosaminoglycan biosynthetic process45/855275/187238.75e-033.08e-0245
GO:0006023EsophagusESCCaminoglycan biosynthetic process47/855279/187239.29e-033.23e-0247
GO:19048881EsophagusESCCcranial skeletal system development41/855268/187231.07e-023.66e-0241
GO:0030201EsophagusESCCheparan sulfate proteoglycan metabolic process21/855231/187231.10e-023.70e-0221
GO:00346372EsophagusESCCcellular carbohydrate biosynthetic process46/855278/187231.24e-024.13e-0246
GO:00442623LiverNAFLDcellular carbohydrate metabolic process55/1882283/187231.27e-066.01e-0555
GO:0016051LiverNAFLDcarbohydrate biosynthetic process43/1882202/187231.55e-066.96e-0543
GO:00067904LiverNAFLDsulfur compound metabolic process58/1882339/187233.79e-059.38e-0458
GO:0034637LiverNAFLDcellular carbohydrate biosynthetic process20/188278/187236.46e-051.39e-0320
Page: 1 2 3 4 

check button Enriched KEGG pathways.
Pathway IDTissueDisease StageDescriptionGene RatioBg Ratiopvaluep.adjustqvalueCount
Page: 1 

Top

Cell-cell communication analysis

check buttonIdentification of potential cell-cell interactions between two cell types and their ligand-receptor pairs for different disease states
LigandReceptorLRpairPathwayTissueDisease Stage
Page: 1 

Top

Single-cell gene regulatory network inference analysis

check buttonFind out the significant the regulons (TFs) and the target genes of each regulon across cell types for different disease states
TFCell TypeTissueDisease StageTarget GeneRSSRegulon Activity
∗The dot plots of a searched regulon are shown for all cell subpopulations in each disease state of each tissue based on the regulon specific score inferred using pySCENIC and by calculating the average expression.
Page: 1 

Top

Somatic mutation of malignant transformation related genes

check buttonAnnotation of somatic variants for genes involved in malignant transformation
Hugo SymbolVariant ClassVariant ClassificationdbSNP RSHGVScHGVSpHGVSp ShortSWISSPROTBIOTYPESIFTPolyPhenTumor Sample BarcodeTissueHistologySexAgeStageTherapy TypesDrugsOutcome
NDST1SNVMissense_Mutationc.2011G>Ap.Asp671Asnp.D671NP52848protein_codingtolerated(0.13)probably_damaging(0.978)TCGA-A2-A04Y-01Breastbreast invasive carcinomaFemale<65I/IIChemotherapycytoxanSD
NDST1SNVMissense_Mutationnovelc.1531N>Tp.Gly511Trpp.G511WP52848protein_codingdeleterious(0)probably_damaging(1)TCGA-A7-A0DB-01Breastbreast invasive carcinomaFemale<65I/IIHormone TherapyarimidexSD
NDST1SNVMissense_Mutationc.2611N>Tp.Pro871Serp.P871SP52848protein_codingdeleterious(0)probably_damaging(1)TCGA-AC-A23H-01Breastbreast invasive carcinomaFemale>=65I/IIUnknownUnknownPD
NDST1SNVMissense_Mutationnovelc.1382A>Cp.Tyr461Serp.Y461SP52848protein_codingdeleterious(0)probably_damaging(0.965)TCGA-AR-A1AP-01Breastbreast invasive carcinomaFemale>=65I/IIHormone TherapyanastrozoleSD
NDST1SNVMissense_Mutationc.2016N>Gp.Phe672Leup.F672LP52848protein_codingtolerated(0.24)benign(0.108)TCGA-D8-A1JA-01Breastbreast invasive carcinomaFemale<65III/IVChemotherapyadriamycinPD
NDST1SNVMissense_Mutationrs372636224c.2624G>Tp.Arg875Leup.R875LP52848protein_codingdeleterious(0.01)possibly_damaging(0.847)TCGA-LL-A7SZ-01Breastbreast invasive carcinomaFemale<65I/IIChemotherapyadriamycinCR
NDST1insertionFrame_Shift_Insnovelc.2587_2588insAGTGCAATCGCGTGATCTTGGCTCACTGCAACCTCCGCTTTCCGGGp.Leu863GlnfsTer18p.L863Qfs*18P52848protein_codingTCGA-A7-A0CE-01Breastbreast invasive carcinomaFemale<65I/IIChemotherapyadriamycinSD
NDST1insertionNonsense_Mutationnovelc.649_650insCAAATTAGAACCTGTCATCCTTTGp.Lys217delinsThrAsnTerAsnLeuSerSerPheGlup.K217delinsTN*NLSSFEP52848protein_codingTCGA-B6-A0I5-01Breastbreast invasive carcinomaFemale<65I/IIUnknownUnknownSD
NDST1deletionFrame_Shift_Delc.205delNp.Pro69HisfsTer110p.P69Hfs*110P52848protein_codingTCGA-D8-A27V-01Breastbreast invasive carcinomaFemale<65I/IIHormone TherapytamoxiphenSD
NDST1SNVMissense_Mutationrs182500942c.1411C>Tp.Arg471Cysp.R471CP52848protein_codingdeleterious(0)probably_damaging(0.969)TCGA-2W-A8YY-01Cervixcervical & endocervical cancerFemale<65I/IIChemotherapycisplatinCR
Page: 1 2 3 4 5 6 7 8 9 10 

Top

Related drugs of malignant transformation related genes

check buttonIdentification of chemicals and drugs interact with genes involved in malignant transfromation
(DGIdb 4.0)
Entrez IDSymbolCategoryInteraction TypesDrug Claim NameDrug NamePMIDs
Page: 1