
|
|||||
|
 | |
| |
| |
| |
| |
| |
|
Gene: NDRG3 |
Gene summary for NDRG3 |
| Gene information | Species | Human | Gene symbol | NDRG3 | Gene ID | 57446 |
| Gene name | NDRG family member 3 | |
| Gene Alias | NDRG3 | |
| Cytomap | 20q11.23 | |
| Gene Type | protein-coding | GO ID | GO:0000003 | UniProtAcc | Q9UGV2 |
Top |
Malignant transformation analysis |
| Identification of the aberrant gene expression in precancerous and cancerous lesions by comparing the gene expression of stem-like cells in diseased tissues with normal stem cells |
| Entrez ID | Symbol | Replicates | Species | Organ | Tissue | Adj P-value | Log2FC | Malignancy |
| 57446 | NDRG3 | LZE4T | Human | Esophagus | ESCC | 1.44e-13 | 3.74e-01 | 0.0811 |
| 57446 | NDRG3 | LZE7T | Human | Esophagus | ESCC | 2.47e-04 | 1.73e-01 | 0.0667 |
| 57446 | NDRG3 | LZE20T | Human | Esophagus | ESCC | 8.62e-06 | 1.92e-01 | 0.0662 |
| 57446 | NDRG3 | LZE22T | Human | Esophagus | ESCC | 2.32e-02 | 2.77e-01 | 0.068 |
| 57446 | NDRG3 | LZE24T | Human | Esophagus | ESCC | 6.92e-31 | 8.89e-01 | 0.0596 |
| 57446 | NDRG3 | LZE6T | Human | Esophagus | ESCC | 1.59e-05 | 1.46e-01 | 0.0845 |
| 57446 | NDRG3 | P1T-E | Human | Esophagus | ESCC | 7.08e-06 | 2.37e-01 | 0.0875 |
| 57446 | NDRG3 | P2T-E | Human | Esophagus | ESCC | 1.27e-24 | 3.64e-01 | 0.1177 |
| 57446 | NDRG3 | P4T-E | Human | Esophagus | ESCC | 1.30e-21 | 4.33e-01 | 0.1323 |
| 57446 | NDRG3 | P5T-E | Human | Esophagus | ESCC | 1.08e-09 | 1.42e-01 | 0.1327 |
| 57446 | NDRG3 | P8T-E | Human | Esophagus | ESCC | 1.22e-17 | 2.74e-01 | 0.0889 |
| 57446 | NDRG3 | P9T-E | Human | Esophagus | ESCC | 1.37e-17 | 4.21e-01 | 0.1131 |
| 57446 | NDRG3 | P10T-E | Human | Esophagus | ESCC | 7.98e-20 | 2.98e-01 | 0.116 |
| 57446 | NDRG3 | P11T-E | Human | Esophagus | ESCC | 2.87e-12 | 5.38e-01 | 0.1426 |
| 57446 | NDRG3 | P12T-E | Human | Esophagus | ESCC | 1.44e-35 | 6.06e-01 | 0.1122 |
| 57446 | NDRG3 | P15T-E | Human | Esophagus | ESCC | 5.55e-27 | 5.58e-01 | 0.1149 |
| 57446 | NDRG3 | P16T-E | Human | Esophagus | ESCC | 9.09e-29 | 6.24e-01 | 0.1153 |
| 57446 | NDRG3 | P17T-E | Human | Esophagus | ESCC | 8.60e-08 | 3.29e-01 | 0.1278 |
| 57446 | NDRG3 | P19T-E | Human | Esophagus | ESCC | 7.16e-13 | 7.32e-01 | 0.1662 |
| 57446 | NDRG3 | P20T-E | Human | Esophagus | ESCC | 3.45e-30 | 6.17e-01 | 0.1124 |
| Page: 1 2 3 4 5 |
| Tissue | Expression Dynamics | Abbreviation |
| Esophagus | 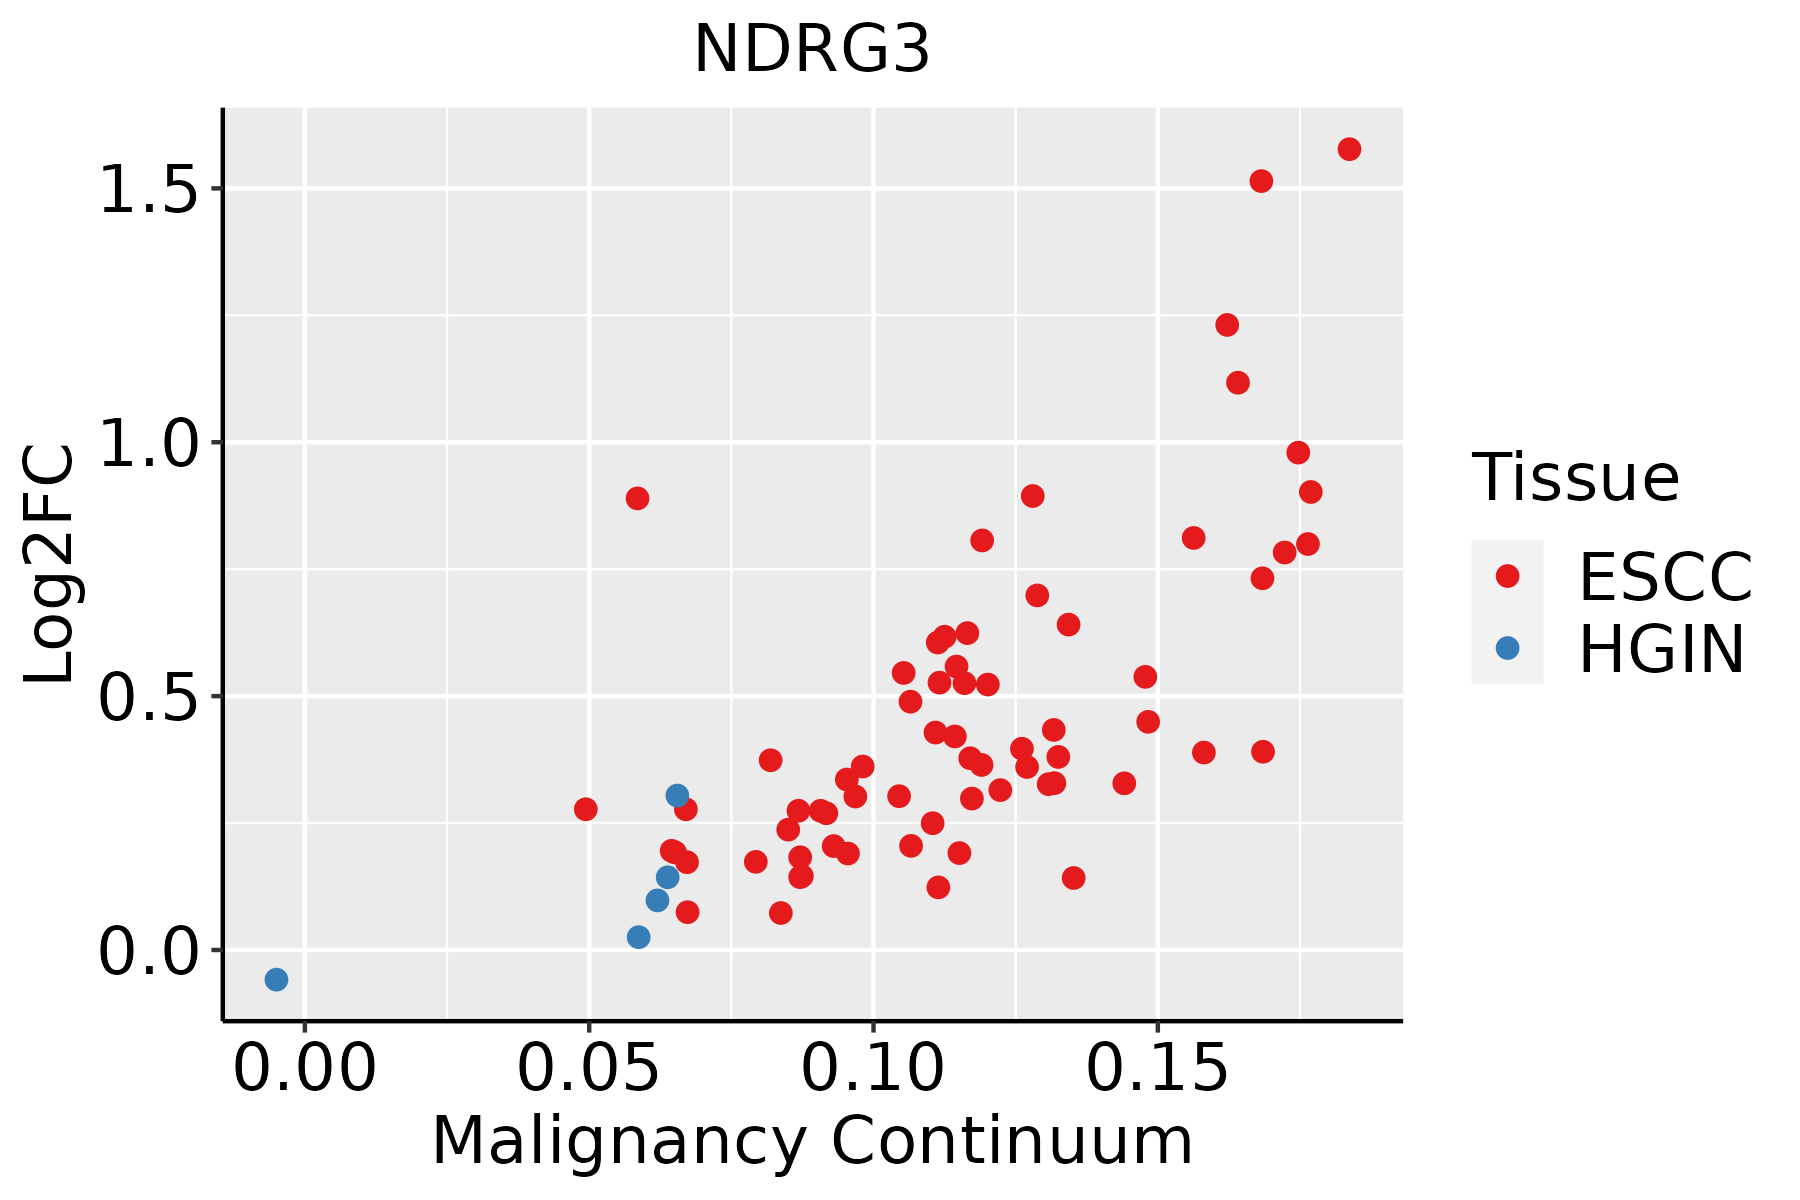 | ESCC: Esophageal squamous cell carcinoma |
| HGIN: High-grade intraepithelial neoplasias | ||
| LGIN: Low-grade intraepithelial neoplasias | ||
| Liver | 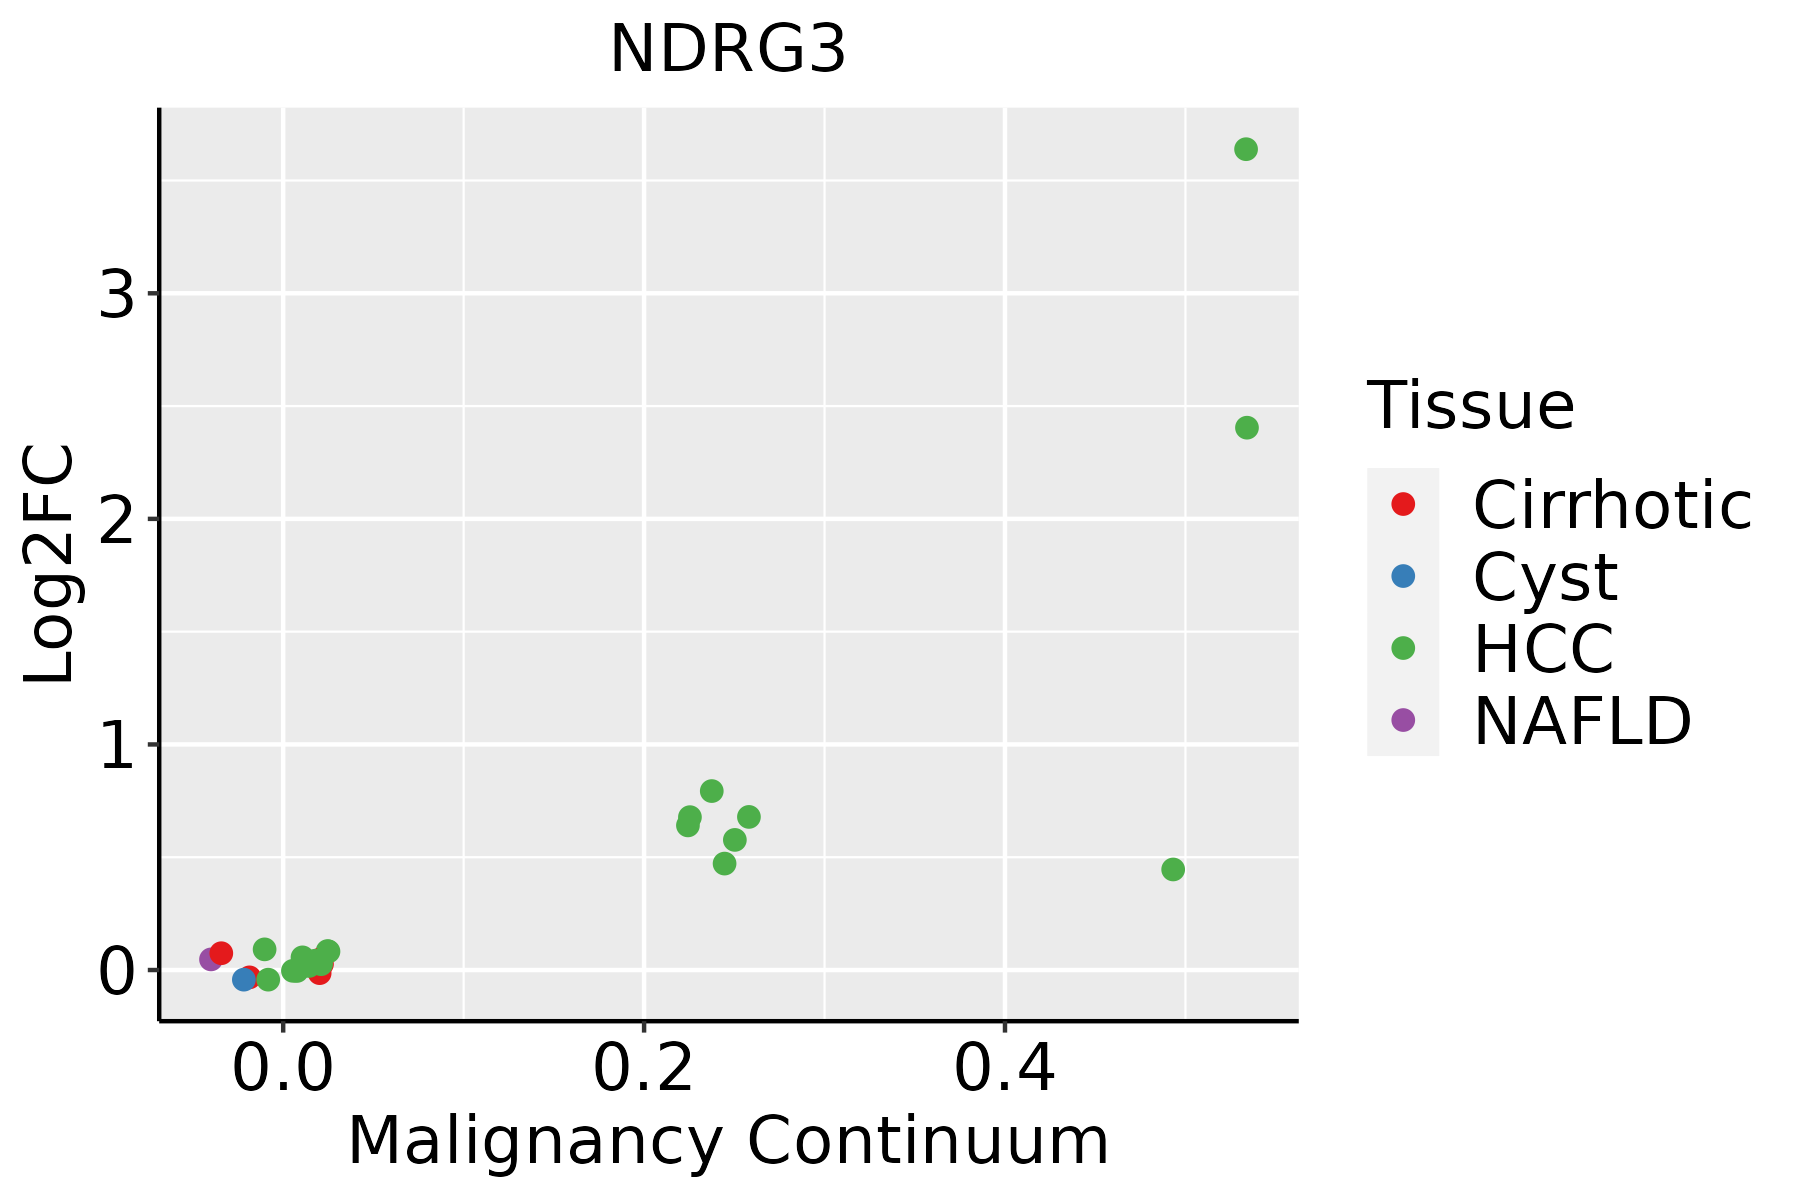 | HCC: Hepatocellular carcinoma |
| NAFLD: Non-alcoholic fatty liver disease | ||
| Oral Cavity |  | EOLP: Erosive Oral lichen planus |
| LP: leukoplakia | ||
| NEOLP: Non-erosive oral lichen planus | ||
| OSCC: Oral squamous cell carcinoma | ||
| Skin | 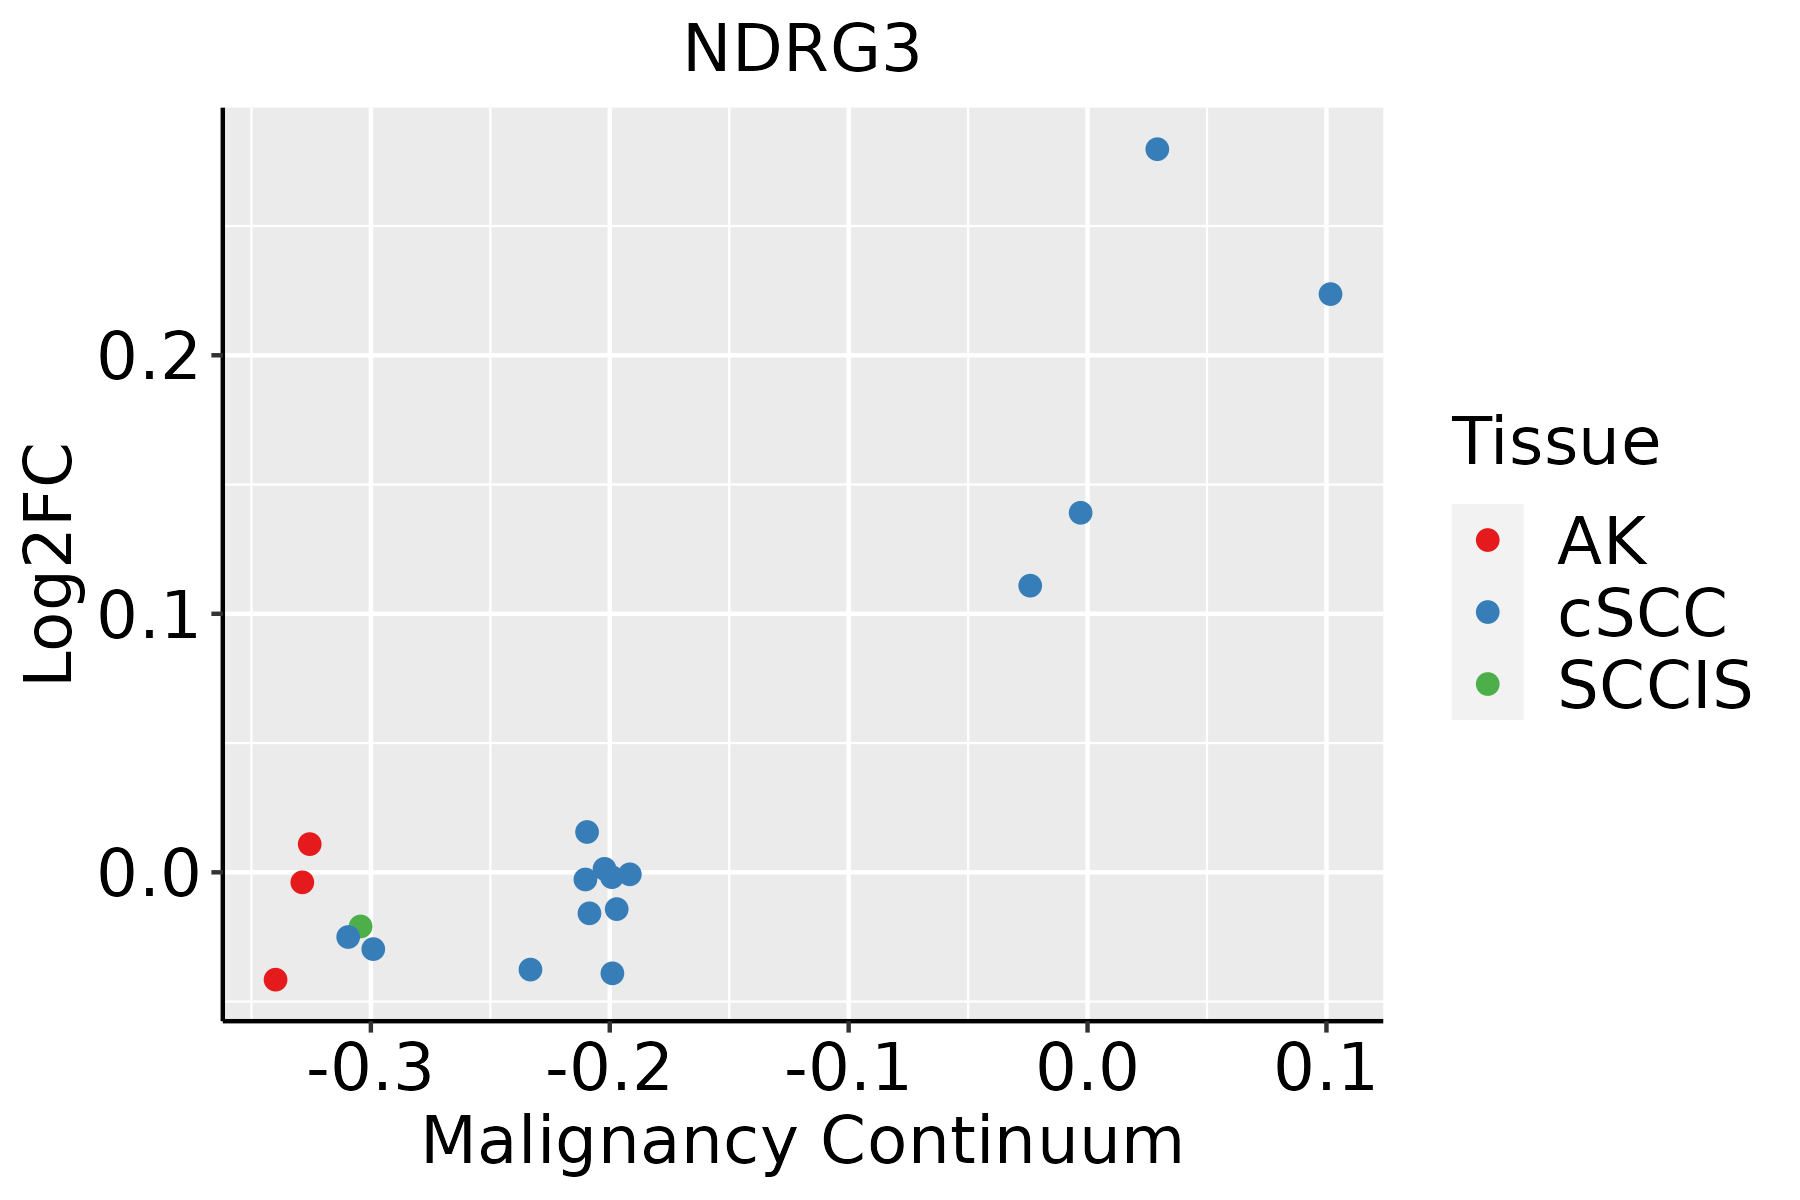 | AK: Actinic keratosis |
| cSCC: Cutaneous squamous cell carcinoma | ||
| SCCIS:squamous cell carcinoma in situ |
| ∗log2FC in expression of this searched gene in stem-like cells from each diseased tissue sample relative to stem-like cells in normal samples in each tissue plotted against the malignancy continuum. Samples are colored based on if they are from different disease stage. |
Top |
Malignant transformation related pathway analysis |
| Find out the enriched GO biological processes and KEGG pathways involved in transition from healthy to precancer to cancer |
| Tissue | Disease Stage | Enriched GO biological Processes |
| Colorectum | AD |  |
| Colorectum | SER |  |
| Colorectum | MSS |  |
| Colorectum | MSI-H |  |
| Colorectum | FAP |  |
| ∗Top 15 enriched GO BP terms are showed in the bar plot of each disease state in each tissue. Each row represents a significant GO biological process which is colored according to the -log10(p.adjust). |
| Page: 1 2 3 4 5 6 7 8 9 |
| GO ID | Tissue | Disease Stage | Description | Gene Ratio | Bg Ratio | pvalue | p.adjust | Count |
| GO:0016049110 | Esophagus | ESCC | cell growth | 289/8552 | 482/18723 | 1.29e-10 | 3.77e-09 | 289 |
| GO:000155819 | Esophagus | ESCC | regulation of cell growth | 248/8552 | 414/18723 | 2.97e-09 | 6.45e-08 | 248 |
| GO:00459267 | Esophagus | ESCC | negative regulation of growth | 148/8552 | 249/18723 | 7.88e-06 | 7.73e-05 | 148 |
| GO:00303085 | Esophagus | ESCC | negative regulation of cell growth | 108/8552 | 188/18723 | 7.46e-04 | 3.87e-03 | 108 |
| GO:001604921 | Liver | HCC | cell growth | 269/7958 | 482/18723 | 1.84e-09 | 5.35e-08 | 269 |
| GO:000155821 | Liver | HCC | regulation of cell growth | 228/7958 | 414/18723 | 1.34e-07 | 2.55e-06 | 228 |
| GO:00459263 | Liver | HCC | negative regulation of growth | 129/7958 | 249/18723 | 1.81e-03 | 9.37e-03 | 129 |
| GO:0030308 | Liver | HCC | negative regulation of cell growth | 98/7958 | 188/18723 | 4.74e-03 | 2.02e-02 | 98 |
| GO:001604917 | Oral cavity | OSCC | cell growth | 268/7305 | 482/18723 | 6.55e-14 | 3.51e-12 | 268 |
| GO:000155816 | Oral cavity | OSCC | regulation of cell growth | 228/7305 | 414/18723 | 1.74e-11 | 6.09e-10 | 228 |
| GO:00459266 | Oral cavity | OSCC | negative regulation of growth | 135/7305 | 249/18723 | 7.29e-07 | 1.03e-05 | 135 |
| GO:00303084 | Oral cavity | OSCC | negative regulation of cell growth | 101/7305 | 188/18723 | 2.85e-05 | 2.63e-04 | 101 |
| GO:001604918 | Oral cavity | LP | cell growth | 155/4623 | 482/18723 | 1.08e-04 | 1.31e-03 | 155 |
| GO:000155817 | Oral cavity | LP | regulation of cell growth | 134/4623 | 414/18723 | 2.25e-04 | 2.41e-03 | 134 |
| GO:001604925 | Skin | cSCC | cell growth | 173/4864 | 482/18723 | 7.21e-07 | 1.34e-05 | 173 |
| GO:000155824 | Skin | cSCC | regulation of cell growth | 140/4864 | 414/18723 | 2.07e-04 | 1.72e-03 | 140 |
| Page: 1 |
| Pathway ID | Tissue | Disease Stage | Description | Gene Ratio | Bg Ratio | pvalue | p.adjust | qvalue | Count |
| Page: 1 |
Top |
Cell-cell communication analysis |
| Identification of potential cell-cell interactions between two cell types and their ligand-receptor pairs for different disease states |
| Ligand | Receptor | LRpair | Pathway | Tissue | Disease Stage |
| Page: 1 |
Top |
Single-cell gene regulatory network inference analysis |
| Find out the significant the regulons (TFs) and the target genes of each regulon across cell types for different disease states |
| TF | Cell Type | Tissue | Disease Stage | Target Gene | RSS | Regulon Activity |
| ∗The dot plots of a searched regulon are shown for all cell subpopulations in each disease state of each tissue based on the regulon specific score inferred using pySCENIC and by calculating the average expression. |
| Page: 1 |
Top |
Somatic mutation of malignant transformation related genes |
| Annotation of somatic variants for genes involved in malignant transformation |
| Hugo Symbol | Variant Class | Variant Classification | dbSNP RS | HGVSc | HGVSp | HGVSp Short | SWISSPROT | BIOTYPE | SIFT | PolyPhen | Tumor Sample Barcode | Tissue | Histology | Sex | Age | Stage | Therapy Types | Drugs | Outcome |
| NDRG3 | SNV | Missense_Mutation | c.413G>C | p.Gly138Ala | p.G138A | Q9UGV2 | protein_coding | deleterious(0) | probably_damaging(0.95) | TCGA-AC-A23H-01 | Breast | breast invasive carcinoma | Female | >=65 | I/II | Unknown | Unknown | PD | |
| NDRG3 | SNV | Missense_Mutation | novel | c.240N>A | p.Met80Ile | p.M80I | Q9UGV2 | protein_coding | deleterious(0) | possibly_damaging(0.723) | TCGA-AC-A3QQ-01 | Breast | breast invasive carcinoma | Female | <65 | I/II | Unknown | Unknown | SD |
| NDRG3 | SNV | Missense_Mutation | rs372522320 | c.910G>A | p.Glu304Lys | p.E304K | Q9UGV2 | protein_coding | deleterious(0) | probably_damaging(0.997) | TCGA-C8-A1HM-01 | Breast | breast invasive carcinoma | Female | >=65 | I/II | Chemotherapy | doxorubicin | CR |
| NDRG3 | SNV | Missense_Mutation | rs199920093 | c.1009N>A | p.Gly337Ser | p.G337S | Q9UGV2 | protein_coding | tolerated(1) | benign(0.019) | TCGA-LL-A7SZ-01 | Breast | breast invasive carcinoma | Female | <65 | I/II | Chemotherapy | adriamycin | CR |
| NDRG3 | insertion | In_Frame_Ins | novel | c.114_115insTGG | p.Thr38_His39insTrp | p.T38_H39insW | Q9UGV2 | protein_coding | TCGA-A2-A0EQ-01 | Breast | breast invasive carcinoma | Female | <65 | I/II | Chemotherapy | adriamycin | SD | ||
| NDRG3 | insertion | Nonsense_Mutation | novel | c.112_113insGTTGAGTGTTAAAGCTTTTGTAGCTGC | p.Thr38delinsSerTerValLeuLysLeuLeuTerLeuPro | p.T38delinsS*VLKLL*LP | Q9UGV2 | protein_coding | TCGA-A2-A0EQ-01 | Breast | breast invasive carcinoma | Female | <65 | I/II | Chemotherapy | adriamycin | SD | ||
| NDRG3 | insertion | Nonsense_Mutation | novel | c.241_242insGGTAATAAAATCA | p.Gln81ArgfsTer2 | p.Q81Rfs*2 | Q9UGV2 | protein_coding | TCGA-AC-A3QQ-01 | Breast | breast invasive carcinoma | Female | <65 | I/II | Unknown | Unknown | SD | ||
| NDRG3 | insertion | In_Frame_Ins | novel | c.632_633insTAA | p.Met211delinsIleLys | p.M211delinsIK | Q9UGV2 | protein_coding | TCGA-AN-A0FV-01 | Breast | breast invasive carcinoma | Female | <65 | I/II | Unknown | Unknown | SD | ||
| NDRG3 | insertion | Frame_Shift_Ins | novel | c.630_631insCTGAGACTGTGTCTCAAAAAAATAC | p.Met211LeufsTer44 | p.M211Lfs*44 | Q9UGV2 | protein_coding | TCGA-AN-A0FV-01 | Breast | breast invasive carcinoma | Female | <65 | I/II | Unknown | Unknown | SD | ||
| NDRG3 | SNV | Missense_Mutation | novel | c.592N>A | p.Glu198Lys | p.E198K | Q9UGV2 | protein_coding | deleterious(0) | probably_damaging(0.999) | TCGA-MA-AA41-01 | Cervix | cervical & endocervical cancer | Female | <65 | I/II | Unknown | Unknown | SD |
| Page: 1 2 3 4 |
Top |
Related drugs of malignant transformation related genes |
| Identification of chemicals and drugs interact with genes involved in malignant transfromation |
| (DGIdb 4.0) |
| Entrez ID | Symbol | Category | Interaction Types | Drug Claim Name | Drug Name | PMIDs |
| Page: 1 |

Copyright 2023-Present -The University of Texas Health Science Center at Houston |