
|
|||||
|
 | |
| |
| |
| |
| |
| |
|
Gene: NDRG2 |
Gene summary for NDRG2 |
| Gene information | Species | Human | Gene symbol | NDRG2 | Gene ID | 57447 |
| Gene name | NDRG family member 2 | |
| Gene Alias | SYLD | |
| Cytomap | 14q11.2 | |
| Gene Type | protein-coding | GO ID | GO:0000165 | UniProtAcc | Q9UN36 |
Top |
Malignant transformation analysis |
| Identification of the aberrant gene expression in precancerous and cancerous lesions by comparing the gene expression of stem-like cells in diseased tissues with normal stem cells |
| Entrez ID | Symbol | Replicates | Species | Organ | Tissue | Adj P-value | Log2FC | Malignancy |
| 57447 | NDRG2 | GSM4909281 | Human | Breast | IDC | 6.78e-03 | -5.82e-02 | 0.21 |
| 57447 | NDRG2 | GSM4909285 | Human | Breast | IDC | 2.15e-11 | 6.19e-03 | 0.21 |
| 57447 | NDRG2 | GSM4909286 | Human | Breast | IDC | 9.30e-11 | 1.88e-01 | 0.1081 |
| 57447 | NDRG2 | GSM4909287 | Human | Breast | IDC | 5.26e-07 | -4.83e-01 | 0.2057 |
| 57447 | NDRG2 | GSM4909290 | Human | Breast | IDC | 4.01e-23 | -7.95e-01 | 0.2096 |
| 57447 | NDRG2 | GSM4909291 | Human | Breast | IDC | 2.11e-19 | -8.05e-01 | 0.1753 |
| 57447 | NDRG2 | GSM4909292 | Human | Breast | IDC | 2.43e-05 | -8.50e-01 | 0.1236 |
| 57447 | NDRG2 | GSM4909293 | Human | Breast | IDC | 9.69e-14 | -6.57e-01 | 0.1581 |
| 57447 | NDRG2 | GSM4909294 | Human | Breast | IDC | 1.39e-24 | -6.76e-01 | 0.2022 |
| 57447 | NDRG2 | GSM4909296 | Human | Breast | IDC | 4.37e-24 | -7.69e-01 | 0.1524 |
| 57447 | NDRG2 | GSM4909297 | Human | Breast | IDC | 3.11e-27 | -6.91e-01 | 0.1517 |
| 57447 | NDRG2 | GSM4909298 | Human | Breast | IDC | 4.06e-09 | -4.11e-01 | 0.1551 |
| 57447 | NDRG2 | GSM4909301 | Human | Breast | IDC | 6.74e-34 | -7.80e-01 | 0.1577 |
| 57447 | NDRG2 | GSM4909302 | Human | Breast | IDC | 2.60e-25 | -7.38e-01 | 0.1545 |
| 57447 | NDRG2 | GSM4909304 | Human | Breast | IDC | 6.69e-21 | -7.16e-01 | 0.1636 |
| 57447 | NDRG2 | GSM4909306 | Human | Breast | IDC | 2.65e-10 | -4.57e-01 | 0.1564 |
| 57447 | NDRG2 | GSM4909307 | Human | Breast | IDC | 5.08e-11 | -4.64e-01 | 0.1569 |
| 57447 | NDRG2 | GSM4909308 | Human | Breast | IDC | 5.91e-25 | -7.71e-01 | 0.158 |
| 57447 | NDRG2 | GSM4909311 | Human | Breast | IDC | 3.51e-25 | -5.05e-01 | 0.1534 |
| 57447 | NDRG2 | GSM4909312 | Human | Breast | IDC | 1.16e-22 | -6.85e-01 | 0.1552 |
| Page: 1 2 3 4 5 6 7 |
| Tissue | Expression Dynamics | Abbreviation |
| Breast | 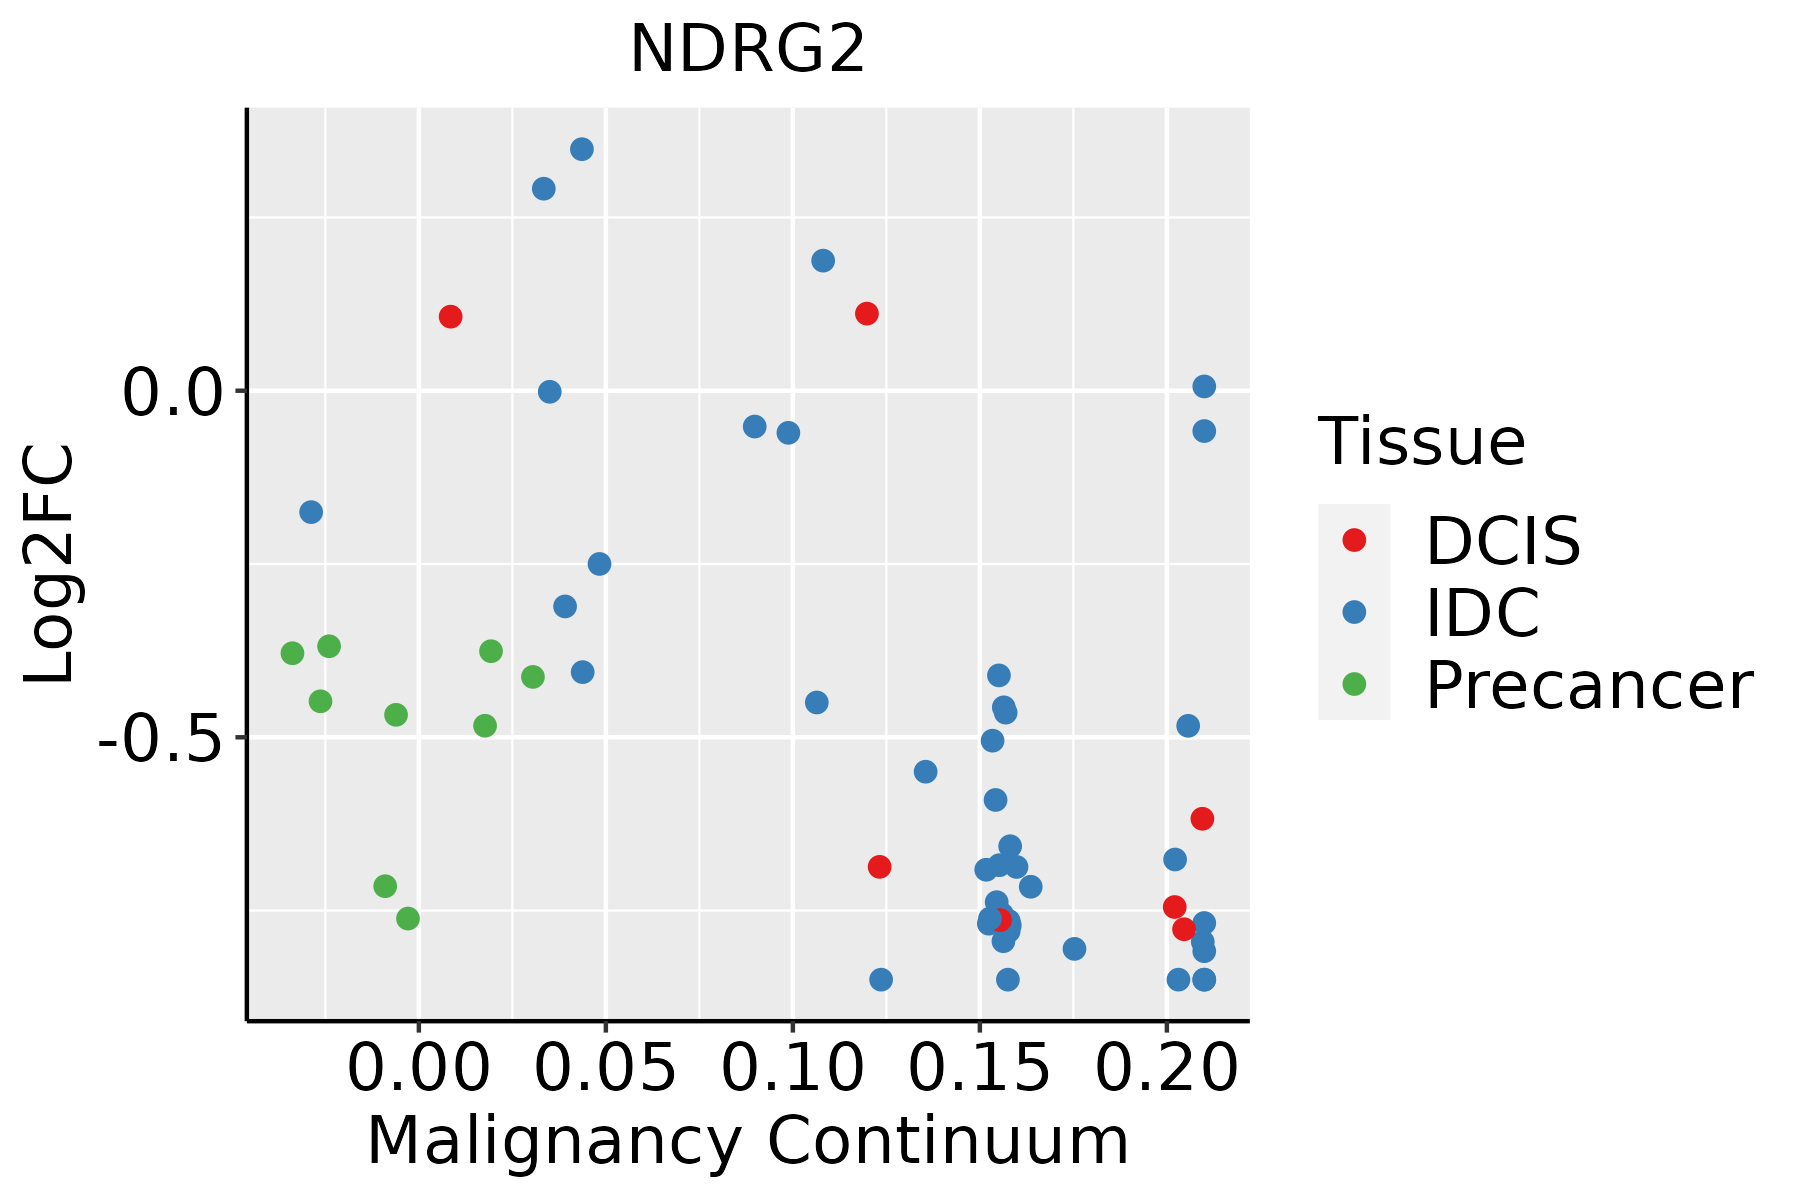 | IDC: Invasive ductal carcinoma |
| DCIS: Ductal carcinoma in situ | ||
| Precancer(BRCA1-mut): Precancerous lesion from BRCA1 mutation carriers | ||
| Colorectum (GSE201348) |  | FAP: Familial adenomatous polyposis |
| CRC: Colorectal cancer | ||
| Colorectum (HTA11) |  | AD: Adenomas |
| SER: Sessile serrated lesions | ||
| MSI-H: Microsatellite-high colorectal cancer | ||
| MSS: Microsatellite stable colorectal cancer | ||
| Esophagus |  | ESCC: Esophageal squamous cell carcinoma |
| HGIN: High-grade intraepithelial neoplasias | ||
| LGIN: Low-grade intraepithelial neoplasias | ||
| Liver | 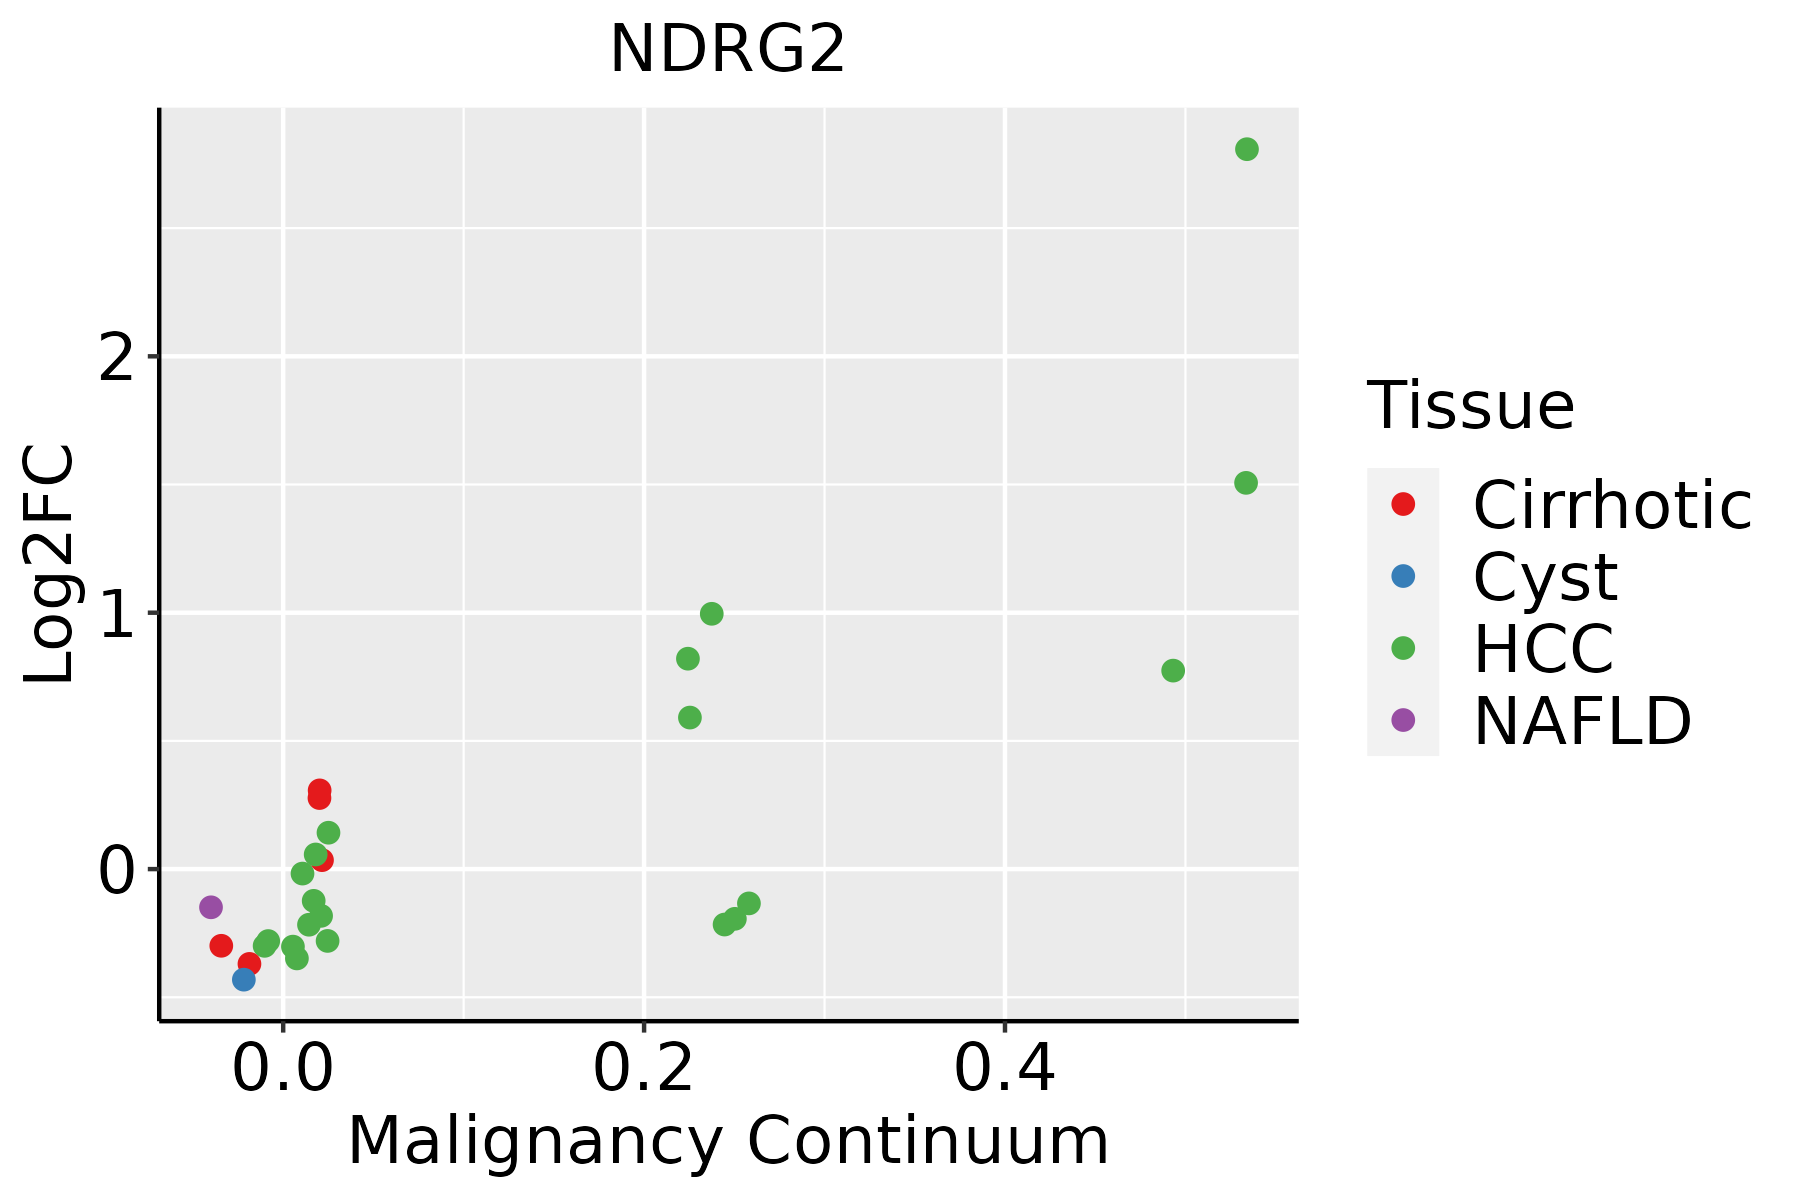 | HCC: Hepatocellular carcinoma |
| NAFLD: Non-alcoholic fatty liver disease | ||
| Oral Cavity | 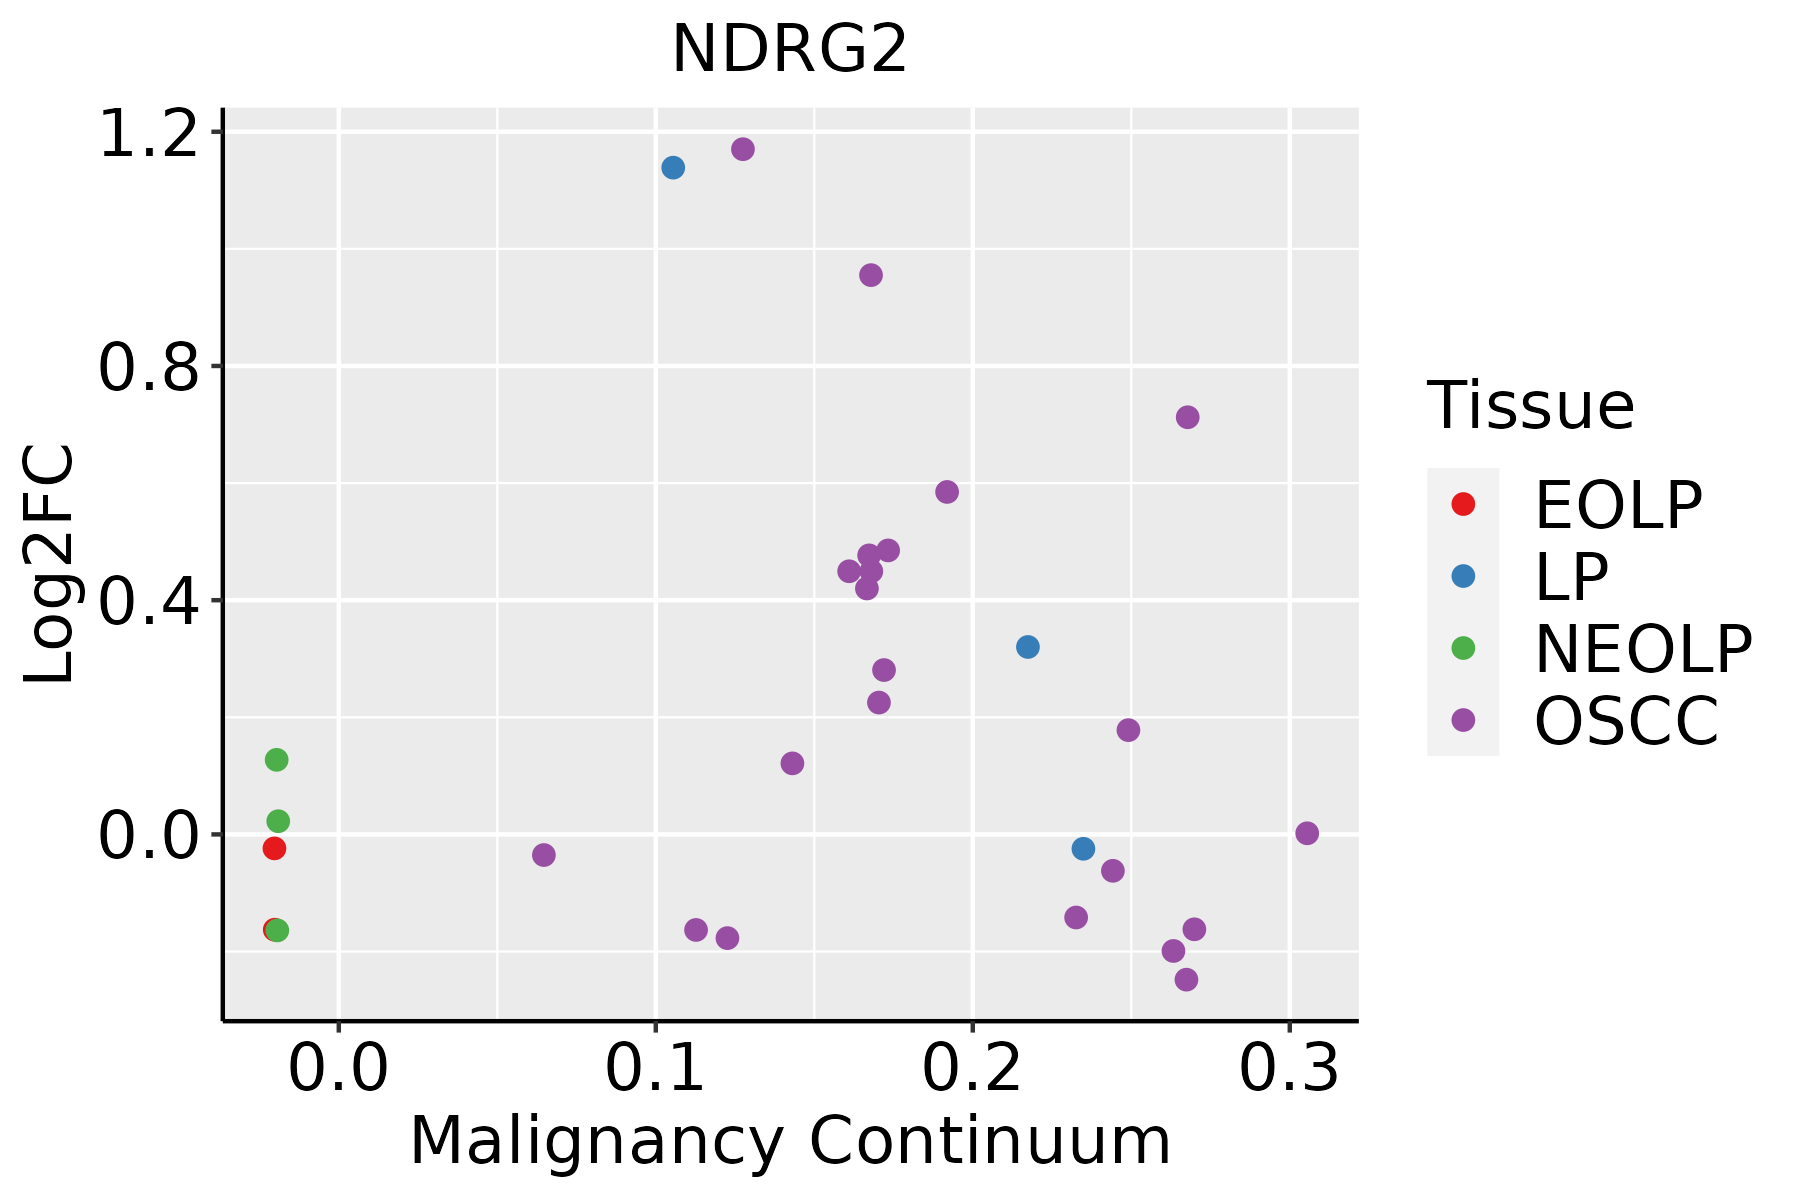 | EOLP: Erosive Oral lichen planus |
| LP: leukoplakia | ||
| NEOLP: Non-erosive oral lichen planus | ||
| OSCC: Oral squamous cell carcinoma |
| ∗log2FC in expression of this searched gene in stem-like cells from each diseased tissue sample relative to stem-like cells in normal samples in each tissue plotted against the malignancy continuum. Samples are colored based on if they are from different disease stage. |
Top |
Malignant transformation related pathway analysis |
| Find out the enriched GO biological processes and KEGG pathways involved in transition from healthy to precancer to cancer |
| Tissue | Disease Stage | Enriched GO biological Processes |
| Colorectum | AD |  |
| Colorectum | SER |  |
| Colorectum | MSS |  |
| Colorectum | MSI-H |  |
| Colorectum | FAP |  |
| ∗Top 15 enriched GO BP terms are showed in the bar plot of each disease state in each tissue. Each row represents a significant GO biological process which is colored according to the -log10(p.adjust). |
| Page: 1 2 3 4 5 6 7 8 9 |
| GO ID | Tissue | Disease Stage | Description | Gene Ratio | Bg Ratio | pvalue | p.adjust | Count |
| GO:00217629 | Breast | Precancer | substantia nigra development | 15/1080 | 44/18723 | 1.12e-08 | 7.98e-07 | 15 |
| GO:00309018 | Breast | Precancer | midbrain development | 20/1080 | 90/18723 | 1.50e-07 | 7.93e-06 | 20 |
| GO:00488578 | Breast | Precancer | neural nucleus development | 16/1080 | 64/18723 | 4.76e-07 | 2.11e-05 | 16 |
| GO:002176214 | Breast | IDC | substantia nigra development | 18/1434 | 44/18723 | 1.11e-09 | 1.07e-07 | 18 |
| GO:004885713 | Breast | IDC | neural nucleus development | 21/1434 | 64/18723 | 5.35e-09 | 4.28e-07 | 21 |
| GO:003090112 | Breast | IDC | midbrain development | 24/1434 | 90/18723 | 4.35e-08 | 2.87e-06 | 24 |
| GO:00703713 | Breast | IDC | ERK1 and ERK2 cascade | 43/1434 | 330/18723 | 4.28e-04 | 5.84e-03 | 43 |
| GO:00486592 | Breast | IDC | smooth muscle cell proliferation | 26/1434 | 184/18723 | 1.77e-03 | 1.72e-02 | 26 |
| GO:00703733 | Breast | IDC | negative regulation of ERK1 and ERK2 cascade | 14/1434 | 78/18723 | 2.21e-03 | 2.06e-02 | 14 |
| GO:00486602 | Breast | IDC | regulation of smooth muscle cell proliferation | 25/1434 | 180/18723 | 2.71e-03 | 2.41e-02 | 25 |
| GO:00703722 | Breast | IDC | regulation of ERK1 and ERK2 cascade | 37/1434 | 309/18723 | 4.53e-03 | 3.49e-02 | 37 |
| GO:002176223 | Breast | DCIS | substantia nigra development | 17/1390 | 44/18723 | 5.72e-09 | 4.76e-07 | 17 |
| GO:004885723 | Breast | DCIS | neural nucleus development | 20/1390 | 64/18723 | 1.87e-08 | 1.29e-06 | 20 |
| GO:003090122 | Breast | DCIS | midbrain development | 23/1390 | 90/18723 | 1.10e-07 | 5.93e-06 | 23 |
| GO:007037111 | Breast | DCIS | ERK1 and ERK2 cascade | 41/1390 | 330/18723 | 8.11e-04 | 9.32e-03 | 41 |
| GO:007037311 | Breast | DCIS | negative regulation of ERK1 and ERK2 cascade | 14/1390 | 78/18723 | 1.65e-03 | 1.64e-02 | 14 |
| GO:004865911 | Breast | DCIS | smooth muscle cell proliferation | 25/1390 | 184/18723 | 2.42e-03 | 2.18e-02 | 25 |
| GO:004866011 | Breast | DCIS | regulation of smooth muscle cell proliferation | 24/1390 | 180/18723 | 3.74e-03 | 3.01e-02 | 24 |
| GO:0016055 | Colorectum | AD | Wnt signaling pathway | 130/3918 | 444/18723 | 1.60e-05 | 3.37e-04 | 130 |
| GO:0198738 | Colorectum | AD | cell-cell signaling by wnt | 130/3918 | 446/18723 | 2.02e-05 | 4.10e-04 | 130 |
| Page: 1 2 3 4 |
| Pathway ID | Tissue | Disease Stage | Description | Gene Ratio | Bg Ratio | pvalue | p.adjust | qvalue | Count |
| Page: 1 |
Top |
Cell-cell communication analysis |
| Identification of potential cell-cell interactions between two cell types and their ligand-receptor pairs for different disease states |
| Ligand | Receptor | LRpair | Pathway | Tissue | Disease Stage |
| Page: 1 |
Top |
Single-cell gene regulatory network inference analysis |
| Find out the significant the regulons (TFs) and the target genes of each regulon across cell types for different disease states |
| TF | Cell Type | Tissue | Disease Stage | Target Gene | RSS | Regulon Activity |
| ∗The dot plots of a searched regulon are shown for all cell subpopulations in each disease state of each tissue based on the regulon specific score inferred using pySCENIC and by calculating the average expression. |
| Page: 1 |
Top |
Somatic mutation of malignant transformation related genes |
| Annotation of somatic variants for genes involved in malignant transformation |
| Hugo Symbol | Variant Class | Variant Classification | dbSNP RS | HGVSc | HGVSp | HGVSp Short | SWISSPROT | BIOTYPE | SIFT | PolyPhen | Tumor Sample Barcode | Tissue | Histology | Sex | Age | Stage | Therapy Types | Drugs | Outcome |
| NDRG2 | SNV | Missense_Mutation | novel | c.970N>T | p.Arg324Cys | p.R324C | Q9UN36 | protein_coding | deleterious(0) | probably_damaging(0.997) | TCGA-BH-A0HF-01 | Breast | breast invasive carcinoma | Female | >=65 | I/II | Hormone Therapy | arimidex | SD |
| NDRG2 | SNV | Missense_Mutation | novel | c.34N>A | p.Glu12Lys | p.E12K | Q9UN36 | protein_coding | tolerated(0.89) | benign(0.352) | TCGA-BH-A0HU-01 | Breast | breast invasive carcinoma | Female | <65 | I/II | Chemotherapy | docetaxel | SD |
| NDRG2 | SNV | Missense_Mutation | c.895C>G | p.Gln299Glu | p.Q299E | Q9UN36 | protein_coding | deleterious(0.02) | benign(0.27) | TCGA-C8-A12T-01 | Breast | breast invasive carcinoma | Female | <65 | I/II | Unknown | Unknown | SD | |
| NDRG2 | SNV | Missense_Mutation | c.528G>T | p.Lys176Asn | p.K176N | Q9UN36 | protein_coding | deleterious(0.01) | probably_damaging(0.917) | TCGA-AA-3710-01 | Colorectum | colon adenocarcinoma | Female | >=65 | I/II | Unknown | Unknown | SD | |
| NDRG2 | SNV | Missense_Mutation | rs750572401 | c.95G>A | p.Arg32Gln | p.R32Q | Q9UN36 | protein_coding | tolerated(0.57) | benign(0.001) | TCGA-EI-6917-01 | Colorectum | rectum adenocarcinoma | Male | <65 | III/IV | Chemotherapy | 5fluorouracil+oxaciplatina+l-folinian | SD |
| NDRG2 | SNV | Missense_Mutation | c.279N>T | p.Gln93His | p.Q93H | Q9UN36 | protein_coding | deleterious(0.04) | benign(0.443) | TCGA-F5-6814-01 | Colorectum | rectum adenocarcinoma | Male | <65 | I/II | Unknown | Unknown | SD | |
| NDRG2 | insertion | Nonsense_Mutation | novel | c.57_58insTTAGAATAAGATCAGT | p.Thr20LeufsTer3 | p.T20Lfs*3 | Q9UN36 | protein_coding | TCGA-AM-5820-01 | Colorectum | colon adenocarcinoma | Female | <65 | I/II | Unknown | Unknown | SD | ||
| NDRG2 | SNV | Missense_Mutation | novel | c.805G>T | p.Asp269Tyr | p.D269Y | Q9UN36 | protein_coding | deleterious(0) | probably_damaging(0.989) | TCGA-A5-A0G2-01 | Endometrium | uterine corpus endometrioid carcinoma | Female | <65 | III/IV | Unknown | Unknown | SD |
| NDRG2 | SNV | Missense_Mutation | novel | c.1076C>A | p.Ser359Tyr | p.S359Y | Q9UN36 | protein_coding | deleterious(0.03) | benign(0.181) | TCGA-A5-A2K5-01 | Endometrium | uterine corpus endometrioid carcinoma | Female | >=65 | I/II | Unknown | Unknown | SD |
| NDRG2 | SNV | Missense_Mutation | rs572120906 | c.1034N>A | p.Arg345His | p.R345H | Q9UN36 | protein_coding | deleterious(0.01) | probably_damaging(0.997) | TCGA-AP-A1DV-01 | Endometrium | uterine corpus endometrioid carcinoma | Female | <65 | I/II | Unknown | Unknown | SD |
| Page: 1 2 3 |
Top |
Related drugs of malignant transformation related genes |
| Identification of chemicals and drugs interact with genes involved in malignant transfromation |
| (DGIdb 4.0) |
| Entrez ID | Symbol | Category | Interaction Types | Drug Claim Name | Drug Name | PMIDs |
| Page: 1 |

Copyright 2023-Present -The University of Texas Health Science Center at Houston |