
|
|||||
|
 | |
| |
| |
| |
| |
| |
|
Gene: NDN |
Gene summary for NDN |
| Gene information | Species | Human | Gene symbol | NDN | Gene ID | 4692 |
| Gene name | necdin, MAGE family member | |
| Gene Alias | HsT16328 | |
| Cytomap | 15q11.2 | |
| Gene Type | protein-coding | GO ID | GO:0000122 | UniProtAcc | Q99608 |
Top |
Malignant transformation analysis |
| Identification of the aberrant gene expression in precancerous and cancerous lesions by comparing the gene expression of stem-like cells in diseased tissues with normal stem cells |
| Entrez ID | Symbol | Replicates | Species | Organ | Tissue | Adj P-value | Log2FC | Malignancy |
| 4692 | NDN | AEH-subject1 | Human | Endometrium | AEH | 9.38e-35 | -5.68e-01 | -0.3059 |
| 4692 | NDN | AEH-subject2 | Human | Endometrium | AEH | 8.10e-29 | -5.58e-01 | -0.2525 |
| 4692 | NDN | AEH-subject3 | Human | Endometrium | AEH | 9.00e-27 | -5.27e-01 | -0.2576 |
| 4692 | NDN | AEH-subject4 | Human | Endometrium | AEH | 4.04e-14 | -4.83e-01 | -0.2657 |
| 4692 | NDN | AEH-subject5 | Human | Endometrium | AEH | 2.98e-29 | -5.65e-01 | -0.2953 |
| 4692 | NDN | EEC-subject1 | Human | Endometrium | EEC | 5.13e-36 | -5.78e-01 | -0.2682 |
| 4692 | NDN | EEC-subject2 | Human | Endometrium | EEC | 1.02e-35 | -5.71e-01 | -0.2607 |
| 4692 | NDN | EEC-subject3 | Human | Endometrium | EEC | 2.65e-39 | -5.74e-01 | -0.2525 |
| 4692 | NDN | EEC-subject4 | Human | Endometrium | EEC | 1.90e-24 | -5.41e-01 | -0.2571 |
| 4692 | NDN | EEC-subject5 | Human | Endometrium | EEC | 1.45e-37 | -5.83e-01 | -0.249 |
| 4692 | NDN | GSM5276934 | Human | Endometrium | EEC | 5.14e-14 | -4.05e-01 | -0.0913 |
| 4692 | NDN | GSM5276935 | Human | Endometrium | EEC | 1.94e-31 | -5.76e-01 | -0.123 |
| 4692 | NDN | GSM5276937 | Human | Endometrium | EEC | 1.85e-07 | -3.84e-01 | -0.0897 |
| 4692 | NDN | GSM6177620_NYU_UCEC1_lib1_lib1 | Human | Endometrium | EEC | 1.03e-28 | -5.83e-01 | -0.1869 |
| 4692 | NDN | GSM6177620_NYU_UCEC1_lib2_lib2 | Human | Endometrium | EEC | 1.19e-25 | -5.83e-01 | -0.1875 |
| 4692 | NDN | GSM6177620_NYU_UCEC1_lib3_lib3 | Human | Endometrium | EEC | 1.07e-29 | -5.83e-01 | -0.1883 |
| 4692 | NDN | GSM6177621_NYU_UCEC2_lib1_lib1 | Human | Endometrium | EEC | 5.49e-38 | -5.79e-01 | -0.1934 |
| 4692 | NDN | GSM6177622_NYU_UCEC3_lib1_lib1 | Human | Endometrium | EEC | 2.08e-38 | -5.83e-01 | -0.1917 |
| 4692 | NDN | GSM6177622_NYU_UCEC3_lib2_lib2 | Human | Endometrium | EEC | 4.13e-38 | -5.83e-01 | -0.1916 |
| 4692 | NDN | GSM6177623_NYU_UCEC3_Vis | Human | Endometrium | EEC | 3.42e-17 | -4.78e-01 | -0.1269 |
| Page: 1 2 3 4 |
| Tissue | Expression Dynamics | Abbreviation |
| Endometrium | 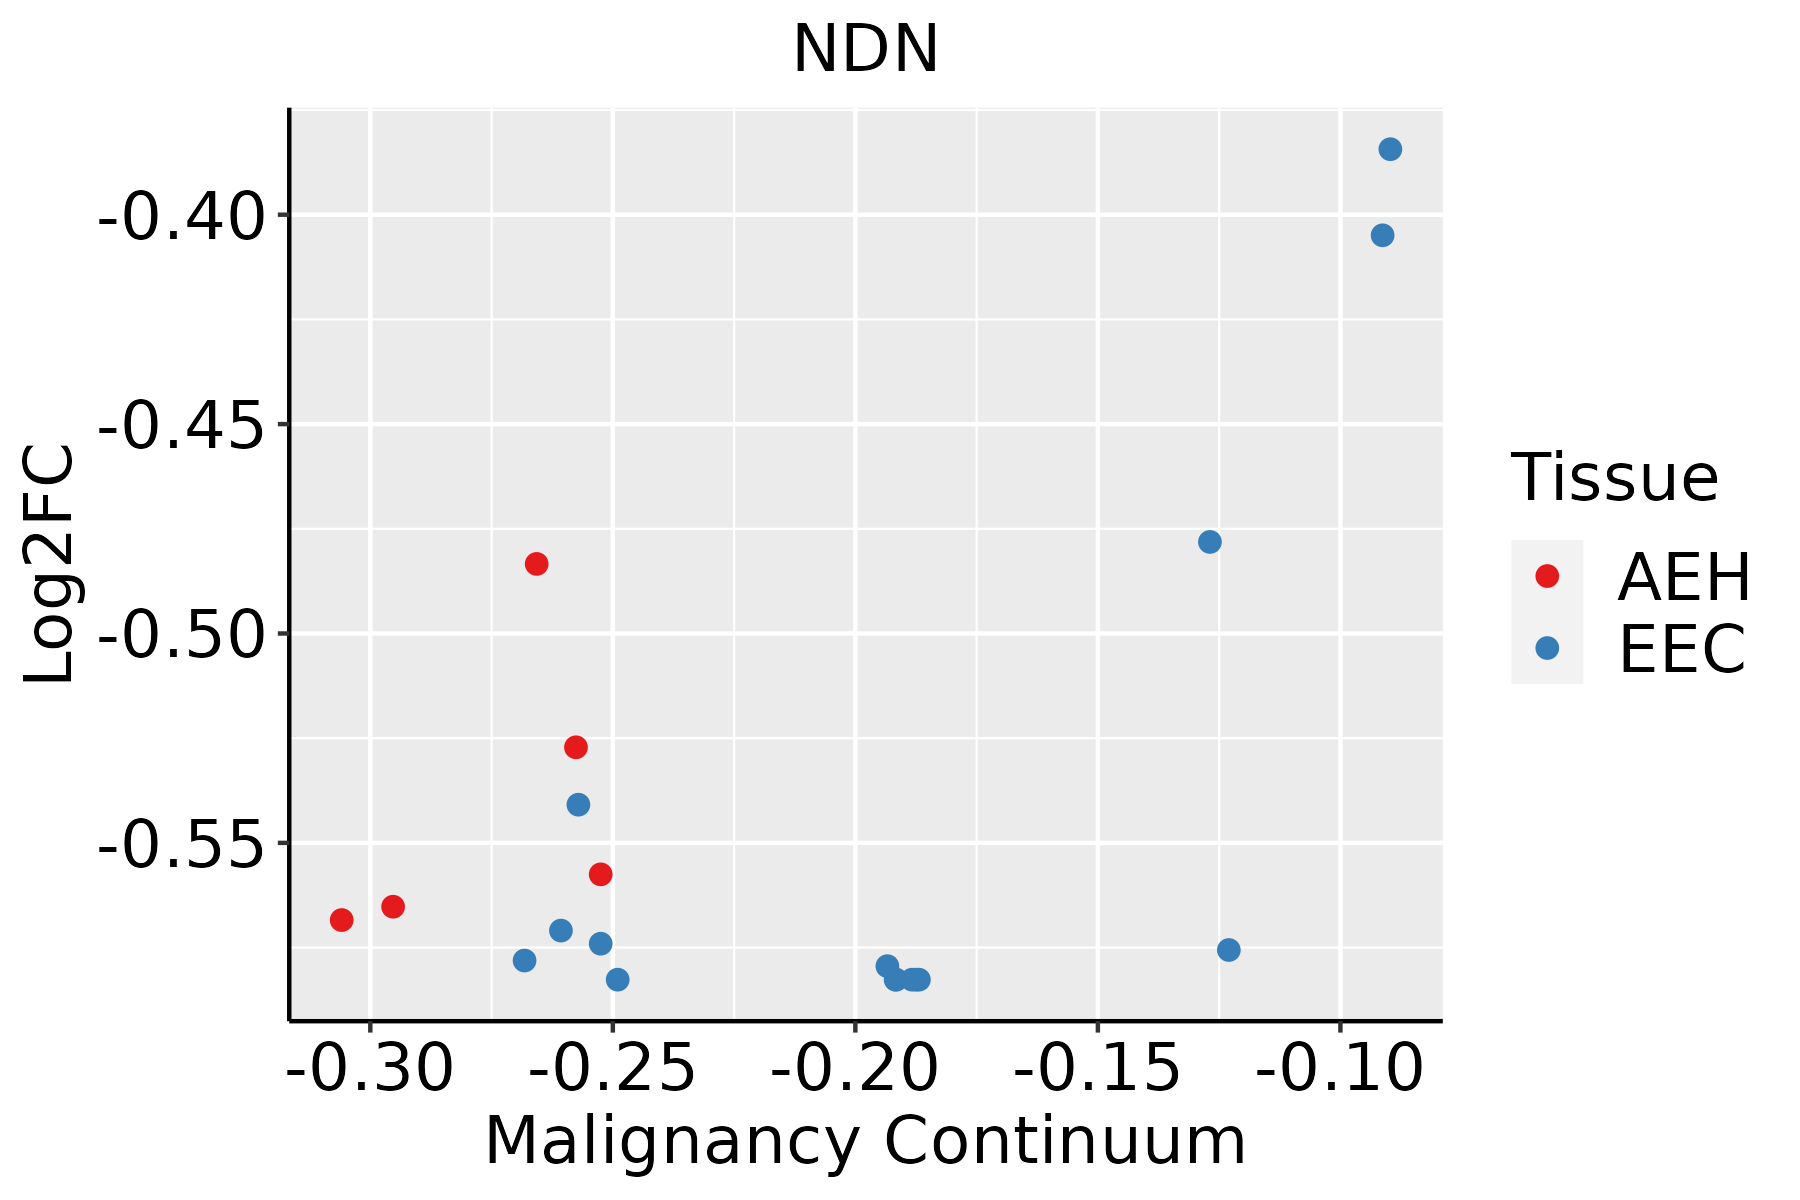 | AEH: Atypical endometrial hyperplasia |
| EEC: Endometrioid Cancer | ||
| Esophagus | 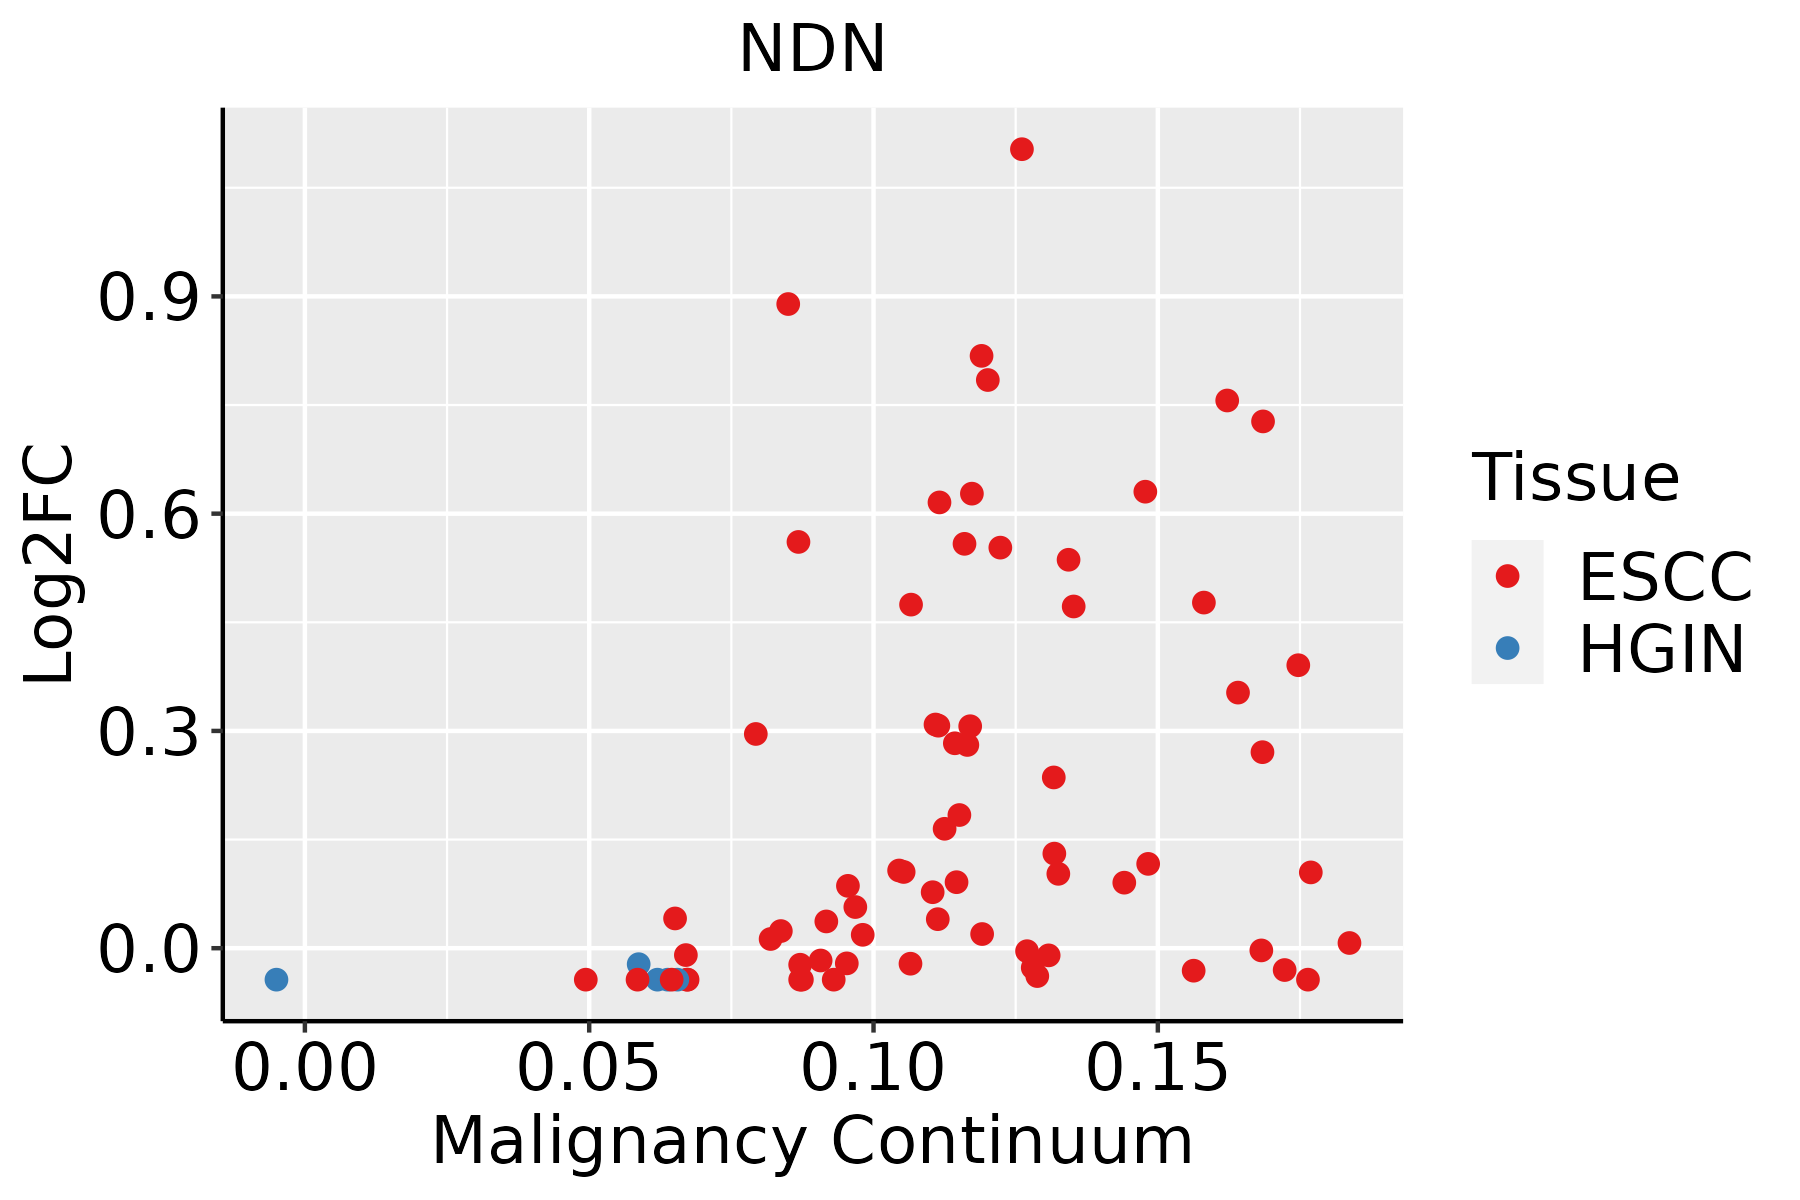 | ESCC: Esophageal squamous cell carcinoma |
| HGIN: High-grade intraepithelial neoplasias | ||
| LGIN: Low-grade intraepithelial neoplasias | ||
| Liver |  | HCC: Hepatocellular carcinoma |
| NAFLD: Non-alcoholic fatty liver disease | ||
| Oral Cavity |  | EOLP: Erosive Oral lichen planus |
| LP: leukoplakia | ||
| NEOLP: Non-erosive oral lichen planus | ||
| OSCC: Oral squamous cell carcinoma | ||
| Thyroid | 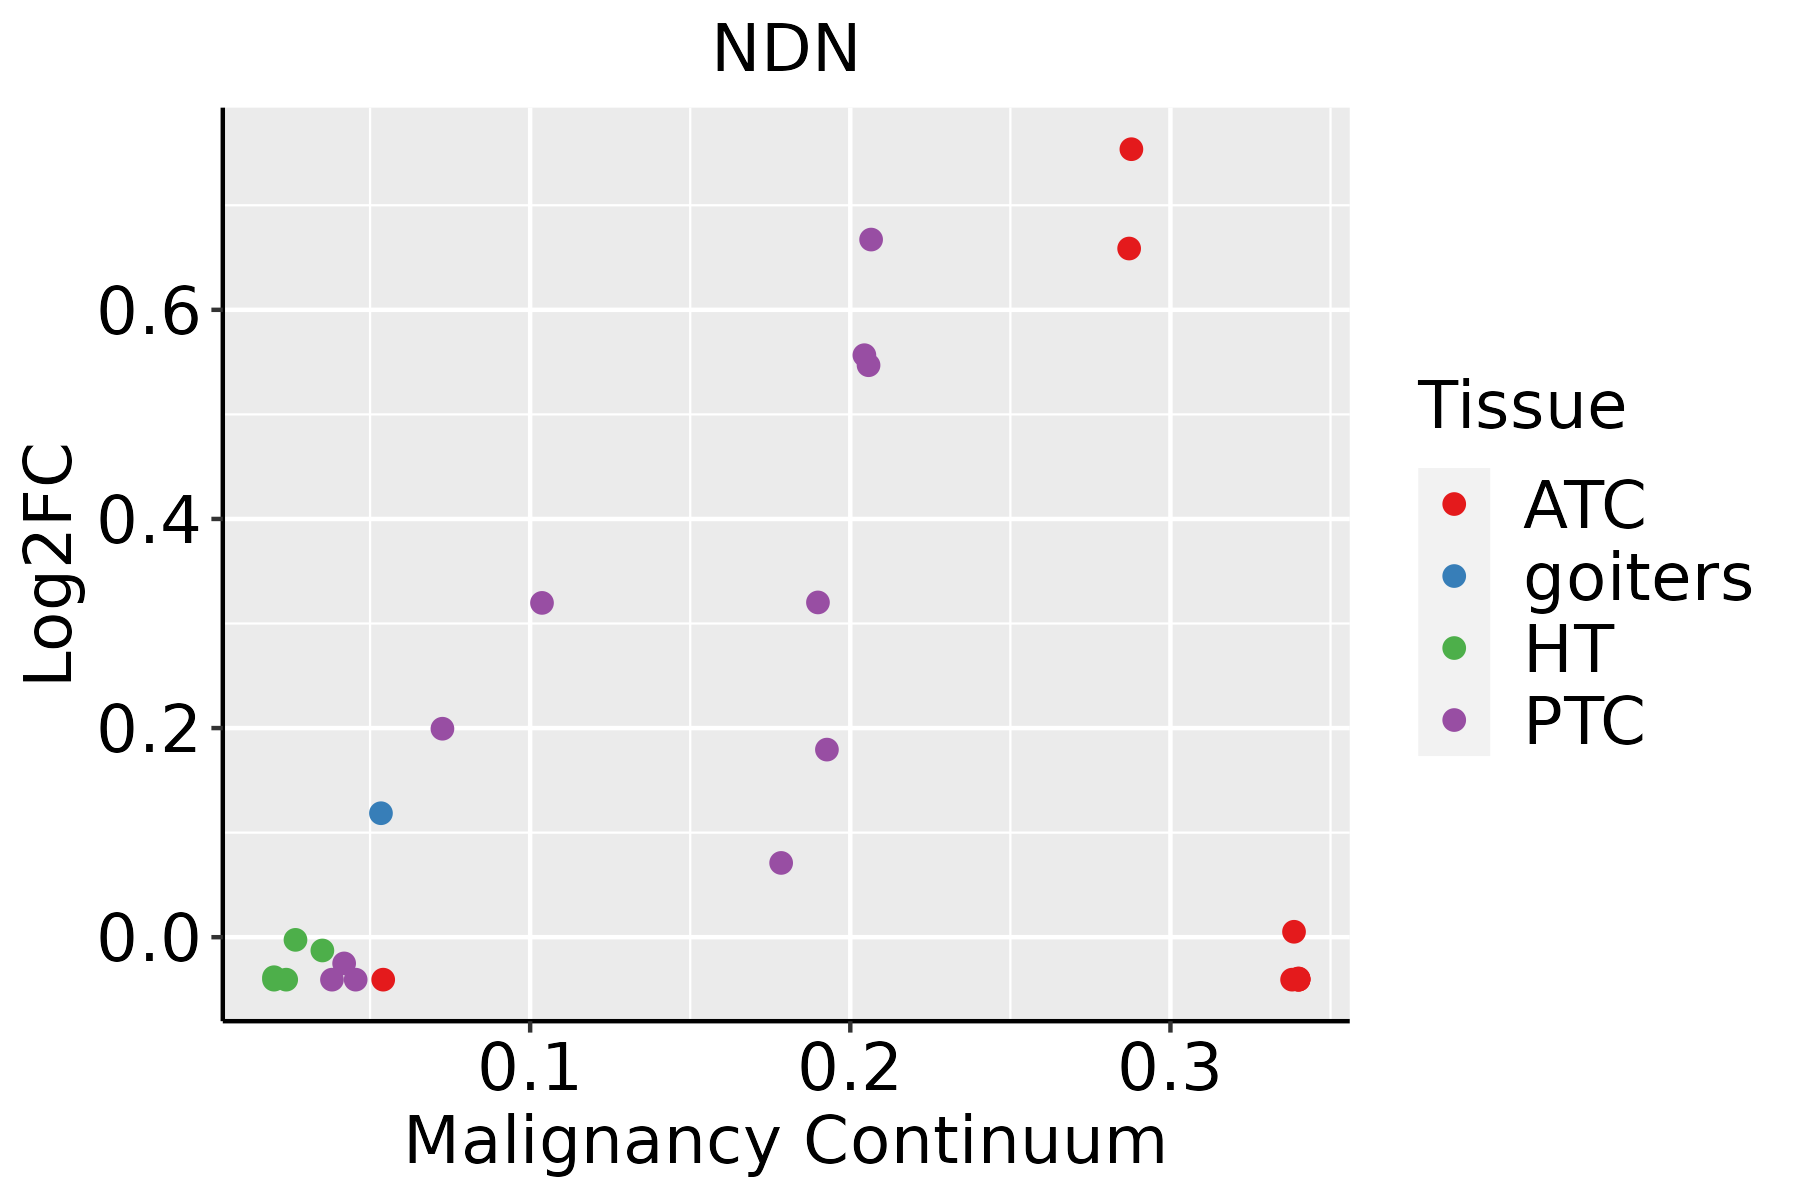 | ATC: Anaplastic thyroid cancer |
| HT: Hashimoto's thyroiditis | ||
| PTC: Papillary thyroid cancer |
| ∗log2FC in expression of this searched gene in stem-like cells from each diseased tissue sample relative to stem-like cells in normal samples in each tissue plotted against the malignancy continuum. Samples are colored based on if they are from different disease stage. |
Top |
Malignant transformation related pathway analysis |
| Find out the enriched GO biological processes and KEGG pathways involved in transition from healthy to precancer to cancer |
| Tissue | Disease Stage | Enriched GO biological Processes |
| Colorectum | AD |  |
| Colorectum | SER |  |
| Colorectum | MSS |  |
| Colorectum | MSI-H |  |
| Colorectum | FAP |  |
| ∗Top 15 enriched GO BP terms are showed in the bar plot of each disease state in each tissue. Each row represents a significant GO biological process which is colored according to the -log10(p.adjust). |
| Page: 1 2 3 4 5 6 7 8 9 |
| GO ID | Tissue | Disease Stage | Description | Gene Ratio | Bg Ratio | pvalue | p.adjust | Count |
| GO:00160499 | Endometrium | AEH | cell growth | 93/2100 | 482/18723 | 1.00e-07 | 4.99e-06 | 93 |
| GO:00605607 | Endometrium | AEH | developmental growth involved in morphogenesis | 53/2100 | 234/18723 | 4.02e-07 | 1.67e-05 | 53 |
| GO:00074098 | Endometrium | AEH | axonogenesis | 81/2100 | 418/18723 | 5.54e-07 | 2.12e-05 | 81 |
| GO:00615648 | Endometrium | AEH | axon development | 88/2100 | 467/18723 | 6.39e-07 | 2.38e-05 | 88 |
| GO:00486757 | Endometrium | AEH | axon extension | 31/2100 | 120/18723 | 6.13e-06 | 1.50e-04 | 31 |
| GO:00485887 | Endometrium | AEH | developmental cell growth | 48/2100 | 234/18723 | 2.39e-05 | 4.53e-04 | 48 |
| GO:19901386 | Endometrium | AEH | neuron projection extension | 38/2100 | 172/18723 | 3.03e-05 | 5.56e-04 | 38 |
| GO:00017642 | Endometrium | AEH | neuron migration | 31/2100 | 156/18723 | 1.08e-03 | 9.46e-03 | 31 |
| GO:00510905 | Endometrium | AEH | regulation of DNA-binding transcription factor activity | 69/2100 | 440/18723 | 2.51e-03 | 1.87e-02 | 69 |
| GO:006156412 | Endometrium | EEC | axon development | 93/2168 | 467/18723 | 9.60e-08 | 4.69e-06 | 93 |
| GO:001604915 | Endometrium | EEC | cell growth | 95/2168 | 482/18723 | 1.16e-07 | 5.54e-06 | 95 |
| GO:006056013 | Endometrium | EEC | developmental growth involved in morphogenesis | 54/2168 | 234/18723 | 4.60e-07 | 1.78e-05 | 54 |
| GO:000740912 | Endometrium | EEC | axonogenesis | 82/2168 | 418/18723 | 1.03e-06 | 3.49e-05 | 82 |
| GO:004867513 | Endometrium | EEC | axon extension | 31/2168 | 120/18723 | 1.17e-05 | 2.43e-04 | 31 |
| GO:004858813 | Endometrium | EEC | developmental cell growth | 49/2168 | 234/18723 | 2.59e-05 | 4.56e-04 | 49 |
| GO:199013813 | Endometrium | EEC | neuron projection extension | 38/2168 | 172/18723 | 6.08e-05 | 9.21e-04 | 38 |
| GO:005109013 | Endometrium | EEC | regulation of DNA-binding transcription factor activity | 75/2168 | 440/18723 | 3.71e-04 | 3.97e-03 | 75 |
| GO:00017641 | Endometrium | EEC | neuron migration | 33/2168 | 156/18723 | 4.17e-04 | 4.38e-03 | 33 |
| GO:00097916 | Endometrium | EEC | post-embryonic development | 17/2168 | 80/18723 | 9.23e-03 | 4.95e-02 | 17 |
| GO:0016049110 | Esophagus | ESCC | cell growth | 289/8552 | 482/18723 | 1.29e-10 | 3.77e-09 | 289 |
| Page: 1 2 3 4 5 6 |
| Pathway ID | Tissue | Disease Stage | Description | Gene Ratio | Bg Ratio | pvalue | p.adjust | qvalue | Count |
| Page: 1 |
Top |
Cell-cell communication analysis |
| Identification of potential cell-cell interactions between two cell types and their ligand-receptor pairs for different disease states |
| Ligand | Receptor | LRpair | Pathway | Tissue | Disease Stage |
| Page: 1 |
Top |
Single-cell gene regulatory network inference analysis |
| Find out the significant the regulons (TFs) and the target genes of each regulon across cell types for different disease states |
| TF | Cell Type | Tissue | Disease Stage | Target Gene | RSS | Regulon Activity |
| ∗The dot plots of a searched regulon are shown for all cell subpopulations in each disease state of each tissue based on the regulon specific score inferred using pySCENIC and by calculating the average expression. |
| Page: 1 |
Top |
Somatic mutation of malignant transformation related genes |
| Annotation of somatic variants for genes involved in malignant transformation |
| Hugo Symbol | Variant Class | Variant Classification | dbSNP RS | HGVSc | HGVSp | HGVSp Short | SWISSPROT | BIOTYPE | SIFT | PolyPhen | Tumor Sample Barcode | Tissue | Histology | Sex | Age | Stage | Therapy Types | Drugs | Outcome |
| NDN | SNV | Missense_Mutation | c.351N>A | p.Met117Ile | p.M117I | Q99608 | protein_coding | tolerated(1) | benign(0.055) | TCGA-A8-A07P-01 | Breast | breast invasive carcinoma | Female | >=65 | I/II | Chemotherapy | 5-fluorouracil | SD | |
| NDN | SNV | Missense_Mutation | novel | c.335N>G | p.Lys112Arg | p.K112R | Q99608 | protein_coding | deleterious(0.04) | benign(0.17) | TCGA-BH-A0BD-01 | Breast | breast invasive carcinoma | Female | <65 | I/II | Chemotherapy | doxorubicin | SD |
| NDN | SNV | Missense_Mutation | c.425N>A | p.Arg142His | p.R142H | Q99608 | protein_coding | deleterious(0.01) | possibly_damaging(0.842) | TCGA-BH-A0HO-01 | Breast | breast invasive carcinoma | Female | <65 | I/II | Chemotherapy | cyclophosphamide | SD | |
| NDN | insertion | Frame_Shift_Ins | novel | c.333_334insCTACTGCCTCTGCACCATGG | p.Lys112LeufsTer13 | p.K112Lfs*13 | Q99608 | protein_coding | TCGA-BH-A0BD-01 | Breast | breast invasive carcinoma | Female | <65 | I/II | Chemotherapy | doxorubicin | SD | ||
| NDN | SNV | Missense_Mutation | c.745N>T | p.Arg249Cys | p.R249C | Q99608 | protein_coding | deleterious(0) | probably_damaging(0.954) | TCGA-EA-A5ZE-01 | Cervix | cervical & endocervical cancer | Female | <65 | I/II | Unknown | Unknown | PD | |
| NDN | SNV | Missense_Mutation | c.445C>T | p.Arg149Trp | p.R149W | Q99608 | protein_coding | deleterious(0.01) | probably_damaging(0.976) | TCGA-EK-A2GZ-01 | Cervix | cervical & endocervical cancer | Female | <65 | III/IV | Unknown | Unknown | SD | |
| NDN | SNV | Missense_Mutation | rs549529148 | c.718N>A | p.Val240Ile | p.V240I | Q99608 | protein_coding | deleterious(0) | probably_damaging(0.985) | TCGA-MA-AA3W-01 | Cervix | cervical & endocervical cancer | Female | <65 | I/II | Chemotherapy | cisplatin | CR |
| NDN | SNV | Missense_Mutation | c.913C>T | p.Arg305Trp | p.R305W | Q99608 | protein_coding | deleterious(0) | possibly_damaging(0.63) | TCGA-5M-AAT6-01 | Colorectum | colon adenocarcinoma | Female | <65 | III/IV | Unknown | Unknown | PD | |
| NDN | SNV | Missense_Mutation | c.685N>T | p.Gly229Trp | p.G229W | Q99608 | protein_coding | deleterious(0) | probably_damaging(0.999) | TCGA-AA-3715-01 | Colorectum | colon adenocarcinoma | Male | >=65 | I/II | Unknown | Unknown | PD | |
| NDN | SNV | Missense_Mutation | novel | c.14G>T | p.Ser5Ile | p.S5I | Q99608 | protein_coding | deleterious_low_confidence(0.01) | benign(0.352) | TCGA-AA-3939-01 | Colorectum | colon adenocarcinoma | Male | >=65 | I/II | Unknown | Unknown | SD |
| Page: 1 2 3 4 5 6 7 8 |
Top |
Related drugs of malignant transformation related genes |
| Identification of chemicals and drugs interact with genes involved in malignant transfromation |
| (DGIdb 4.0) |
| Entrez ID | Symbol | Category | Interaction Types | Drug Claim Name | Drug Name | PMIDs |
| Page: 1 |

Copyright 2023-Present -The University of Texas Health Science Center at Houston |