Schematic overview of the cellular and molecular mechanisms involved in the cancer progression, including the proposed cellular and molecular mechanisms in cancer cells trajectory. AT1: alveolar type 1 cells; AT2: alveolar type 2 cells; AAH: atypical adenomatous hyperplasia; AIS: adenocarcinoma in situ; MIA: minimally invasive adenocarcinoma; IA: invasive adenocarcinoma; EMT: epithelial-mesenchymal transition

Home

Download

Statistics

Help

Contact

Center for Computational Systems Medicine
leaf

Gene summary

leaf

Malignant transformation analysis

leaf

Malignant transformation related pathway analysis

leaf

Cell-cell communication analysis

leaf

Single-cell gene regulatory network inference analysis

leaf

Somatic mutation of malignant transformation related genes

leaf

Related drugs of malignant transformation related genes

Gene: NDFIP2

Gene summary for NDFIP2

check button Gene summary.

Gene informationSpeciesHuman
Gene symbol

NDFIP2

Gene ID

54602

Gene nameNedd4 family interacting protein 2
Gene AliasN4WBP5A
Cytomap13q31.1
Gene Typeprotein-coding
GO ID

GO:0006464

UniProtAcc

B4DGY6


Top

Malignant transformation analysis

check button Identification of the aberrant gene expression in precancerous and cancerous lesions by comparing the gene expression of stem-like cells in diseased tissues with normal stem cells
check button Malignant transformation involving gene list.
Entrez IDSymbolReplicatesSpeciesOrganTissueAdj P-valueLog2FCMalignancy
54602NDFIP2HTA11_3410_2000001011HumanColorectumAD1.47e-15-5.82e-010.0155
54602NDFIP2HTA11_78_2000001011HumanColorectumAD2.68e-03-3.63e-01-0.1088
54602NDFIP2HTA11_3361_2000001011HumanColorectumAD3.57e-04-5.26e-01-0.1207
54602NDFIP2HTA11_696_2000001011HumanColorectumAD5.10e-11-4.56e-01-0.1464
54602NDFIP2HTA11_866_2000001011HumanColorectumAD2.38e-08-4.24e-01-0.1001
54602NDFIP2HTA11_1391_2000001011HumanColorectumAD4.94e-02-3.69e-01-0.059
54602NDFIP2HTA11_546_2000001011HumanColorectumAD3.60e-02-4.80e-01-0.0842
54602NDFIP2HTA11_866_3004761011HumanColorectumAD3.44e-04-4.07e-010.096
54602NDFIP2HTA11_10711_2000001011HumanColorectumAD5.98e-07-5.80e-010.0338
54602NDFIP2HTA11_7696_3000711011HumanColorectumAD6.54e-13-5.07e-010.0674
54602NDFIP2HTA11_6818_2000001021HumanColorectumAD6.24e-07-6.14e-010.0588
54602NDFIP2HTA11_99999974143_84620HumanColorectumMSS1.43e-12-5.17e-010.3005
54602NDFIP2A015-C-203HumanColorectumFAP2.17e-27-5.19e-01-0.1294
54602NDFIP2A015-C-204HumanColorectumFAP8.63e-03-2.75e-01-0.0228
54602NDFIP2A014-C-040HumanColorectumFAP1.73e-03-3.10e-01-0.1184
54602NDFIP2A002-C-201HumanColorectumFAP9.81e-09-3.03e-010.0324
54602NDFIP2A001-C-119HumanColorectumFAP1.98e-12-5.72e-01-0.1557
54602NDFIP2A001-C-108HumanColorectumFAP9.69e-17-3.94e-01-0.0272
54602NDFIP2A002-C-205HumanColorectumFAP2.15e-21-5.37e-01-0.1236
54602NDFIP2A001-C-104HumanColorectumFAP6.85e-06-2.82e-010.0184
Page: 1 2 3 4 5 6 7 

check button Transcriptomic changes along malignancy continuum.
TissueExpression DynamicsAbbreviation
Colorectum (GSE201348)The image shows the transcriptomic changes along malignancy continuum.log2FC in expression of this searched gene in stem-like cells from each diseased tissue sample relative to stem-like cells in normal samples in each tissue plotted against the malignancy continuum. Samples are colored based on if they are from different disease stage.FAP: Familial adenomatous polyposis
CRC: Colorectal cancer
Colorectum (HTA11)The image shows the transcriptomic changes along malignancy continuum.log2FC in expression of this searched gene in stem-like cells from each diseased tissue sample relative to stem-like cells in normal samples in each tissue plotted against the malignancy continuum. Samples are colored based on if they are from different disease stage.AD: Adenomas
SER: Sessile serrated lesions
MSI-H: Microsatellite-high colorectal cancer
MSS: Microsatellite stable colorectal cancer
EsophagusThe image shows the transcriptomic changes along malignancy continuum.log2FC in expression of this searched gene in stem-like cells from each diseased tissue sample relative to stem-like cells in normal samples in each tissue plotted against the malignancy continuum. Samples are colored based on if they are from different disease stage.ESCC: Esophageal squamous cell carcinoma
HGIN: High-grade intraepithelial neoplasias
LGIN: Low-grade intraepithelial neoplasias
LiverThe image shows the transcriptomic changes along malignancy continuum.log2FC in expression of this searched gene in stem-like cells from each diseased tissue sample relative to stem-like cells in normal samples in each tissue plotted against the malignancy continuum. Samples are colored based on if they are from different disease stage.
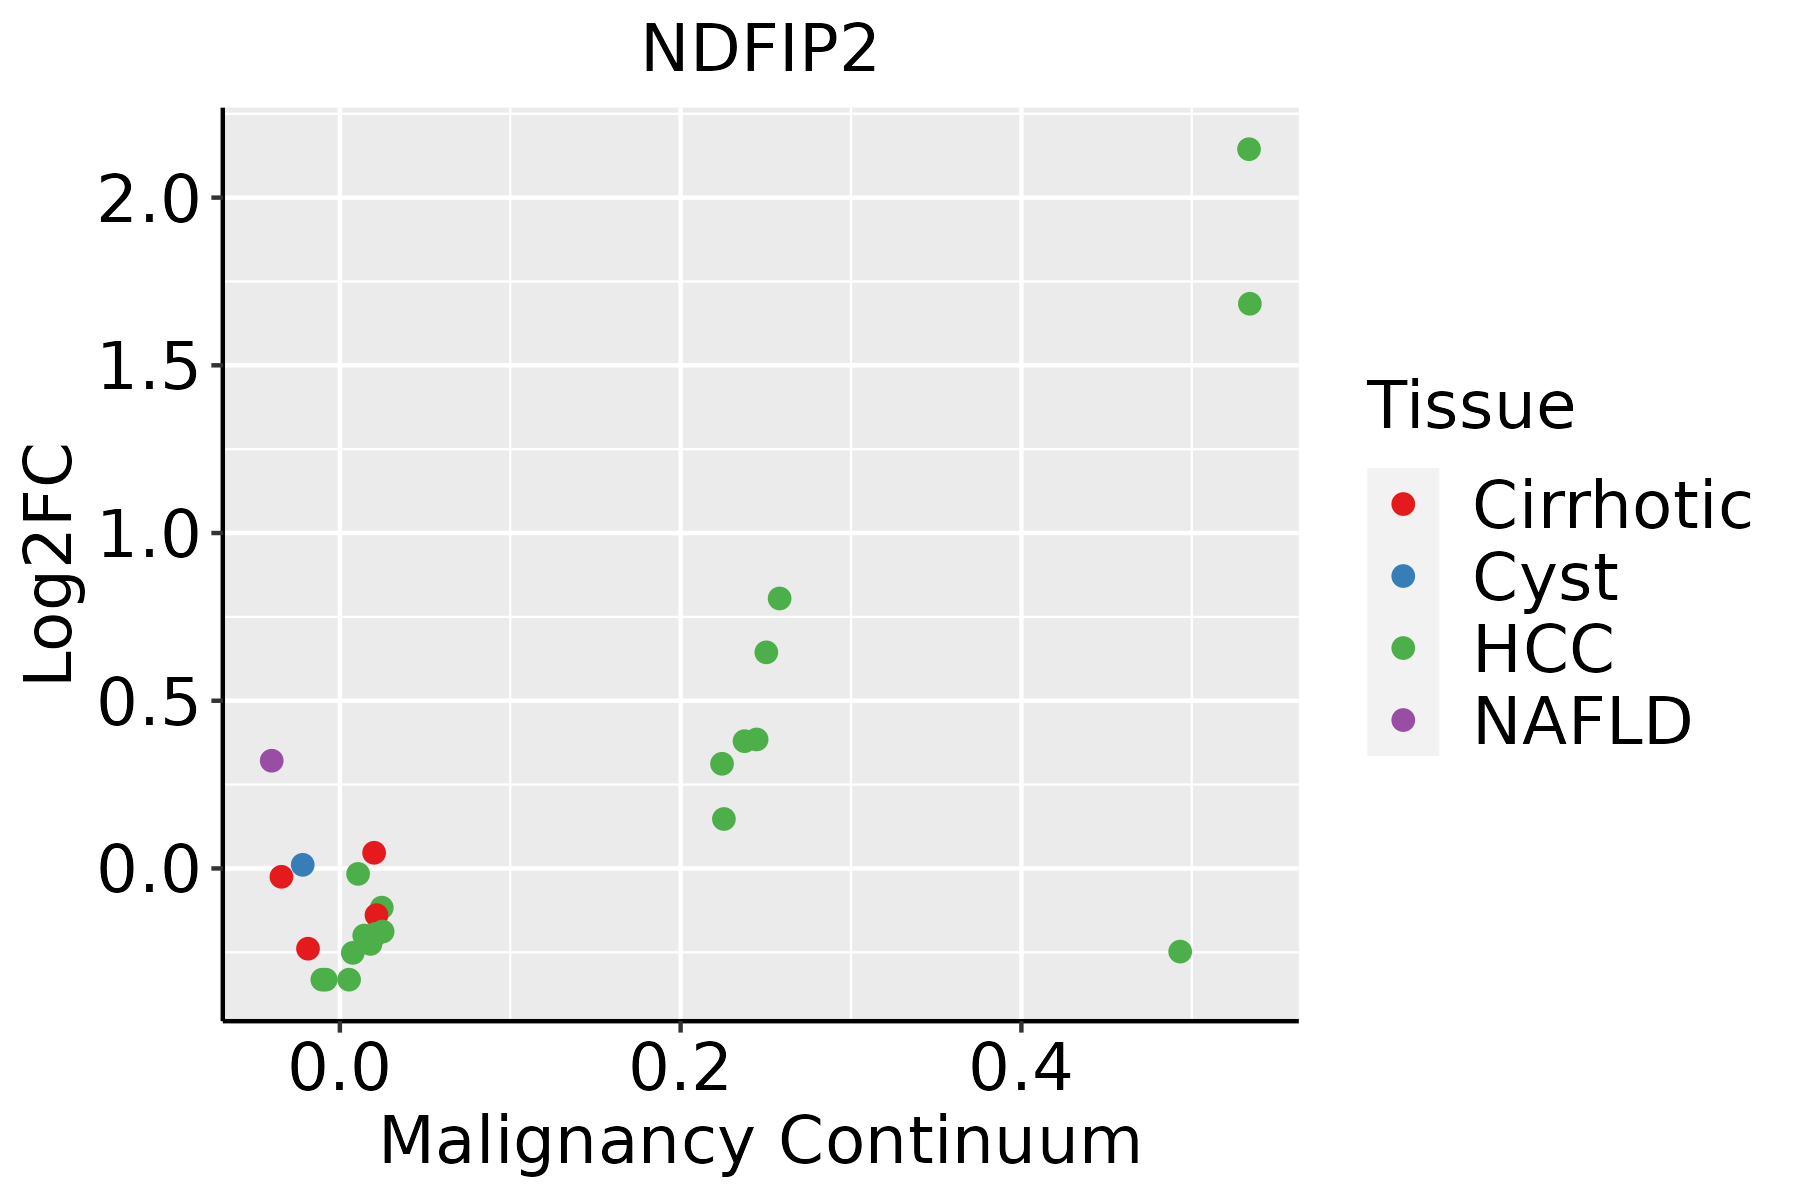
HCC: Hepatocellular carcinoma
NAFLD: Non-alcoholic fatty liver disease
Oral CavityThe image shows the transcriptomic changes along malignancy continuum.log2FC in expression of this searched gene in stem-like cells from each diseased tissue sample relative to stem-like cells in normal samples in each tissue plotted against the malignancy continuum. Samples are colored based on if they are from different disease stage.EOLP: Erosive Oral lichen planus
LP: leukoplakia
NEOLP: Non-erosive oral lichen planus
OSCC: Oral squamous cell carcinoma
SkinThe image shows the transcriptomic changes along malignancy continuum.log2FC in expression of this searched gene in stem-like cells from each diseased tissue sample relative to stem-like cells in normal samples in each tissue plotted against the malignancy continuum. Samples are colored based on if they are from different disease stage.AK: Actinic keratosis
cSCC: Cutaneous squamous cell carcinoma
SCCIS:squamous cell carcinoma in situ
∗log2FC in expression of this searched gene in stem-like cells from each diseased tissue sample relative to stem-like cells in normal samples in each tissue plotted against the malignancy continuum. Samples are colored based on if they are from different disease stage.

Top

Malignant transformation related pathway analysis

check buttonFind out the enriched GO biological processes and KEGG pathways involved in transition from healthy to precancer to cancer
check button Figure of enriched GO biological processes.
TissueDisease StageEnriched GO biological Processes
ColorectumADGO analysis - Figure of enriched GO biological processes: Top 15 enriched GO BP terms are showed in the bar plot of each disease state in each tissue. Each row represents a significant GO biological process which is colored according to the -log10(p.adjust).
ColorectumSERGO analysis - Figure of enriched GO biological processes: Top 15 enriched GO BP terms are showed in the bar plot of each disease state in each tissue. Each row represents a significant GO biological process which is colored according to the -log10(p.adjust).
ColorectumMSSGO analysis - Figure of enriched GO biological processes: Top 15 enriched GO BP terms are showed in the bar plot of each disease state in each tissue. Each row represents a significant GO biological process which is colored according to the -log10(p.adjust).
ColorectumMSI-HGO analysis - Figure of enriched GO biological processes: Top 15 enriched GO BP terms are showed in the bar plot of each disease state in each tissue. Each row represents a significant GO biological process which is colored according to the -log10(p.adjust).
ColorectumFAPGO analysis - Figure of enriched GO biological processes: Top 15 enriched GO BP terms are showed in the bar plot of each disease state in each tissue. Each row represents a significant GO biological process which is colored according to the -log10(p.adjust).
∗Top 15 enriched GO BP terms are showed in the bar plot of each disease state in each tissue. Each row represents a significant GO biological process which is colored according to the -log10(p.adjust).
Page: 1 2 3 4 5 6 7 8 9 

check button Enriched GO biological processes.
GO IDTissueDisease StageDescriptionGene RatioBg Ratiopvaluep.adjustCount
GO:1903320ColorectumADregulation of protein modification by small protein conjugation or removal86/3918242/187239.43e-084.65e-0686
GO:0007034ColorectumADvacuolar transport60/3918157/187234.97e-071.85e-0560
GO:0031396ColorectumADregulation of protein ubiquitination72/3918210/187234.50e-061.21e-0472
GO:0043123ColorectumADpositive regulation of I-kappaB kinase/NF-kappaB signaling60/3918186/187231.91e-042.56e-0360
GO:0043122ColorectumADregulation of I-kappaB kinase/NF-kappaB signaling76/3918249/187232.17e-042.85e-0376
GO:0007249ColorectumADI-kappaB kinase/NF-kappaB signaling82/3918281/187236.09e-046.40e-0382
GO:19033202ColorectumMSSregulation of protein modification by small protein conjugation or removal82/3467242/187237.49e-094.63e-0782
GO:00313962ColorectumMSSregulation of protein ubiquitination70/3467210/187231.88e-078.26e-0670
GO:00070342ColorectumMSSvacuolar transport52/3467157/187238.25e-062.07e-0452
GO:00431221ColorectumMSSregulation of I-kappaB kinase/NF-kappaB signaling71/3467249/187237.12e-051.21e-0371
GO:00072491ColorectumMSSI-kappaB kinase/NF-kappaB signaling77/3467281/187231.51e-042.19e-0377
GO:00431231ColorectumMSSpositive regulation of I-kappaB kinase/NF-kappaB signaling55/3467186/187231.60e-042.29e-0355
GO:00324091ColorectumMSSregulation of transporter activity78/3467310/187232.09e-031.78e-0278
GO:00510511ColorectumMSSnegative regulation of transport110/3467470/187234.20e-033.04e-02110
GO:19033204ColorectumFAPregulation of protein modification by small protein conjugation or removal61/2622242/187232.36e-069.21e-0561
GO:00313964ColorectumFAPregulation of protein ubiquitination50/2622210/187239.03e-051.59e-0350
GO:00070343ColorectumFAPvacuolar transport40/2622157/187239.41e-051.61e-0340
GO:00324092ColorectumFAPregulation of transporter activity67/2622310/187231.59e-042.43e-0367
GO:00431222ColorectumFAPregulation of I-kappaB kinase/NF-kappaB signaling56/2622249/187231.82e-042.69e-0356
GO:00510512ColorectumFAPnegative regulation of transport91/2622470/187237.09e-047.64e-0391
Page: 1 2 3 4 5 6 

check button Enriched KEGG pathways.
Pathway IDTissueDisease StageDescriptionGene RatioBg Ratiopvaluep.adjustqvalueCount
Page: 1 

Top

Cell-cell communication analysis

check buttonIdentification of potential cell-cell interactions between two cell types and their ligand-receptor pairs for different disease states
LigandReceptorLRpairPathwayTissueDisease Stage
Page: 1 

Top

Single-cell gene regulatory network inference analysis

check buttonFind out the significant the regulons (TFs) and the target genes of each regulon across cell types for different disease states
TFCell TypeTissueDisease StageTarget GeneRSSRegulon Activity
∗The dot plots of a searched regulon are shown for all cell subpopulations in each disease state of each tissue based on the regulon specific score inferred using pySCENIC and by calculating the average expression.
Page: 1 

Top

Somatic mutation of malignant transformation related genes

check buttonAnnotation of somatic variants for genes involved in malignant transformation
Hugo SymbolVariant ClassVariant ClassificationdbSNP RSHGVScHGVSpHGVSp ShortSWISSPROTBIOTYPESIFTPolyPhenTumor Sample BarcodeTissueHistologySexAgeStageTherapy TypesDrugsOutcome
NDFIP2SNVMissense_Mutationc.203N>Tp.Thr68Metp.T68MQ9NV92protein_codingdeleterious_low_confidence(0)benign(0.01)TCGA-AO-A0J9-01Breastbreast invasive carcinomaFemale<65III/IVChemotherapycyclophosphamidePD
NDFIP2SNVMissense_Mutationc.943N>Gp.Leu315Valp.L315VQ9NV92protein_codingtolerated(0.12)probably_damaging(0.999)TCGA-AR-A0TX-01Breastbreast invasive carcinomaFemale<65I/IIUnknownUnknownSD
NDFIP2SNVMissense_Mutationrs754913477c.341N>Tp.Asn114Ilep.N114IQ9NV92protein_codingdeleterious(0.01)benign(0.11)TCGA-PL-A8LZ-01Breastbreast invasive carcinomaFemale<65III/IVChemotherapypaclitaxelSD
NDFIP2insertionFrame_Shift_Insnovelc.765_766insTTGCTCTGTTGCCCp.Asn256LeufsTer8p.N256Lfs*8Q9NV92protein_codingTCGA-B6-A0IA-01Breastbreast invasive carcinomaFemale<65I/IIUnknownUnknownSD
NDFIP2SNVMissense_Mutationnovelc.872N>Ap.Gly291Glup.G291EQ9NV92protein_codingdeleterious(0.03)probably_damaging(1)TCGA-VS-A94W-01Cervixcervical & endocervical cancerFemale<65I/IIChemotherapycisplatinCR
NDFIP2deletionIn_Frame_Delnovelc.826_828delNNNp.Ile276delp.I276delQ9NV92protein_codingTCGA-BI-A20A-01Cervixcervical & endocervical cancerFemale<65I/IIUnknownUnknownSD
NDFIP2SNVMissense_Mutationrs775126701c.517N>Ap.Val173Metp.V173MQ9NV92protein_codingdeleterious(0.01)probably_damaging(0.961)TCGA-AZ-4313-01Colorectumcolon adenocarcinomaFemale<65I/IIUnknownUnknownSD
NDFIP2SNVMissense_Mutationc.353N>Tp.Ser118Leup.S118LQ9NV92protein_codingdeleterious(0.03)benign(0)TCGA-AH-6544-01Colorectumrectum adenocarcinomaMale<65III/IVChemotherapyoxaliplatinSD
NDFIP2insertionIn_Frame_Insnovelc.829_830insTTATTGTCAGGGTGAGTGTCTp.Arg280_Phe281insValSerValPheIleValArgp.R280_F281insVSVFIVRQ9NV92protein_codingTCGA-F4-6809-01Colorectumcolon adenocarcinomaFemale<65I/IIUnknownUnknownPD
NDFIP2SNVMissense_Mutationnovelc.932T>Gp.Phe311Cysp.F311CQ9NV92protein_codingdeleterious(0.03)probably_damaging(1)TCGA-AP-A056-01Endometriumuterine corpus endometrioid carcinomaFemale<65I/IIUnknownUnknownSD
Page: 1 2 3 

Top

Related drugs of malignant transformation related genes

check buttonIdentification of chemicals and drugs interact with genes involved in malignant transfromation
(DGIdb 4.0)
Entrez IDSymbolCategoryInteraction TypesDrug Claim NameDrug NamePMIDs
Page: 1