
|
|||||
|
 | |
| |
| |
| |
| |
| |
|
Gene: NDFIP1 |
Gene summary for NDFIP1 |
| Gene information | Species | Human | Gene symbol | NDFIP1 | Gene ID | 80762 |
| Gene name | Nedd4 family interacting protein 1 | |
| Gene Alias | N4WBP5 | |
| Cytomap | 5q31.3 | |
| Gene Type | protein-coding | GO ID | GO:0000018 | UniProtAcc | Q9BT67 |
Top |
Malignant transformation analysis |
| Identification of the aberrant gene expression in precancerous and cancerous lesions by comparing the gene expression of stem-like cells in diseased tissues with normal stem cells |
| Entrez ID | Symbol | Replicates | Species | Organ | Tissue | Adj P-value | Log2FC | Malignancy |
| 80762 | NDFIP1 | HTA11_78_2000001011 | Human | Colorectum | AD | 6.02e-06 | 4.72e-01 | -0.1088 |
| 80762 | NDFIP1 | HTA11_347_2000001011 | Human | Colorectum | AD | 6.24e-12 | 4.51e-01 | -0.1954 |
| 80762 | NDFIP1 | HTA11_99999970781_79442 | Human | Colorectum | MSS | 8.60e-06 | 3.32e-01 | 0.294 |
| 80762 | NDFIP1 | HTA11_99999965062_69753 | Human | Colorectum | MSI-H | 3.08e-03 | 9.59e-01 | 0.3487 |
| 80762 | NDFIP1 | A015-C-203 | Human | Colorectum | FAP | 2.25e-05 | -1.75e-01 | -0.1294 |
| 80762 | NDFIP1 | A001-C-108 | Human | Colorectum | FAP | 4.25e-03 | -1.34e-01 | -0.0272 |
| 80762 | NDFIP1 | A002-C-205 | Human | Colorectum | FAP | 3.98e-03 | -1.86e-01 | -0.1236 |
| 80762 | NDFIP1 | A015-C-104 | Human | Colorectum | FAP | 3.51e-06 | -1.90e-01 | -0.1899 |
| 80762 | NDFIP1 | A001-C-014 | Human | Colorectum | FAP | 2.57e-02 | -9.01e-02 | 0.0135 |
| 80762 | NDFIP1 | A002-C-116 | Human | Colorectum | FAP | 4.38e-04 | -1.52e-01 | -0.0452 |
| 80762 | NDFIP1 | A018-E-020 | Human | Colorectum | FAP | 3.49e-02 | -1.80e-01 | -0.2034 |
| 80762 | NDFIP1 | F034 | Human | Colorectum | FAP | 1.80e-02 | -1.62e-01 | -0.0665 |
| 80762 | NDFIP1 | AEH-subject1 | Human | Endometrium | AEH | 6.57e-03 | -2.00e-01 | -0.3059 |
| 80762 | NDFIP1 | AEH-subject2 | Human | Endometrium | AEH | 1.05e-13 | -3.00e-01 | -0.2525 |
| 80762 | NDFIP1 | AEH-subject3 | Human | Endometrium | AEH | 2.94e-05 | -1.94e-01 | -0.2576 |
| 80762 | NDFIP1 | AEH-subject4 | Human | Endometrium | AEH | 3.65e-06 | -1.76e-01 | -0.2657 |
| 80762 | NDFIP1 | AEH-subject5 | Human | Endometrium | AEH | 7.91e-03 | -2.62e-01 | -0.2953 |
| 80762 | NDFIP1 | EEC-subject1 | Human | Endometrium | EEC | 6.41e-10 | -1.68e-01 | -0.2682 |
| 80762 | NDFIP1 | EEC-subject2 | Human | Endometrium | EEC | 5.76e-14 | -3.79e-01 | -0.2607 |
| 80762 | NDFIP1 | EEC-subject3 | Human | Endometrium | EEC | 2.25e-28 | -3.88e-01 | -0.2525 |
| Page: 1 2 3 4 5 6 7 8 9 |
| Tissue | Expression Dynamics | Abbreviation |
| Colorectum (GSE201348) |  | FAP: Familial adenomatous polyposis |
| CRC: Colorectal cancer | ||
| Colorectum (HTA11) |  | AD: Adenomas |
| SER: Sessile serrated lesions | ||
| MSI-H: Microsatellite-high colorectal cancer | ||
| MSS: Microsatellite stable colorectal cancer | ||
| Endometrium | 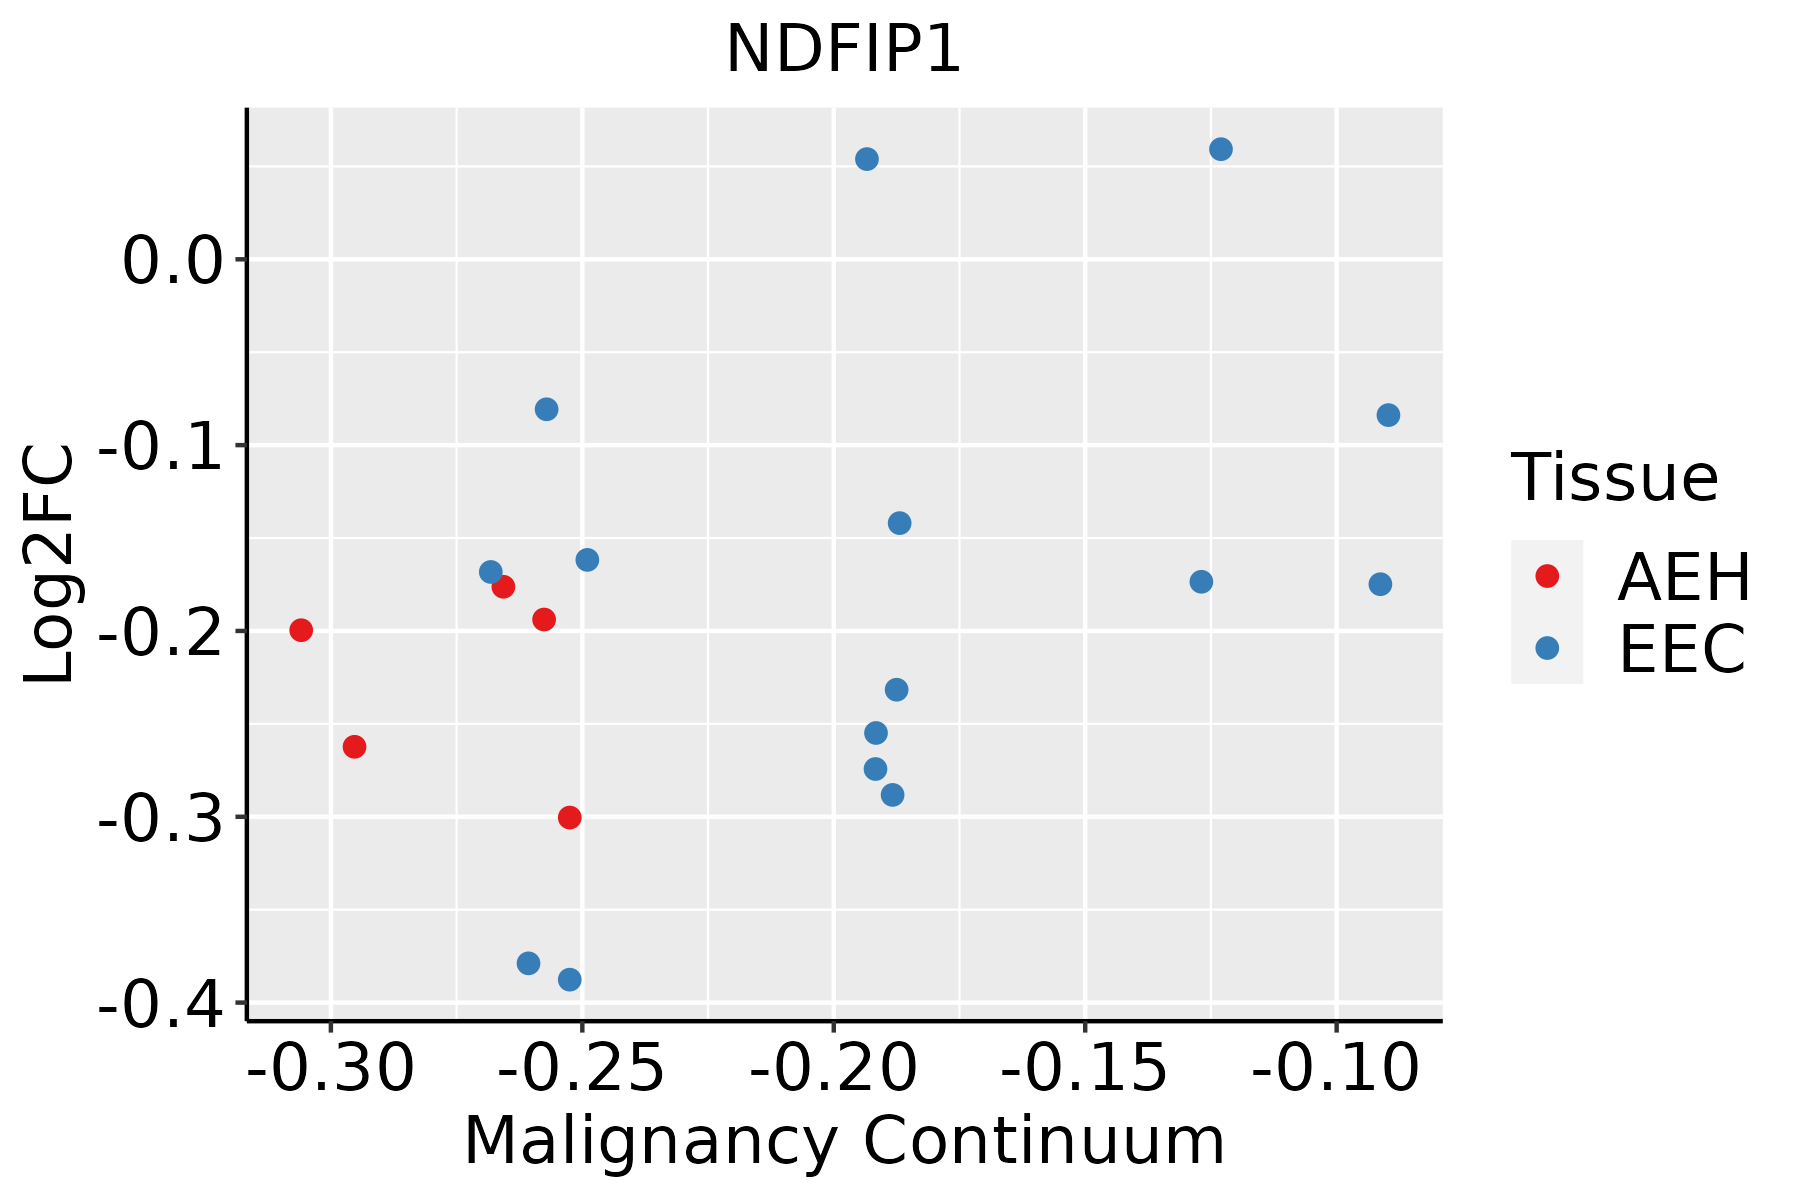 | AEH: Atypical endometrial hyperplasia |
| EEC: Endometrioid Cancer | ||
| Esophagus | 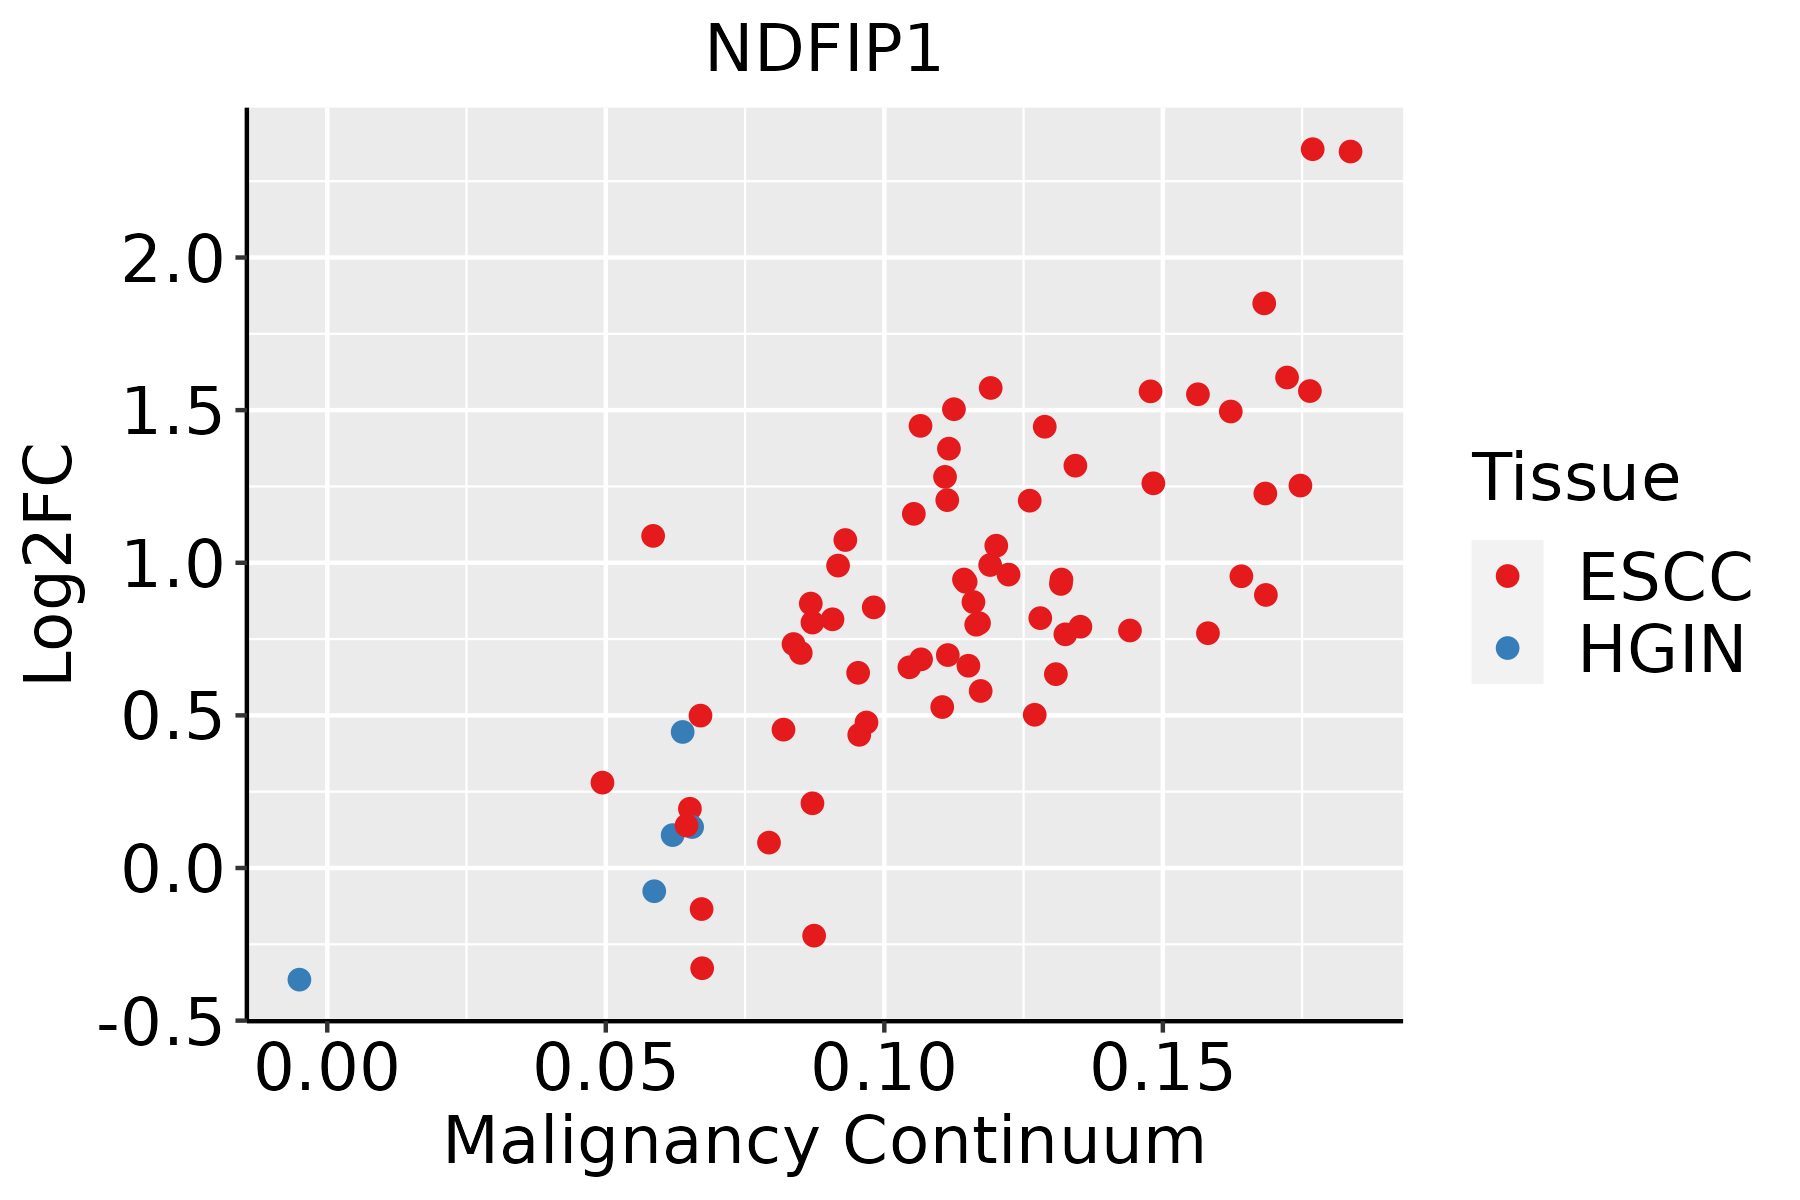 | ESCC: Esophageal squamous cell carcinoma |
| HGIN: High-grade intraepithelial neoplasias | ||
| LGIN: Low-grade intraepithelial neoplasias | ||
| Liver | 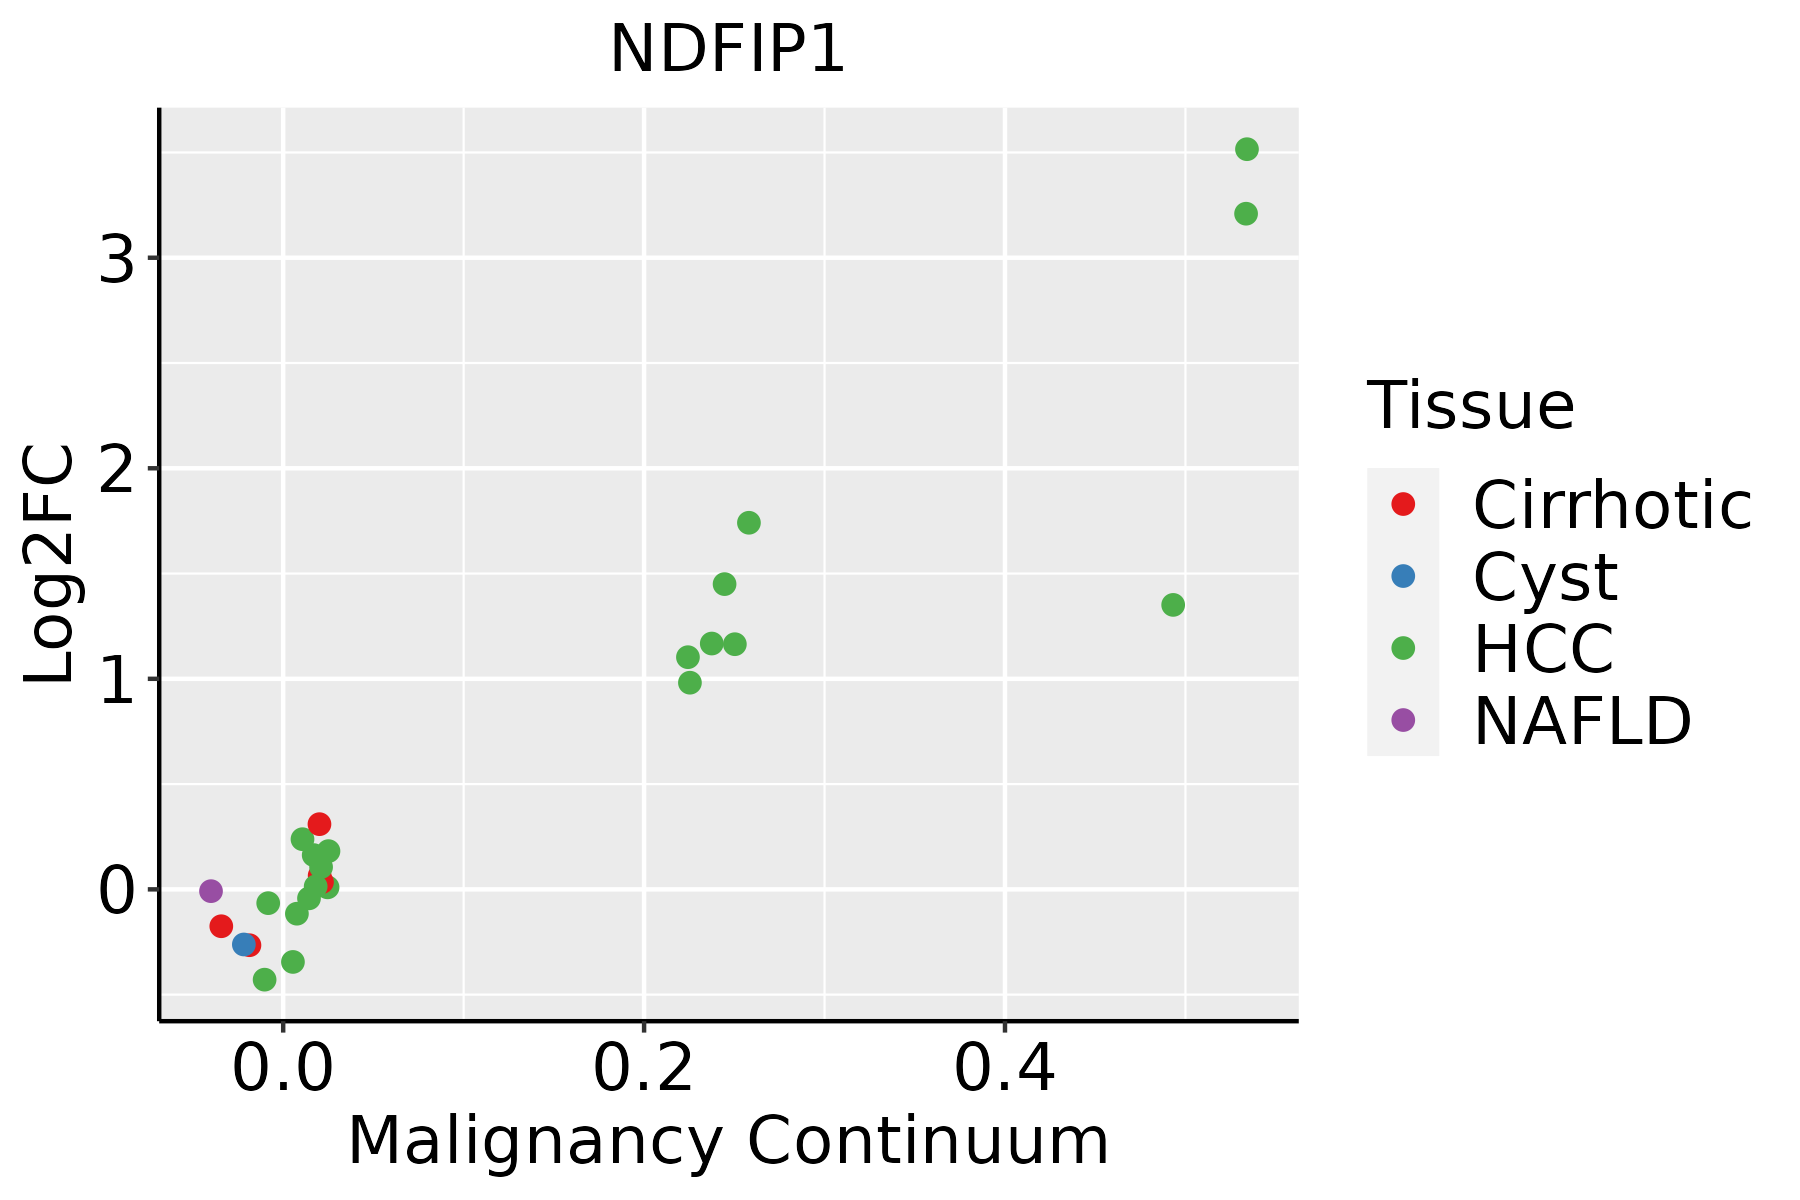 | HCC: Hepatocellular carcinoma |
| NAFLD: Non-alcoholic fatty liver disease | ||
| Oral Cavity |  | EOLP: Erosive Oral lichen planus |
| LP: leukoplakia | ||
| NEOLP: Non-erosive oral lichen planus | ||
| OSCC: Oral squamous cell carcinoma | ||
| Prostate |  | BPH: Benign Prostatic Hyperplasia |
| Skin |  | AK: Actinic keratosis |
| cSCC: Cutaneous squamous cell carcinoma | ||
| SCCIS:squamous cell carcinoma in situ | ||
| Thyroid |  | ATC: Anaplastic thyroid cancer |
| HT: Hashimoto's thyroiditis | ||
| PTC: Papillary thyroid cancer |
| ∗log2FC in expression of this searched gene in stem-like cells from each diseased tissue sample relative to stem-like cells in normal samples in each tissue plotted against the malignancy continuum. Samples are colored based on if they are from different disease stage. |
Top |
Malignant transformation related pathway analysis |
| Find out the enriched GO biological processes and KEGG pathways involved in transition from healthy to precancer to cancer |
| Tissue | Disease Stage | Enriched GO biological Processes |
| Colorectum | AD |  |
| Colorectum | SER |  |
| Colorectum | MSS |  |
| Colorectum | MSI-H |  |
| Colorectum | FAP |  |
| ∗Top 15 enriched GO BP terms are showed in the bar plot of each disease state in each tissue. Each row represents a significant GO biological process which is colored according to the -log10(p.adjust). |
| Page: 1 2 3 4 5 6 7 8 9 |
| GO ID | Tissue | Disease Stage | Description | Gene Ratio | Bg Ratio | pvalue | p.adjust | Count |
| GO:0042176 | Colorectum | AD | regulation of protein catabolic process | 160/3918 | 391/18723 | 1.06e-19 | 7.34e-17 | 160 |
| GO:0009896 | Colorectum | AD | positive regulation of catabolic process | 180/3918 | 492/18723 | 4.33e-16 | 1.94e-13 | 180 |
| GO:0045732 | Colorectum | AD | positive regulation of protein catabolic process | 92/3918 | 231/18723 | 3.85e-11 | 4.47e-09 | 92 |
| GO:1903320 | Colorectum | AD | regulation of protein modification by small protein conjugation or removal | 86/3918 | 242/18723 | 9.43e-08 | 4.65e-06 | 86 |
| GO:0051052 | Colorectum | AD | regulation of DNA metabolic process | 116/3918 | 359/18723 | 2.47e-07 | 1.00e-05 | 116 |
| GO:0007034 | Colorectum | AD | vacuolar transport | 60/3918 | 157/18723 | 4.97e-07 | 1.85e-05 | 60 |
| GO:0030099 | Colorectum | AD | myeloid cell differentiation | 119/3918 | 381/18723 | 1.24e-06 | 4.01e-05 | 119 |
| GO:0055076 | Colorectum | AD | transition metal ion homeostasis | 53/3918 | 138/18723 | 1.89e-06 | 5.65e-05 | 53 |
| GO:0031396 | Colorectum | AD | regulation of protein ubiquitination | 72/3918 | 210/18723 | 4.50e-06 | 1.21e-04 | 72 |
| GO:0046916 | Colorectum | AD | cellular transition metal ion homeostasis | 43/3918 | 115/18723 | 3.62e-05 | 6.56e-04 | 43 |
| GO:0043123 | Colorectum | AD | positive regulation of I-kappaB kinase/NF-kappaB signaling | 60/3918 | 186/18723 | 1.91e-04 | 2.56e-03 | 60 |
| GO:0043122 | Colorectum | AD | regulation of I-kappaB kinase/NF-kappaB signaling | 76/3918 | 249/18723 | 2.17e-04 | 2.85e-03 | 76 |
| GO:0055072 | Colorectum | AD | iron ion homeostasis | 32/3918 | 85/18723 | 2.97e-04 | 3.60e-03 | 32 |
| GO:0007249 | Colorectum | AD | I-kappaB kinase/NF-kappaB signaling | 82/3918 | 281/18723 | 6.09e-04 | 6.40e-03 | 82 |
| GO:0006879 | Colorectum | AD | cellular iron ion homeostasis | 25/3918 | 67/18723 | 1.51e-03 | 1.27e-02 | 25 |
| GO:1903706 | Colorectum | AD | regulation of hemopoiesis | 99/3918 | 367/18723 | 3.08e-03 | 2.28e-02 | 99 |
| GO:0045637 | Colorectum | AD | regulation of myeloid cell differentiation | 61/3918 | 210/18723 | 3.17e-03 | 2.35e-02 | 61 |
| GO:0002573 | Colorectum | AD | myeloid leukocyte differentiation | 60/3918 | 208/18723 | 4.03e-03 | 2.81e-02 | 60 |
| GO:00421762 | Colorectum | MSS | regulation of protein catabolic process | 145/3467 | 391/18723 | 2.03e-18 | 1.17e-15 | 145 |
| GO:00098962 | Colorectum | MSS | positive regulation of catabolic process | 163/3467 | 492/18723 | 3.10e-15 | 9.22e-13 | 163 |
| Page: 1 2 3 4 5 6 7 8 9 10 11 12 13 14 15 16 17 18 19 20 21 22 23 24 25 26 27 28 29 30 |
| Pathway ID | Tissue | Disease Stage | Description | Gene Ratio | Bg Ratio | pvalue | p.adjust | qvalue | Count |
| Page: 1 |
Top |
Cell-cell communication analysis |
| Identification of potential cell-cell interactions between two cell types and their ligand-receptor pairs for different disease states |
| Ligand | Receptor | LRpair | Pathway | Tissue | Disease Stage |
| Page: 1 |
Top |
Single-cell gene regulatory network inference analysis |
| Find out the significant the regulons (TFs) and the target genes of each regulon across cell types for different disease states |
| TF | Cell Type | Tissue | Disease Stage | Target Gene | RSS | Regulon Activity |
| ∗The dot plots of a searched regulon are shown for all cell subpopulations in each disease state of each tissue based on the regulon specific score inferred using pySCENIC and by calculating the average expression. |
| Page: 1 |
Top |
Somatic mutation of malignant transformation related genes |
| Annotation of somatic variants for genes involved in malignant transformation |
| Hugo Symbol | Variant Class | Variant Classification | dbSNP RS | HGVSc | HGVSp | HGVSp Short | SWISSPROT | BIOTYPE | SIFT | PolyPhen | Tumor Sample Barcode | Tissue | Histology | Sex | Age | Stage | Therapy Types | Drugs | Outcome |
| NDFIP1 | insertion | Frame_Shift_Ins | novel | c.521_522insGCCAAAAC | p.Phe174LeufsTer17 | p.F174Lfs*17 | Q9BT67 | protein_coding | TCGA-A2-A0CU-01 | Breast | breast invasive carcinoma | Female | >=65 | I/II | Hormone Therapy | tamoxiphen | SD | ||
| NDFIP1 | SNV | Missense_Mutation | novel | c.343N>T | p.Asp115Tyr | p.D115Y | Q9BT67 | protein_coding | deleterious(0) | probably_damaging(0.995) | TCGA-AA-A00N-01 | Colorectum | colon adenocarcinoma | Male | >=65 | I/II | Unknown | Unknown | PD |
| NDFIP1 | SNV | Missense_Mutation | c.292N>G | p.Phe98Val | p.F98V | Q9BT67 | protein_coding | tolerated(0.19) | possibly_damaging(0.572) | TCGA-AG-3892-01 | Colorectum | rectum adenocarcinoma | Female | <65 | I/II | Unknown | Unknown | SD | |
| NDFIP1 | SNV | Missense_Mutation | c.607N>T | p.Arg203Trp | p.R203W | Q9BT67 | protein_coding | deleterious(0) | probably_damaging(0.998) | TCGA-F5-6814-01 | Colorectum | rectum adenocarcinoma | Male | <65 | I/II | Unknown | Unknown | SD | |
| NDFIP1 | insertion | Frame_Shift_Ins | novel | c.368dupT | p.Met124HisfsTer6 | p.M124Hfs*6 | Q9BT67 | protein_coding | TCGA-AA-3710-01 | Colorectum | colon adenocarcinoma | Female | >=65 | I/II | Unknown | Unknown | SD | ||
| NDFIP1 | insertion | Frame_Shift_Ins | novel | c.194dupC | p.Ser66IlefsTer12 | p.S66Ifs*12 | Q9BT67 | protein_coding | TCGA-D5-6540-01 | Colorectum | colon adenocarcinoma | Male | >=65 | I/II | Unknown | Unknown | SD | ||
| NDFIP1 | SNV | Missense_Mutation | novel | c.627N>A | p.Phe209Leu | p.F209L | Q9BT67 | protein_coding | tolerated(0.65) | benign(0.007) | TCGA-A5-A0G2-01 | Endometrium | uterine corpus endometrioid carcinoma | Female | <65 | III/IV | Unknown | Unknown | SD |
| NDFIP1 | SNV | Missense_Mutation | novel | c.288N>T | p.Glu96Asp | p.E96D | Q9BT67 | protein_coding | tolerated(0.49) | benign(0.007) | TCGA-AX-A1CE-01 | Endometrium | uterine corpus endometrioid carcinoma | Female | <65 | I/II | Unspecific | Paclitaxel | SD |
| NDFIP1 | SNV | Missense_Mutation | novel | c.214N>G | p.Thr72Ala | p.T72A | Q9BT67 | protein_coding | deleterious(0.05) | benign(0.277) | TCGA-B5-A1MR-01 | Endometrium | uterine corpus endometrioid carcinoma | Female | >=65 | III/IV | Unknown | Unknown | SD |
| NDFIP1 | SNV | Missense_Mutation | c.644N>A | p.Thr215Asn | p.T215N | Q9BT67 | protein_coding | deleterious(0.01) | probably_damaging(0.998) | TCGA-BS-A0UV-01 | Endometrium | uterine corpus endometrioid carcinoma | Female | <65 | III/IV | Unknown | Unknown | SD |
| Page: 1 2 |
Top |
Related drugs of malignant transformation related genes |
| Identification of chemicals and drugs interact with genes involved in malignant transfromation |
| (DGIdb 4.0) |
| Entrez ID | Symbol | Category | Interaction Types | Drug Claim Name | Drug Name | PMIDs |
| Page: 1 |

Copyright 2023-Present -The University of Texas Health Science Center at Houston |