Schematic overview of the cellular and molecular mechanisms involved in the cancer progression, including the proposed cellular and molecular mechanisms in cancer cells trajectory. AT1: alveolar type 1 cells; AT2: alveolar type 2 cells; AAH: atypical adenomatous hyperplasia; AIS: adenocarcinoma in situ; MIA: minimally invasive adenocarcinoma; IA: invasive adenocarcinoma; EMT: epithelial-mesenchymal transition

Home

Download

Statistics

Help

Contact

Center for Computational Systems Medicine
leaf

Gene summary

leaf

Malignant transformation analysis

leaf

Malignant transformation related pathway analysis

leaf

Cell-cell communication analysis

leaf

Single-cell gene regulatory network inference analysis

leaf

Somatic mutation of malignant transformation related genes

leaf

Related drugs of malignant transformation related genes

Gene: NDEL1

Gene summary for NDEL1

check button Gene summary.

Gene informationSpeciesHuman
Gene symbol

NDEL1

Gene ID

81565

Gene namenudE neurodevelopment protein 1 like 1
Gene AliasEOPA
Cytomap17p13.1
Gene Typeprotein-coding
GO ID

GO:0000132

UniProtAcc

Q9GZM8


Top

Malignant transformation analysis

check button Identification of the aberrant gene expression in precancerous and cancerous lesions by comparing the gene expression of stem-like cells in diseased tissues with normal stem cells
check button Malignant transformation involving gene list.
Entrez IDSymbolReplicatesSpeciesOrganTissueAdj P-valueLog2FCMalignancy
81565NDEL1LZE4THumanEsophagusESCC7.51e-192.80e-010.0811
81565NDEL1LZE5THumanEsophagusESCC1.56e-043.79e-020.0514
81565NDEL1LZE7THumanEsophagusESCC1.56e-041.41e-010.0667
81565NDEL1LZE8THumanEsophagusESCC1.57e-06-4.17e-020.067
81565NDEL1LZE20THumanEsophagusESCC2.53e-058.31e-030.0662
81565NDEL1LZE24THumanEsophagusESCC4.06e-165.50e-010.0596
81565NDEL1LZE21THumanEsophagusESCC2.99e-032.07e-010.0655
81565NDEL1LZE6THumanEsophagusESCC3.79e-055.39e-020.0845
81565NDEL1P1T-EHumanEsophagusESCC1.19e-064.41e-010.0875
81565NDEL1P2T-EHumanEsophagusESCC3.61e-241.71e-010.1177
81565NDEL1P4T-EHumanEsophagusESCC5.75e-243.82e-010.1323
81565NDEL1P5T-EHumanEsophagusESCC1.81e-06-5.77e-020.1327
81565NDEL1P8T-EHumanEsophagusESCC1.31e-212.43e-010.0889
81565NDEL1P9T-EHumanEsophagusESCC2.34e-132.95e-010.1131
81565NDEL1P10T-EHumanEsophagusESCC3.53e-252.23e-010.116
81565NDEL1P11T-EHumanEsophagusESCC2.19e-124.84e-010.1426
81565NDEL1P12T-EHumanEsophagusESCC2.04e-203.93e-010.1122
81565NDEL1P15T-EHumanEsophagusESCC8.08e-151.19e-010.1149
81565NDEL1P16T-EHumanEsophagusESCC1.01e-172.91e-010.1153
81565NDEL1P19T-EHumanEsophagusESCC3.18e-084.06e-010.1662
Page: 1 2 3 4 5 

check button Transcriptomic changes along malignancy continuum.
TissueExpression DynamicsAbbreviation
EsophagusThe image shows the transcriptomic changes along malignancy continuum.log2FC in expression of this searched gene in stem-like cells from each diseased tissue sample relative to stem-like cells in normal samples in each tissue plotted against the malignancy continuum. Samples are colored based on if they are from different disease stage.
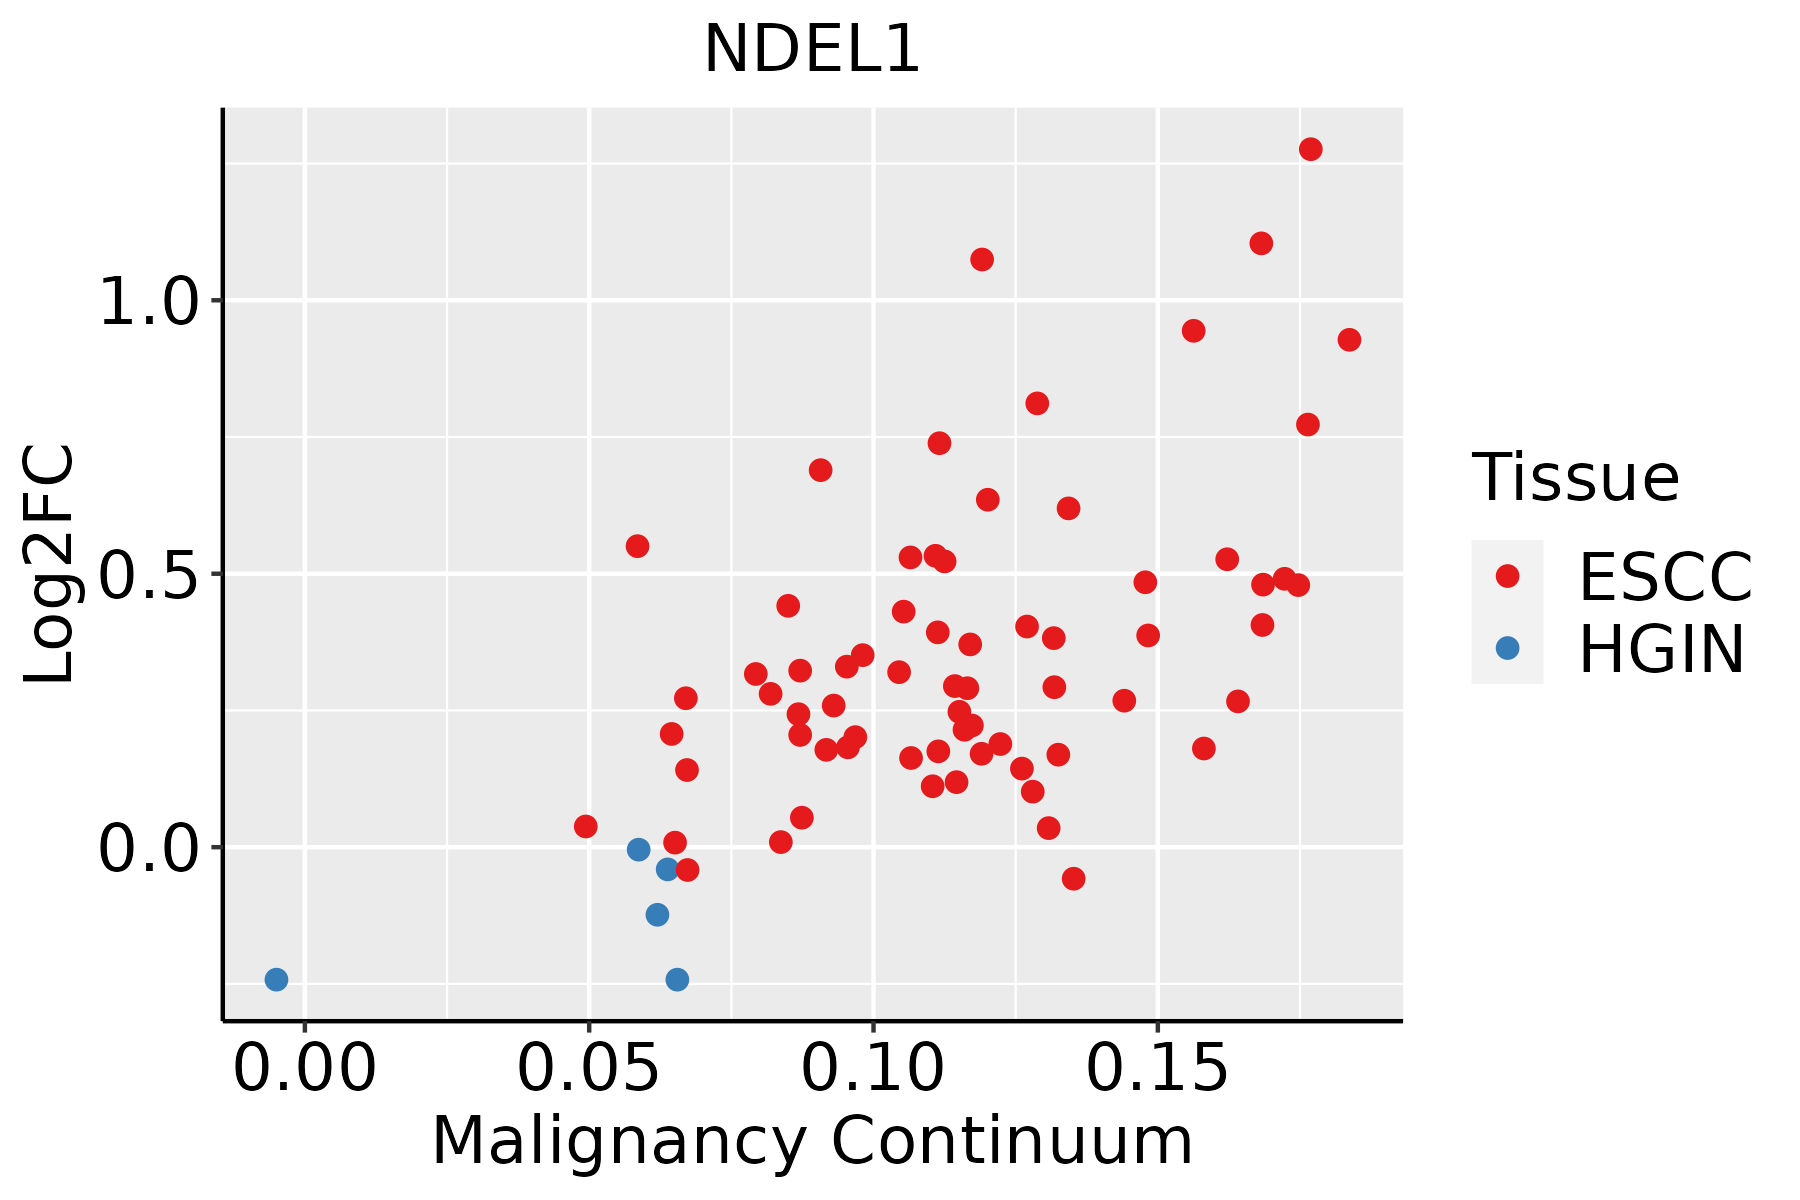
ESCC: Esophageal squamous cell carcinoma
HGIN: High-grade intraepithelial neoplasias
LGIN: Low-grade intraepithelial neoplasias
LungThe image shows the transcriptomic changes along malignancy continuum.log2FC in expression of this searched gene in stem-like cells from each diseased tissue sample relative to stem-like cells in normal samples in each tissue plotted against the malignancy continuum. Samples are colored based on if they are from different disease stage.AAH: Atypical adenomatous hyperplasia
AIS: Adenocarcinoma in situ
IAC: Invasive lung adenocarcinoma
MIA: Minimally invasive adenocarcinoma
Oral CavityThe image shows the transcriptomic changes along malignancy continuum.log2FC in expression of this searched gene in stem-like cells from each diseased tissue sample relative to stem-like cells in normal samples in each tissue plotted against the malignancy continuum. Samples are colored based on if they are from different disease stage.
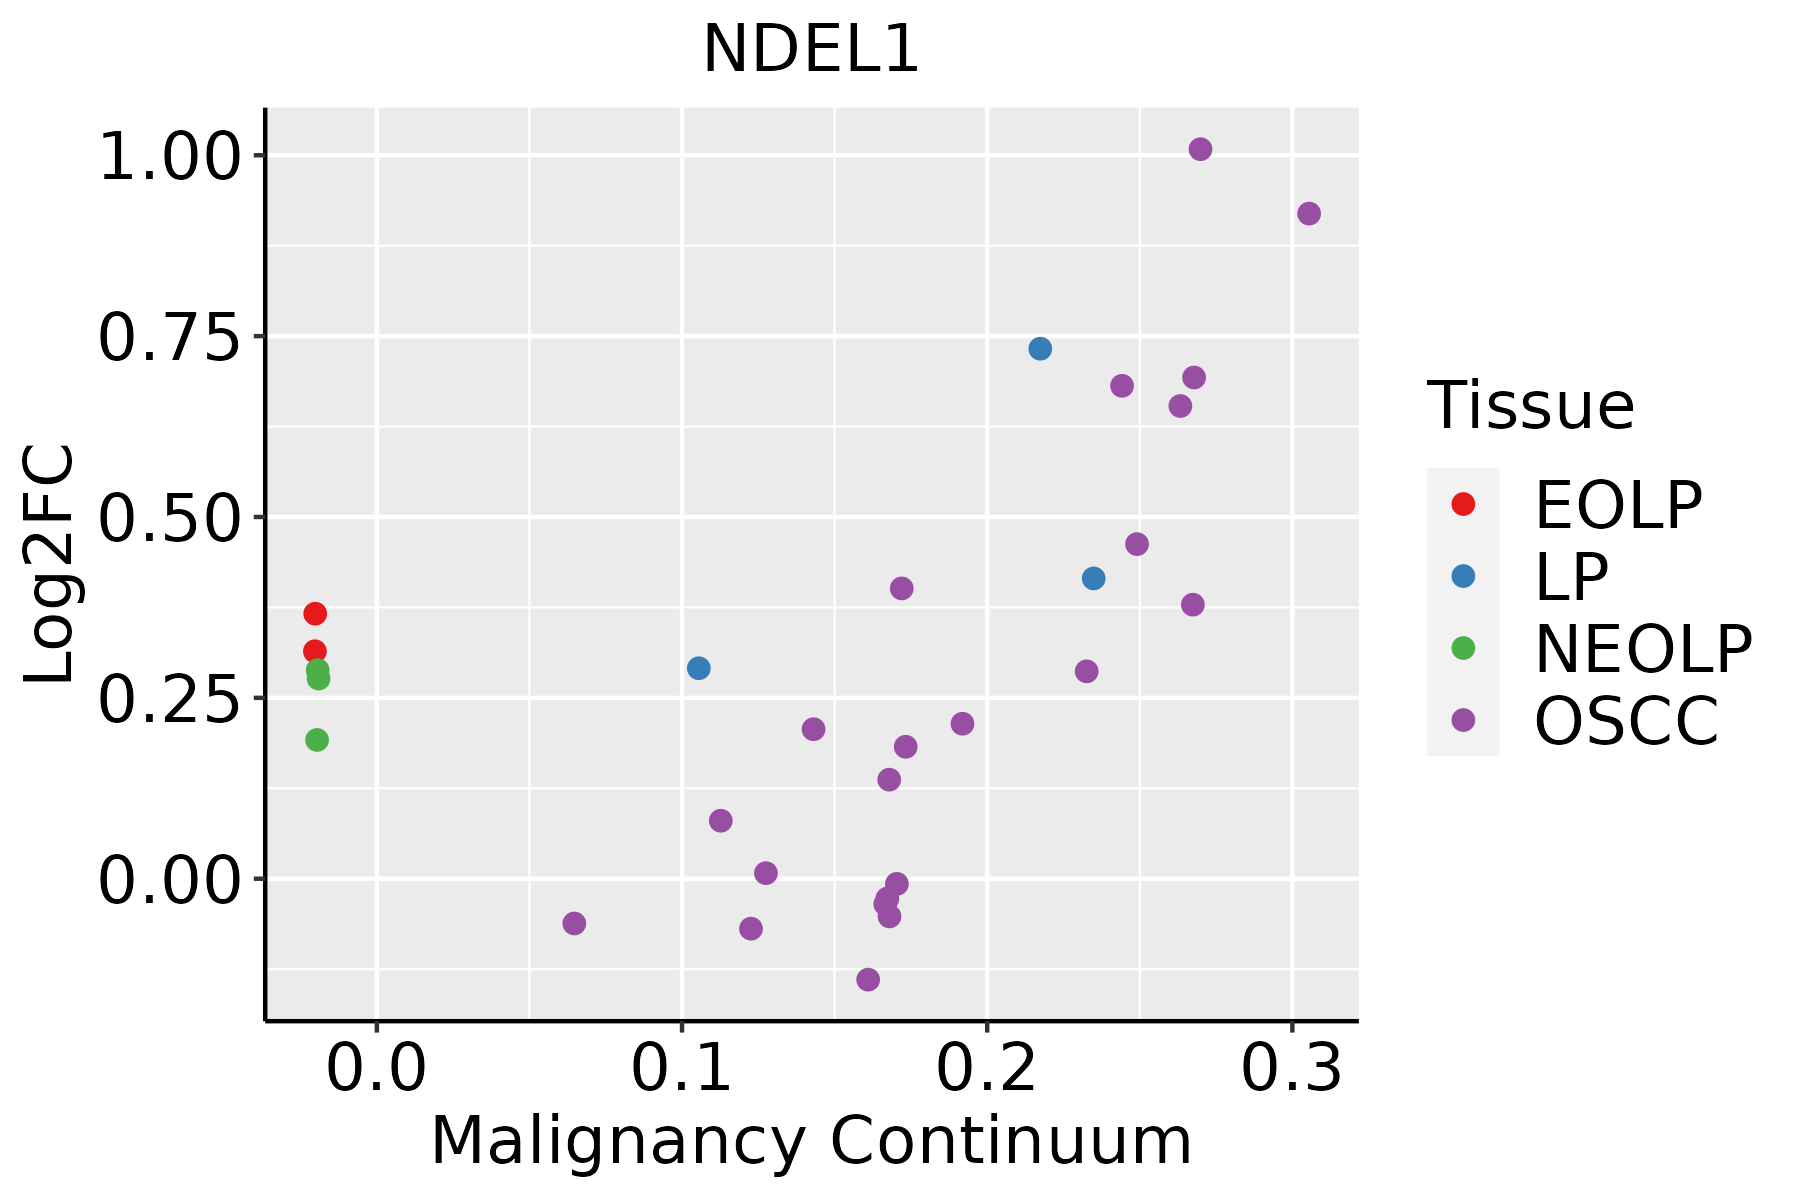
EOLP: Erosive Oral lichen planus
LP: leukoplakia
NEOLP: Non-erosive oral lichen planus
OSCC: Oral squamous cell carcinoma
SkinThe image shows the transcriptomic changes along malignancy continuum.log2FC in expression of this searched gene in stem-like cells from each diseased tissue sample relative to stem-like cells in normal samples in each tissue plotted against the malignancy continuum. Samples are colored based on if they are from different disease stage.
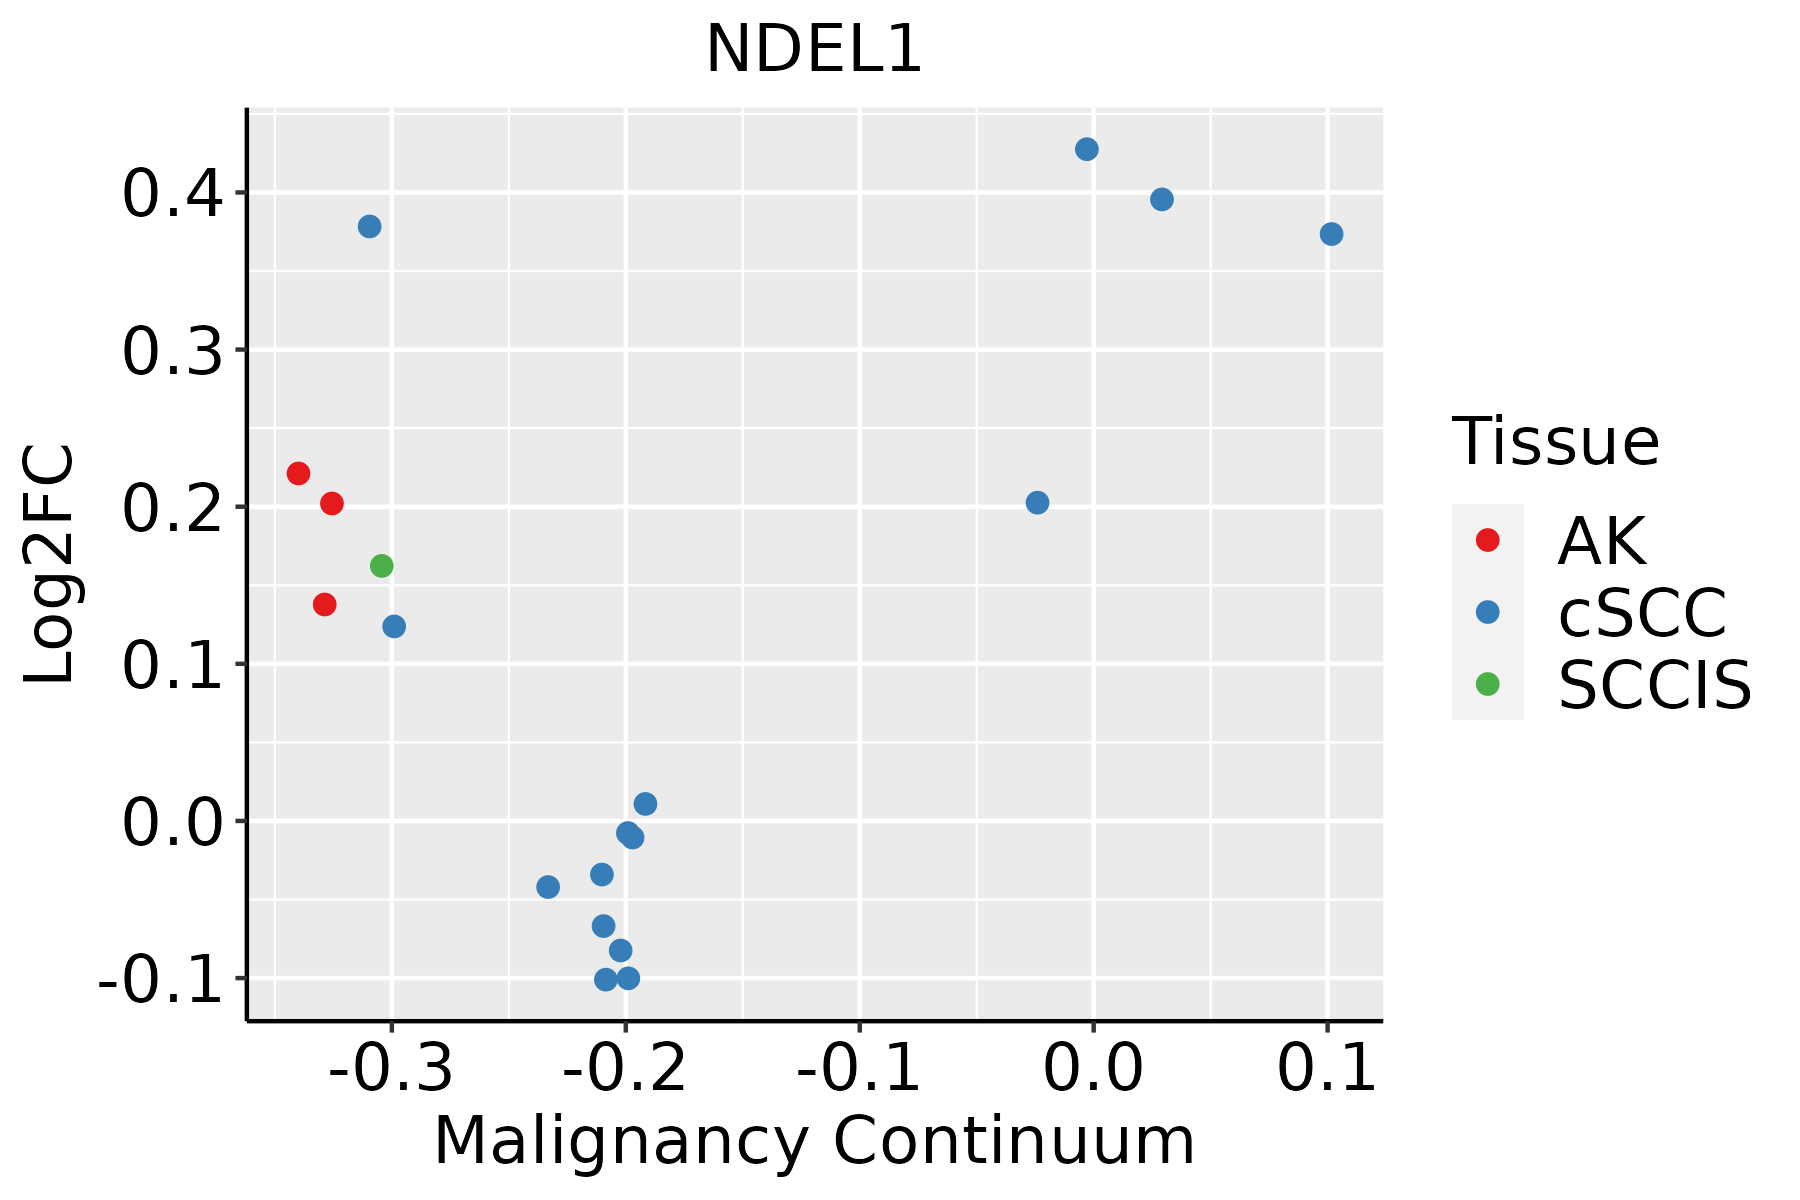
AK: Actinic keratosis
cSCC: Cutaneous squamous cell carcinoma
SCCIS:squamous cell carcinoma in situ
∗log2FC in expression of this searched gene in stem-like cells from each diseased tissue sample relative to stem-like cells in normal samples in each tissue plotted against the malignancy continuum. Samples are colored based on if they are from different disease stage.

Top

Malignant transformation related pathway analysis

check buttonFind out the enriched GO biological processes and KEGG pathways involved in transition from healthy to precancer to cancer
check button Figure of enriched GO biological processes.
TissueDisease StageEnriched GO biological Processes
ColorectumADGO analysis - Figure of enriched GO biological processes: Top 15 enriched GO BP terms are showed in the bar plot of each disease state in each tissue. Each row represents a significant GO biological process which is colored according to the -log10(p.adjust).
ColorectumSERGO analysis - Figure of enriched GO biological processes: Top 15 enriched GO BP terms are showed in the bar plot of each disease state in each tissue. Each row represents a significant GO biological process which is colored according to the -log10(p.adjust).
ColorectumMSSGO analysis - Figure of enriched GO biological processes: Top 15 enriched GO BP terms are showed in the bar plot of each disease state in each tissue. Each row represents a significant GO biological process which is colored according to the -log10(p.adjust).
ColorectumMSI-HGO analysis - Figure of enriched GO biological processes: Top 15 enriched GO BP terms are showed in the bar plot of each disease state in each tissue. Each row represents a significant GO biological process which is colored according to the -log10(p.adjust).
ColorectumFAPGO analysis - Figure of enriched GO biological processes: Top 15 enriched GO BP terms are showed in the bar plot of each disease state in each tissue. Each row represents a significant GO biological process which is colored according to the -log10(p.adjust).
∗Top 15 enriched GO BP terms are showed in the bar plot of each disease state in each tissue. Each row represents a significant GO biological process which is colored according to the -log10(p.adjust).
Page: 1 2 3 4 5 6 7 8 9 

check button Enriched GO biological processes.
GO IDTissueDisease StageDescriptionGene RatioBg Ratiopvaluep.adjustCount
GO:014001414EsophagusESCCmitotic nuclear division218/8552287/187236.17e-261.78e-23218
GO:0022411111EsophagusESCCcellular component disassembly305/8552443/187231.94e-234.57e-21305
GO:003238618EsophagusESCCregulation of intracellular transport243/8552337/187233.20e-237.25e-21243
GO:005165617EsophagusESCCestablishment of organelle localization273/8552390/187239.13e-231.81e-20273
GO:000705911EsophagusESCCchromosome segregation238/8552346/187231.72e-181.82e-16238
GO:0033157110EsophagusESCCregulation of intracellular protein transport169/8552229/187233.31e-183.23e-16169
GO:190285015EsophagusESCCmicrotubule cytoskeleton organization involved in mitosis116/8552147/187231.25e-169.91e-15116
GO:000170119EsophagusESCCin utero embryonic development243/8552367/187231.00e-156.86e-14243
GO:00482853EsophagusESCCorganelle fission301/8552488/187234.64e-132.12e-11301
GO:005130311EsophagusESCCestablishment of chromosome localization67/855280/187231.92e-128.09e-1167
GO:005000011EsophagusESCCchromosome localization68/855282/187233.37e-121.32e-1068
GO:00002802EsophagusESCCnuclear division270/8552439/187231.17e-114.24e-10270
GO:005165016EsophagusESCCestablishment of vesicle localization114/8552161/187238.20e-112.53e-09114
GO:0016049110EsophagusESCCcell growth289/8552482/187231.29e-103.77e-09289
GO:003070518EsophagusESCCcytoskeleton-dependent intracellular transport133/8552195/187231.48e-104.27e-09133
GO:000699713EsophagusESCCnucleus organization96/8552133/187234.66e-101.21e-0896
GO:000716320EsophagusESCCestablishment or maintenance of cell polarity143/8552218/187232.05e-094.65e-08143
GO:000155819EsophagusESCCregulation of cell growth248/8552414/187232.97e-096.45e-08248
GO:001097013EsophagusESCCtransport along microtubule107/8552155/187233.17e-096.80e-08107
GO:005164815EsophagusESCCvesicle localization119/8552177/187235.16e-091.08e-07119
Page: 1 2 3 4 5 6 7 8 9 10 11 12 13 14 15 16 17 18 19 20 21 22 23 24 25 

check button Enriched KEGG pathways.
Pathway IDTissueDisease StageDescriptionGene RatioBg Ratiopvaluep.adjustqvalueCount
Page: 1 

Top

Cell-cell communication analysis

check buttonIdentification of potential cell-cell interactions between two cell types and their ligand-receptor pairs for different disease states
LigandReceptorLRpairPathwayTissueDisease Stage
Page: 1 

Top

Single-cell gene regulatory network inference analysis

check buttonFind out the significant the regulons (TFs) and the target genes of each regulon across cell types for different disease states
TFCell TypeTissueDisease StageTarget GeneRSSRegulon Activity
∗The dot plots of a searched regulon are shown for all cell subpopulations in each disease state of each tissue based on the regulon specific score inferred using pySCENIC and by calculating the average expression.
Page: 1 

Top

Somatic mutation of malignant transformation related genes

check buttonAnnotation of somatic variants for genes involved in malignant transformation
Hugo SymbolVariant ClassVariant ClassificationdbSNP RSHGVScHGVSpHGVSp ShortSWISSPROTBIOTYPESIFTPolyPhenTumor Sample BarcodeTissueHistologySexAgeStageTherapy TypesDrugsOutcome
NDEL1insertionFrame_Shift_Insnovelc.997_998insGp.Pro334SerfsTer16p.P334Sfs*16Q9GZM8protein_codingTCGA-B6-A0IA-01Breastbreast invasive carcinomaFemale<65I/IIUnknownUnknownSD
NDEL1insertionIn_Frame_Insnovelc.999_1000insGTGGCGTGTGCCTGCCTGCAGGCTCTTCTGGATAGCTTGAGCp.Arg333_Pro334insValAlaCysAlaCysLeuGlnAlaLeuLeuAspSerLeuSerp.R333_P334insVACACLQALLDSLSQ9GZM8protein_codingTCGA-B6-A0IA-01Breastbreast invasive carcinomaFemale<65I/IIUnknownUnknownSD
NDEL1SNVMissense_Mutationc.145N>Ap.Ala49Thrp.A49TQ9GZM8protein_codingtolerated(0.05)benign(0.095)TCGA-C5-A7UE-01Cervixcervical & endocervical cancerFemale<65I/IIChemotherapycisplatinSD
NDEL1SNVMissense_Mutationc.601C>Gp.Leu201Valp.L201VQ9GZM8protein_codingtolerated(0.51)benign(0.06)TCGA-IR-A3LL-01Cervixcervical & endocervical cancerFemale<65I/IIChemotherapycisplatinCR
NDEL1SNVMissense_Mutationrs200450931c.628G>Ap.Val210Ilep.V210IQ9GZM8protein_codingtolerated(0.13)benign(0.148)TCGA-VS-A9U6-01Cervixcervical & endocervical cancerFemale<65I/IIChemotherapycisplatinPD
NDEL1SNVMissense_Mutationnovelc.973C>Gp.Pro325Alap.P325AQ9GZM8protein_codingtolerated(0.86)benign(0)TCGA-ZJ-AAXU-01Cervixcervical & endocervical cancerFemale<65I/IIUnknownUnknownSD
NDEL1SNVMissense_Mutationc.824A>Tp.Asn275Ilep.N275IQ9GZM8protein_codingdeleterious(0)possibly_damaging(0.857)TCGA-AA-3715-01Colorectumcolon adenocarcinomaMale>=65I/IIUnknownUnknownPD
NDEL1SNVMissense_Mutationc.446G>Ap.Arg149Glnp.R149QQ9GZM8protein_codingdeleterious(0)probably_damaging(0.995)TCGA-AA-A010-01Colorectumcolon adenocarcinomaFemale<65I/IIChemotherapyfolinicCR
NDEL1SNVMissense_Mutationrs767052065c.848N>Ap.Arg283Glnp.R283QQ9GZM8protein_codingtolerated(0.07)benign(0.366)TCGA-AG-3892-01Colorectumrectum adenocarcinomaFemale<65I/IIUnknownUnknownSD
NDEL1SNVMissense_Mutationnovelc.557N>Tp.Arg186Ilep.R186IQ9GZM8protein_codingdeleterious(0)possibly_damaging(0.589)TCGA-AG-A002-01Colorectumrectum adenocarcinomaMale<65I/IIUnknownUnknownSD
Page: 1 2 3 

Top

Related drugs of malignant transformation related genes

check buttonIdentification of chemicals and drugs interact with genes involved in malignant transfromation
(DGIdb 4.0)
Entrez IDSymbolCategoryInteraction TypesDrug Claim NameDrug NamePMIDs
Page: 1