
|
|||||
|
 | |
| |
| |
| |
| |
| |
|
Gene: NDC80 |
Gene summary for NDC80 |
| Gene information | Species | Human | Gene symbol | NDC80 | Gene ID | 10403 |
| Gene name | NDC80 kinetochore complex component | |
| Gene Alias | HEC | |
| Cytomap | 18p11.32 | |
| Gene Type | protein-coding | GO ID | GO:0000070 | UniProtAcc | A8K031 |
Top |
Malignant transformation analysis |
| Identification of the aberrant gene expression in precancerous and cancerous lesions by comparing the gene expression of stem-like cells in diseased tissues with normal stem cells |
| Entrez ID | Symbol | Replicates | Species | Organ | Tissue | Adj P-value | Log2FC | Malignancy |
| 10403 | NDC80 | LZE2T | Human | Esophagus | ESCC | 4.73e-03 | 7.78e-01 | 0.082 |
| 10403 | NDC80 | LZE6T | Human | Esophagus | ESCC | 3.01e-06 | 2.66e-01 | 0.0845 |
| 10403 | NDC80 | P2T-E | Human | Esophagus | ESCC | 4.44e-08 | 3.34e-01 | 0.1177 |
| 10403 | NDC80 | P4T-E | Human | Esophagus | ESCC | 2.90e-03 | 1.57e-01 | 0.1323 |
| 10403 | NDC80 | P5T-E | Human | Esophagus | ESCC | 1.88e-11 | 3.28e-01 | 0.1327 |
| 10403 | NDC80 | P8T-E | Human | Esophagus | ESCC | 1.66e-02 | 7.85e-02 | 0.0889 |
| 10403 | NDC80 | P9T-E | Human | Esophagus | ESCC | 6.74e-06 | 2.15e-01 | 0.1131 |
| 10403 | NDC80 | P10T-E | Human | Esophagus | ESCC | 3.75e-03 | 1.51e-01 | 0.116 |
| 10403 | NDC80 | P16T-E | Human | Esophagus | ESCC | 3.75e-03 | 7.92e-02 | 0.1153 |
| 10403 | NDC80 | P17T-E | Human | Esophagus | ESCC | 2.68e-03 | 2.69e-01 | 0.1278 |
| 10403 | NDC80 | P19T-E | Human | Esophagus | ESCC | 6.53e-04 | 6.97e-01 | 0.1662 |
| 10403 | NDC80 | P21T-E | Human | Esophagus | ESCC | 3.75e-03 | 1.95e-01 | 0.1617 |
| 10403 | NDC80 | P24T-E | Human | Esophagus | ESCC | 7.90e-03 | 1.33e-01 | 0.1287 |
| 10403 | NDC80 | P28T-E | Human | Esophagus | ESCC | 3.75e-03 | 1.24e-01 | 0.1149 |
| 10403 | NDC80 | P31T-E | Human | Esophagus | ESCC | 4.40e-09 | 4.81e-01 | 0.1251 |
| 10403 | NDC80 | P32T-E | Human | Esophagus | ESCC | 1.88e-11 | 3.38e-01 | 0.1666 |
| 10403 | NDC80 | P36T-E | Human | Esophagus | ESCC | 2.82e-02 | 1.59e-01 | 0.1187 |
| 10403 | NDC80 | P37T-E | Human | Esophagus | ESCC | 1.24e-04 | 1.49e-01 | 0.1371 |
| 10403 | NDC80 | P38T-E | Human | Esophagus | ESCC | 1.30e-06 | 4.23e-01 | 0.127 |
| 10403 | NDC80 | P44T-E | Human | Esophagus | ESCC | 2.47e-02 | 2.07e-01 | 0.1096 |
| Page: 1 2 |
| Tissue | Expression Dynamics | Abbreviation |
| Esophagus | 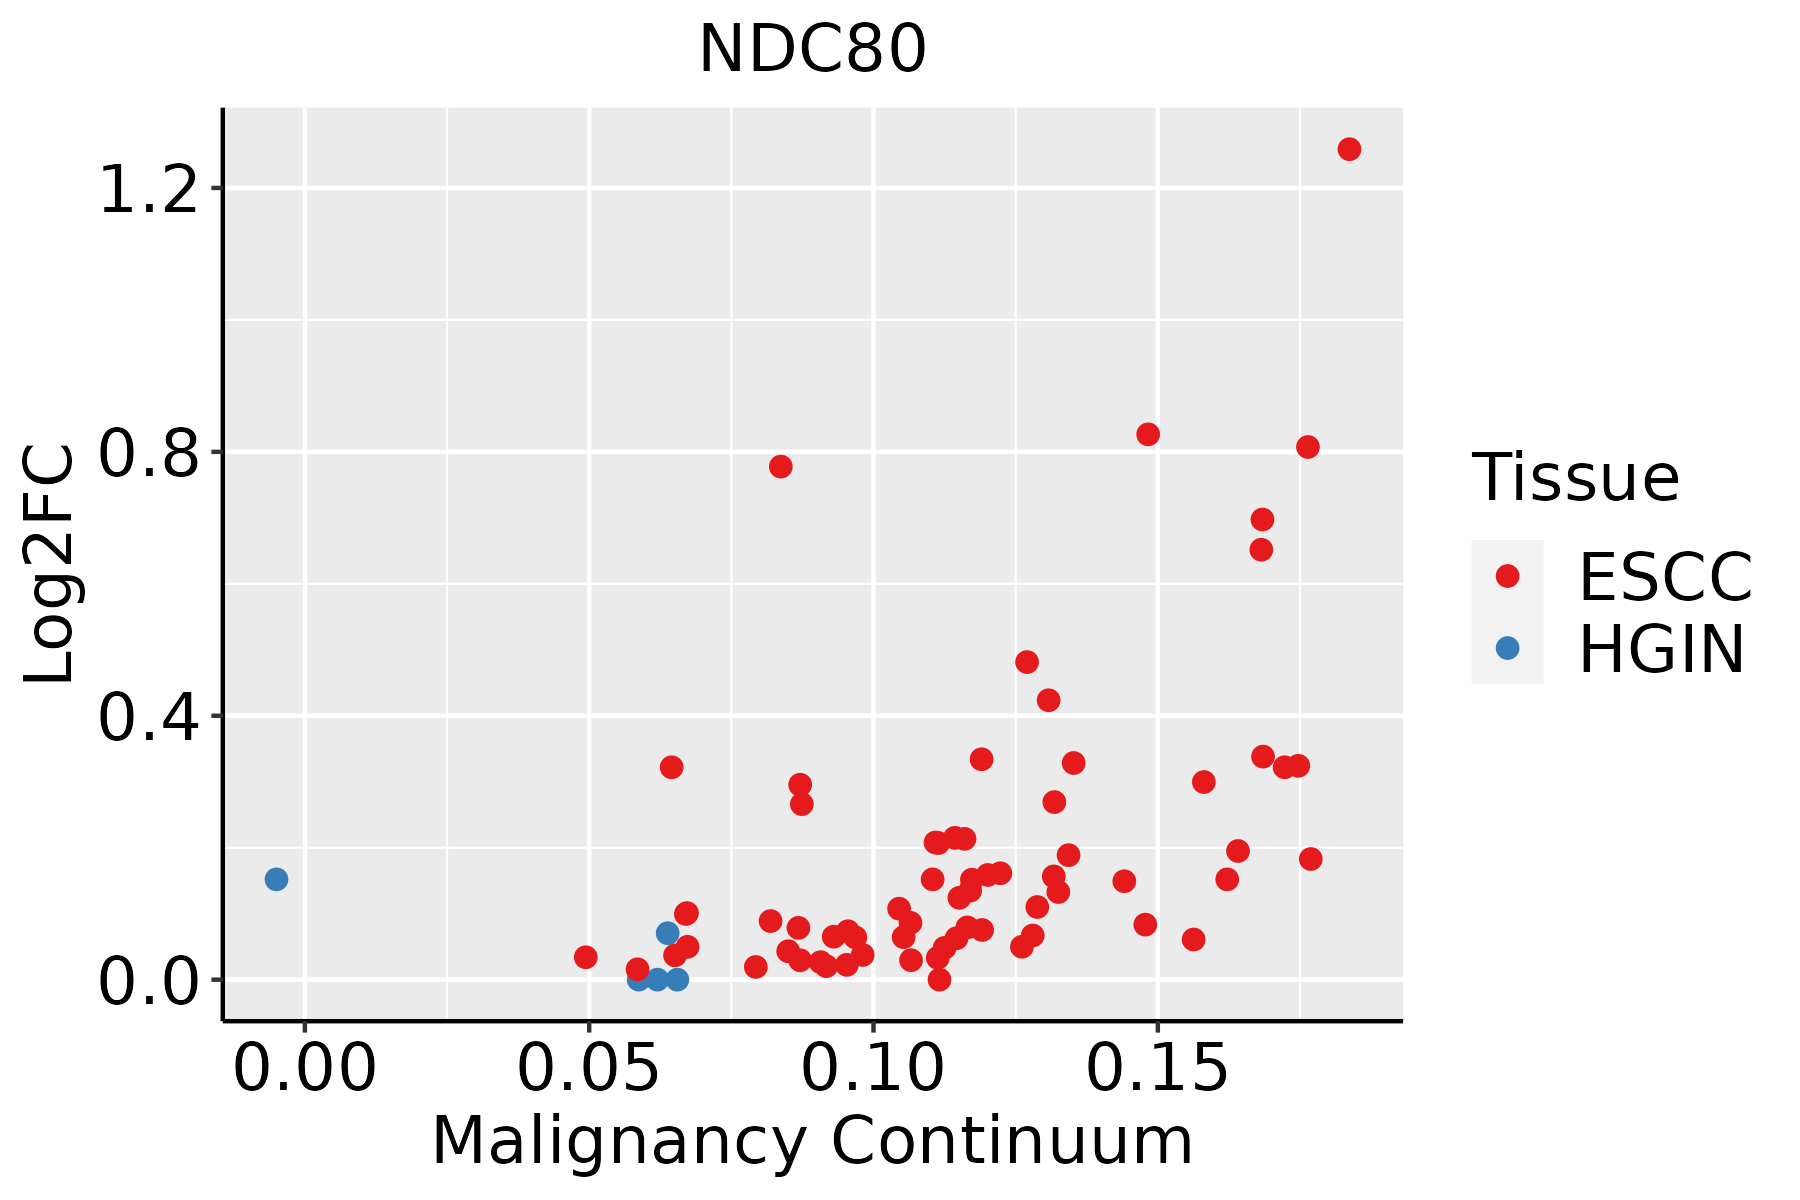 | ESCC: Esophageal squamous cell carcinoma |
| HGIN: High-grade intraepithelial neoplasias | ||
| LGIN: Low-grade intraepithelial neoplasias | ||
| Skin | 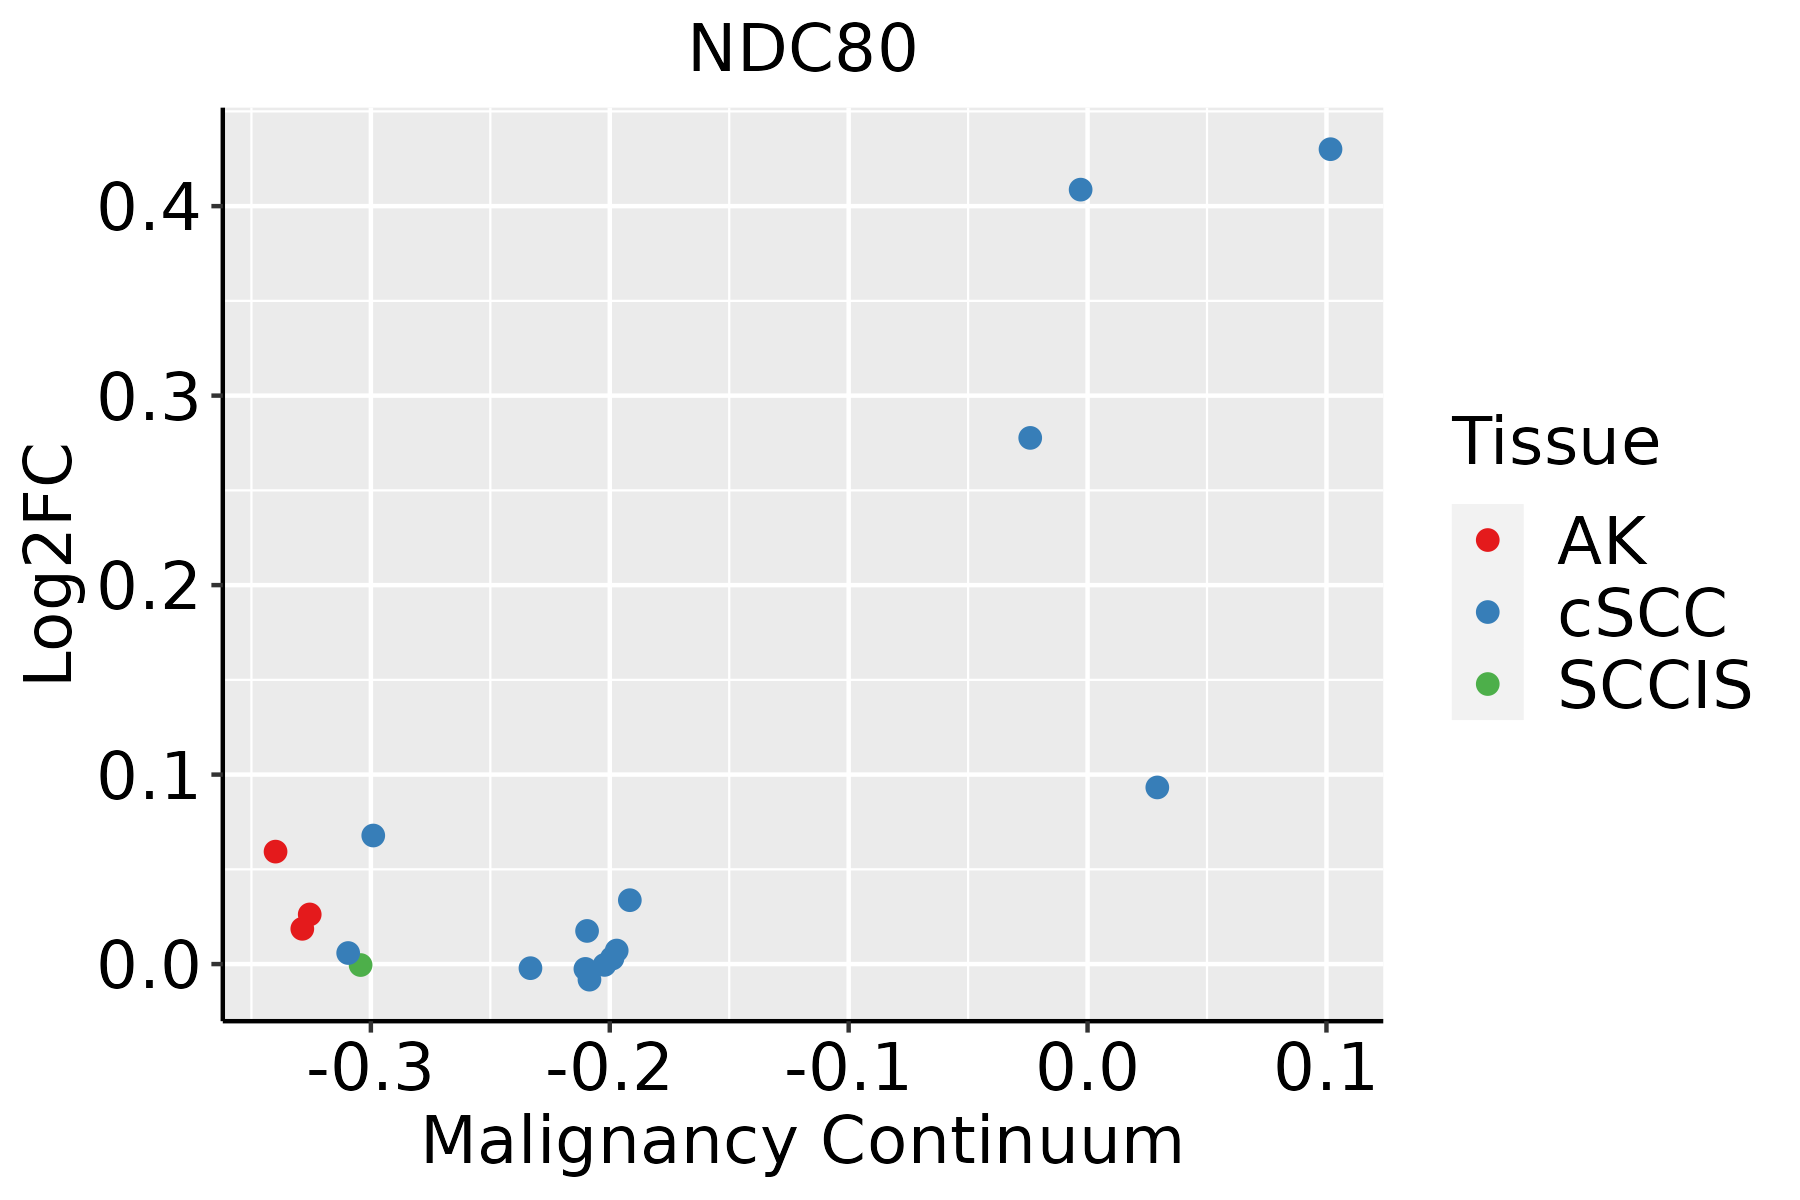 | AK: Actinic keratosis |
| cSCC: Cutaneous squamous cell carcinoma | ||
| SCCIS:squamous cell carcinoma in situ |
| ∗log2FC in expression of this searched gene in stem-like cells from each diseased tissue sample relative to stem-like cells in normal samples in each tissue plotted against the malignancy continuum. Samples are colored based on if they are from different disease stage. |
Top |
Malignant transformation related pathway analysis |
| Find out the enriched GO biological processes and KEGG pathways involved in transition from healthy to precancer to cancer |
| Tissue | Disease Stage | Enriched GO biological Processes |
| Colorectum | AD |  |
| Colorectum | SER |  |
| Colorectum | MSS |  |
| Colorectum | MSI-H |  |
| Colorectum | FAP |  |
| ∗Top 15 enriched GO BP terms are showed in the bar plot of each disease state in each tissue. Each row represents a significant GO biological process which is colored according to the -log10(p.adjust). |
| Page: 1 2 3 4 5 6 7 8 9 |
| GO ID | Tissue | Disease Stage | Description | Gene Ratio | Bg Ratio | pvalue | p.adjust | Count |
| GO:014001414 | Esophagus | ESCC | mitotic nuclear division | 218/8552 | 287/18723 | 6.17e-26 | 1.78e-23 | 218 |
| GO:005165617 | Esophagus | ESCC | establishment of organelle localization | 273/8552 | 390/18723 | 9.13e-23 | 1.81e-20 | 273 |
| GO:000007011 | Esophagus | ESCC | mitotic sister chromatid segregation | 138/8552 | 168/18723 | 1.37e-22 | 2.63e-20 | 138 |
| GO:00008194 | Esophagus | ESCC | sister chromatid segregation | 157/8552 | 202/18723 | 8.41e-21 | 1.33e-18 | 157 |
| GO:1903829111 | Esophagus | ESCC | positive regulation of cellular protein localization | 199/8552 | 276/18723 | 2.99e-19 | 3.45e-17 | 199 |
| GO:003304416 | Esophagus | ESCC | regulation of chromosome organization | 145/8552 | 187/18723 | 3.80e-19 | 4.31e-17 | 145 |
| GO:000705911 | Esophagus | ESCC | chromosome segregation | 238/8552 | 346/18723 | 1.72e-18 | 1.82e-16 | 238 |
| GO:004477216 | Esophagus | ESCC | mitotic cell cycle phase transition | 281/8552 | 424/18723 | 4.63e-18 | 4.45e-16 | 281 |
| GO:190285015 | Esophagus | ESCC | microtubule cytoskeleton organization involved in mitosis | 116/8552 | 147/18723 | 1.25e-16 | 9.91e-15 | 116 |
| GO:000734615 | Esophagus | ESCC | regulation of mitotic cell cycle | 293/8552 | 457/18723 | 8.00e-16 | 5.64e-14 | 293 |
| GO:000705214 | Esophagus | ESCC | mitotic spindle organization | 97/8552 | 120/18723 | 2.17e-15 | 1.33e-13 | 97 |
| GO:000705114 | Esophagus | ESCC | spindle organization | 134/8552 | 184/18723 | 5.70e-14 | 2.87e-12 | 134 |
| GO:005131011 | Esophagus | ESCC | metaphase plate congression | 58/8552 | 65/18723 | 1.81e-13 | 8.63e-12 | 58 |
| GO:000708011 | Esophagus | ESCC | mitotic metaphase plate congression | 47/8552 | 50/18723 | 3.15e-13 | 1.47e-11 | 47 |
| GO:00482853 | Esophagus | ESCC | organelle fission | 301/8552 | 488/18723 | 4.64e-13 | 2.12e-11 | 301 |
| GO:00988133 | Esophagus | ESCC | nuclear chromosome segregation | 187/8552 | 281/18723 | 1.00e-12 | 4.36e-11 | 187 |
| GO:005130311 | Esophagus | ESCC | establishment of chromosome localization | 67/8552 | 80/18723 | 1.92e-12 | 8.09e-11 | 67 |
| GO:005000011 | Esophagus | ESCC | chromosome localization | 68/8552 | 82/18723 | 3.37e-12 | 1.32e-10 | 68 |
| GO:00002802 | Esophagus | ESCC | nuclear division | 270/8552 | 439/18723 | 1.17e-11 | 4.24e-10 | 270 |
| GO:190198713 | Esophagus | ESCC | regulation of cell cycle phase transition | 242/8552 | 390/18723 | 3.86e-11 | 1.26e-09 | 242 |
| Page: 1 2 3 4 5 6 7 8 |
| Pathway ID | Tissue | Disease Stage | Description | Gene Ratio | Bg Ratio | pvalue | p.adjust | qvalue | Count |
| hsa0411023 | Esophagus | ESCC | Cell cycle | 126/4205 | 157/8465 | 1.34e-15 | 5.60e-14 | 2.87e-14 | 126 |
| hsa0411033 | Esophagus | ESCC | Cell cycle | 126/4205 | 157/8465 | 1.34e-15 | 5.60e-14 | 2.87e-14 | 126 |
| Page: 1 |
Top |
Cell-cell communication analysis |
| Identification of potential cell-cell interactions between two cell types and their ligand-receptor pairs for different disease states |
| Ligand | Receptor | LRpair | Pathway | Tissue | Disease Stage |
| Page: 1 |
Top |
Single-cell gene regulatory network inference analysis |
| Find out the significant the regulons (TFs) and the target genes of each regulon across cell types for different disease states |
| TF | Cell Type | Tissue | Disease Stage | Target Gene | RSS | Regulon Activity |
| ∗The dot plots of a searched regulon are shown for all cell subpopulations in each disease state of each tissue based on the regulon specific score inferred using pySCENIC and by calculating the average expression. |
| Page: 1 |
Top |
Somatic mutation of malignant transformation related genes |
| Annotation of somatic variants for genes involved in malignant transformation |
| Hugo Symbol | Variant Class | Variant Classification | dbSNP RS | HGVSc | HGVSp | HGVSp Short | SWISSPROT | BIOTYPE | SIFT | PolyPhen | Tumor Sample Barcode | Tissue | Histology | Sex | Age | Stage | Therapy Types | Drugs | Outcome |
| NDC80 | SNV | Missense_Mutation | rs757978175 | c.1259G>A | p.Arg420Lys | p.R420K | O14777 | protein_coding | deleterious(0.01) | probably_damaging(0.994) | TCGA-A2-A1G4-01 | Breast | breast invasive carcinoma | Female | >=65 | III/IV | Chemotherapy | adriamycin | SD |
| NDC80 | SNV | Missense_Mutation | c.1099G>A | p.Glu367Lys | p.E367K | O14777 | protein_coding | deleterious(0.04) | possibly_damaging(0.566) | TCGA-A7-A56D-01 | Breast | breast invasive carcinoma | Female | >=65 | I/II | Hormone Therapy | arimidex | SD | |
| NDC80 | SNV | Missense_Mutation | rs772239068 | c.551C>G | p.Ala184Gly | p.A184G | O14777 | protein_coding | deleterious(0.03) | benign(0.181) | TCGA-A8-A095-01 | Breast | breast invasive carcinoma | Female | <65 | I/II | Chemotherapy | 5-fluorouracil | CR |
| NDC80 | SNV | Missense_Mutation | c.580N>G | p.Ile194Val | p.I194V | O14777 | protein_coding | deleterious(0.03) | benign(0.003) | TCGA-AN-A0FL-01 | Breast | breast invasive carcinoma | Female | <65 | I/II | Unknown | Unknown | SD | |
| NDC80 | SNV | Missense_Mutation | c.1405N>C | p.Glu469Gln | p.E469Q | O14777 | protein_coding | deleterious(0.01) | possibly_damaging(0.878) | TCGA-B6-A0IJ-01 | Breast | breast invasive carcinoma | Female | <65 | I/II | Unknown | Unknown | SD | |
| NDC80 | SNV | Missense_Mutation | novel | c.721N>C | p.Asp241His | p.D241H | O14777 | protein_coding | deleterious(0) | probably_damaging(1) | TCGA-B6-A400-01 | Breast | breast invasive carcinoma | Female | <65 | III/IV | Unknown | Unknown | SD |
| NDC80 | SNV | Missense_Mutation | rs757978175 | c.1259N>A | p.Arg420Lys | p.R420K | O14777 | protein_coding | deleterious(0.01) | probably_damaging(0.994) | TCGA-BH-A1FC-01 | Breast | breast invasive carcinoma | Female | >=65 | I/II | Unknown | Unknown | SD |
| NDC80 | SNV | Missense_Mutation | c.151N>A | p.Glu51Lys | p.E51K | O14777 | protein_coding | deleterious(0) | probably_damaging(0.945) | TCGA-GM-A2D9-01 | Breast | breast invasive carcinoma | Female | >=65 | I/II | Hormone Therapy | arimidex | SD | |
| NDC80 | SNV | Missense_Mutation | c.232N>C | p.Glu78Gln | p.E78Q | O14777 | protein_coding | deleterious(0) | probably_damaging(0.91) | TCGA-C5-A1BK-01 | Cervix | cervical & endocervical cancer | Female | <65 | I/II | Unknown | Unknown | SD | |
| NDC80 | SNV | Missense_Mutation | c.568N>C | p.Asp190His | p.D190H | O14777 | protein_coding | deleterious(0) | probably_damaging(0.99) | TCGA-C5-A1BK-01 | Cervix | cervical & endocervical cancer | Female | <65 | I/II | Unknown | Unknown | SD |
| Page: 1 2 3 4 5 6 7 |
Top |
Related drugs of malignant transformation related genes |
| Identification of chemicals and drugs interact with genes involved in malignant transfromation |
| (DGIdb 4.0) |
| Entrez ID | Symbol | Category | Interaction Types | Drug Claim Name | Drug Name | PMIDs |
| Page: 1 |

Copyright 2023-Present -The University of Texas Health Science Center at Houston |