
|
|||||
|
 | |
| |
| |
| |
| |
| |
|
Gene: NCSTN |
Gene summary for NCSTN |
| Gene information | Species | Human | Gene symbol | NCSTN | Gene ID | 23385 |
| Gene name | nicastrin | |
| Gene Alias | ATAG1874 | |
| Cytomap | 1q23.2 | |
| Gene Type | protein-coding | GO ID | GO:0001775 | UniProtAcc | Q92542 |
Top |
Malignant transformation analysis |
| Identification of the aberrant gene expression in precancerous and cancerous lesions by comparing the gene expression of stem-like cells in diseased tissues with normal stem cells |
| Entrez ID | Symbol | Replicates | Species | Organ | Tissue | Adj P-value | Log2FC | Malignancy |
| 23385 | NCSTN | HTA11_3410_2000001011 | Human | Colorectum | AD | 5.46e-05 | 1.99e-01 | 0.0155 |
| 23385 | NCSTN | HTA11_2487_2000001011 | Human | Colorectum | SER | 1.53e-08 | 4.19e-01 | -0.1808 |
| 23385 | NCSTN | HTA11_2951_2000001011 | Human | Colorectum | AD | 2.93e-02 | 4.21e-01 | 0.0216 |
| 23385 | NCSTN | HTA11_1938_2000001011 | Human | Colorectum | AD | 8.14e-06 | 3.67e-01 | -0.0811 |
| 23385 | NCSTN | HTA11_78_2000001011 | Human | Colorectum | AD | 5.38e-05 | 2.38e-01 | -0.1088 |
| 23385 | NCSTN | HTA11_347_2000001011 | Human | Colorectum | AD | 1.21e-19 | 4.60e-01 | -0.1954 |
| 23385 | NCSTN | HTA11_411_2000001011 | Human | Colorectum | SER | 3.59e-02 | 7.59e-01 | -0.2602 |
| 23385 | NCSTN | HTA11_83_2000001011 | Human | Colorectum | SER | 1.61e-02 | 3.25e-01 | -0.1526 |
| 23385 | NCSTN | HTA11_696_2000001011 | Human | Colorectum | AD | 2.53e-10 | 3.70e-01 | -0.1464 |
| 23385 | NCSTN | HTA11_866_2000001011 | Human | Colorectum | AD | 5.89e-05 | 1.96e-01 | -0.1001 |
| 23385 | NCSTN | HTA11_1391_2000001011 | Human | Colorectum | AD | 2.89e-08 | 4.70e-01 | -0.059 |
| 23385 | NCSTN | HTA11_5212_2000001011 | Human | Colorectum | AD | 5.13e-06 | 4.39e-01 | -0.2061 |
| 23385 | NCSTN | HTA11_5216_2000001011 | Human | Colorectum | SER | 2.03e-02 | 3.21e-01 | -0.1462 |
| 23385 | NCSTN | HTA11_866_3004761011 | Human | Colorectum | AD | 3.81e-06 | 3.41e-01 | 0.096 |
| 23385 | NCSTN | HTA11_8622_2000001021 | Human | Colorectum | SER | 8.19e-03 | 3.99e-01 | 0.0528 |
| 23385 | NCSTN | HTA11_10623_2000001011 | Human | Colorectum | AD | 7.04e-04 | 3.60e-01 | -0.0177 |
| 23385 | NCSTN | HTA11_6801_2000001011 | Human | Colorectum | SER | 8.81e-04 | 4.54e-01 | 0.0171 |
| 23385 | NCSTN | HTA11_10711_2000001011 | Human | Colorectum | AD | 1.89e-02 | 2.60e-01 | 0.0338 |
| 23385 | NCSTN | HTA11_7696_3000711011 | Human | Colorectum | AD | 9.46e-12 | 3.84e-01 | 0.0674 |
| 23385 | NCSTN | HTA11_7469_2000001011 | Human | Colorectum | AD | 4.79e-02 | 5.44e-01 | -0.0124 |
| Page: 1 2 3 4 5 6 7 |
| Tissue | Expression Dynamics | Abbreviation |
| Colorectum (GSE201348) |  | FAP: Familial adenomatous polyposis |
| CRC: Colorectal cancer | ||
| Colorectum (HTA11) |  | AD: Adenomas |
| SER: Sessile serrated lesions | ||
| MSI-H: Microsatellite-high colorectal cancer | ||
| MSS: Microsatellite stable colorectal cancer | ||
| Esophagus | 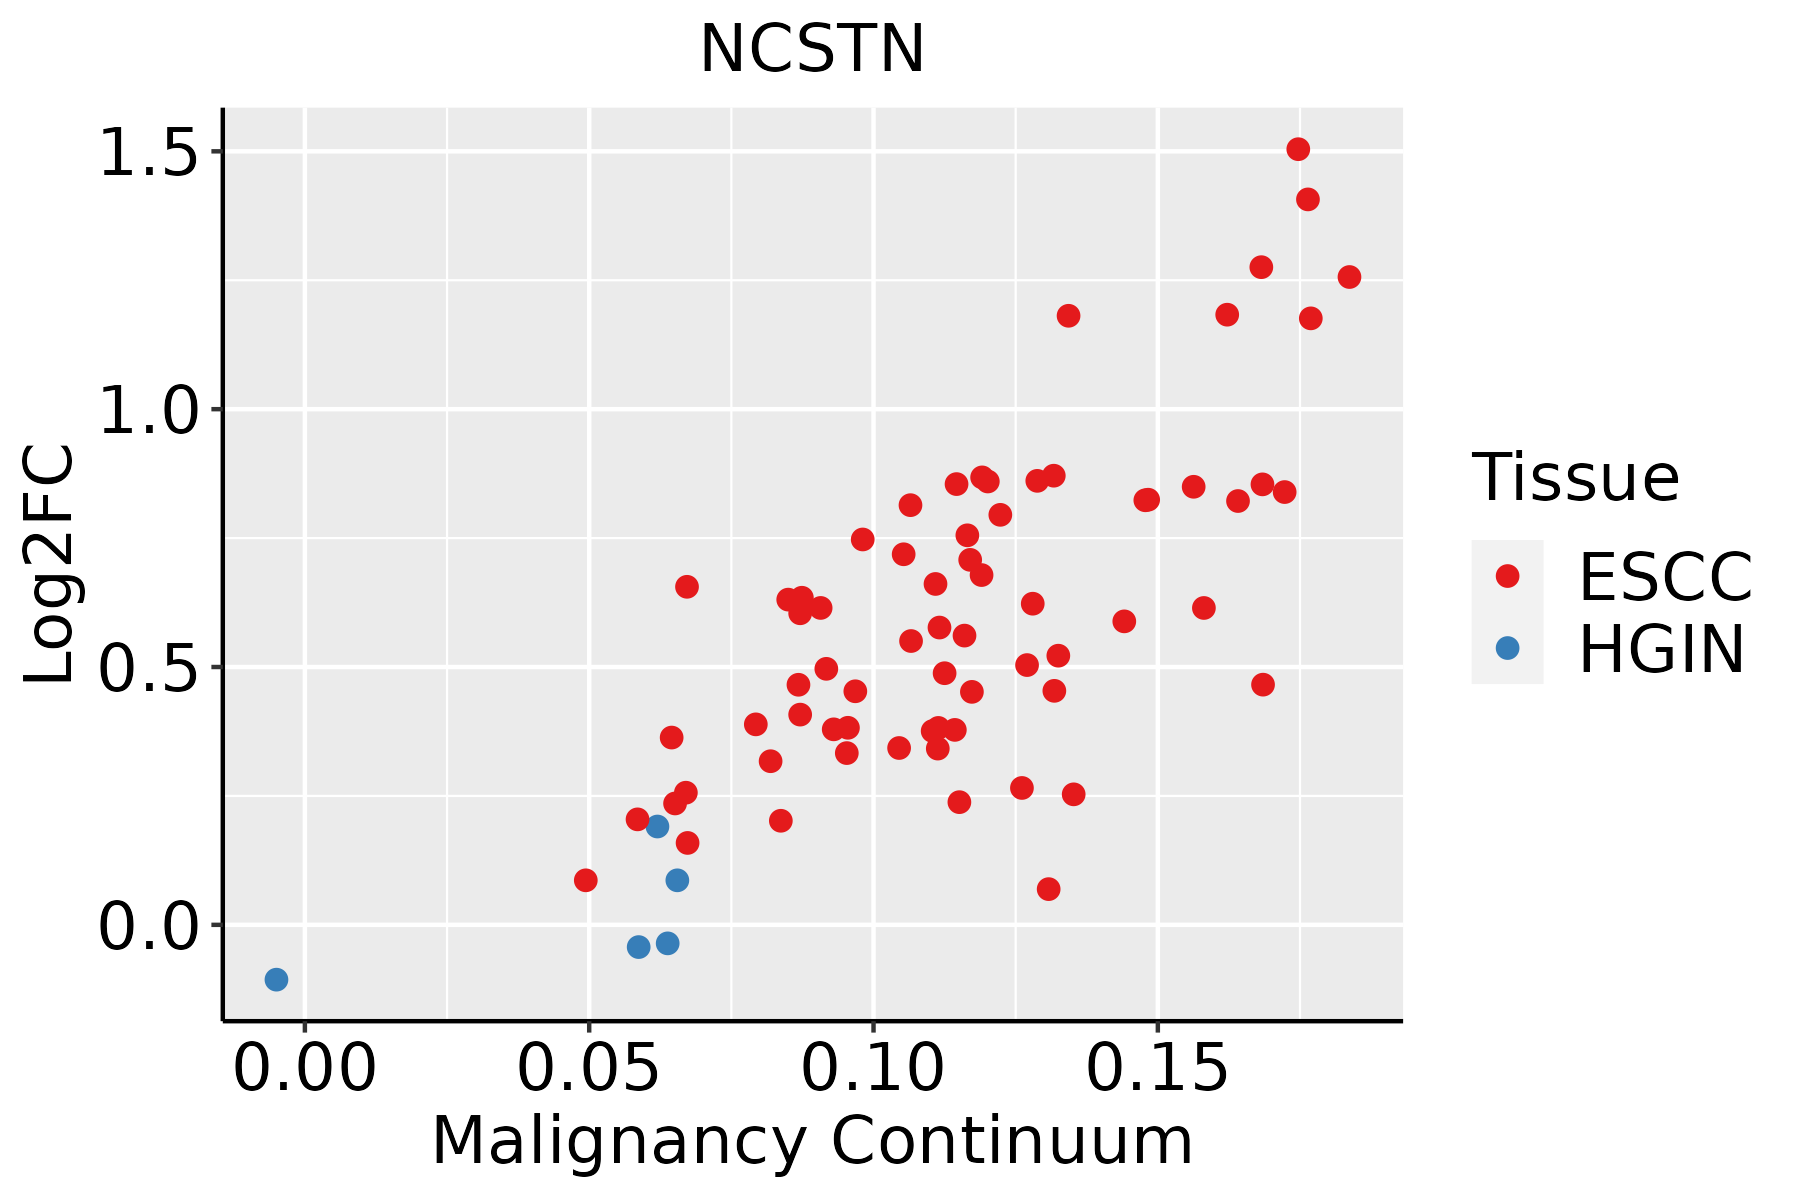 | ESCC: Esophageal squamous cell carcinoma |
| HGIN: High-grade intraepithelial neoplasias | ||
| LGIN: Low-grade intraepithelial neoplasias | ||
| Liver | 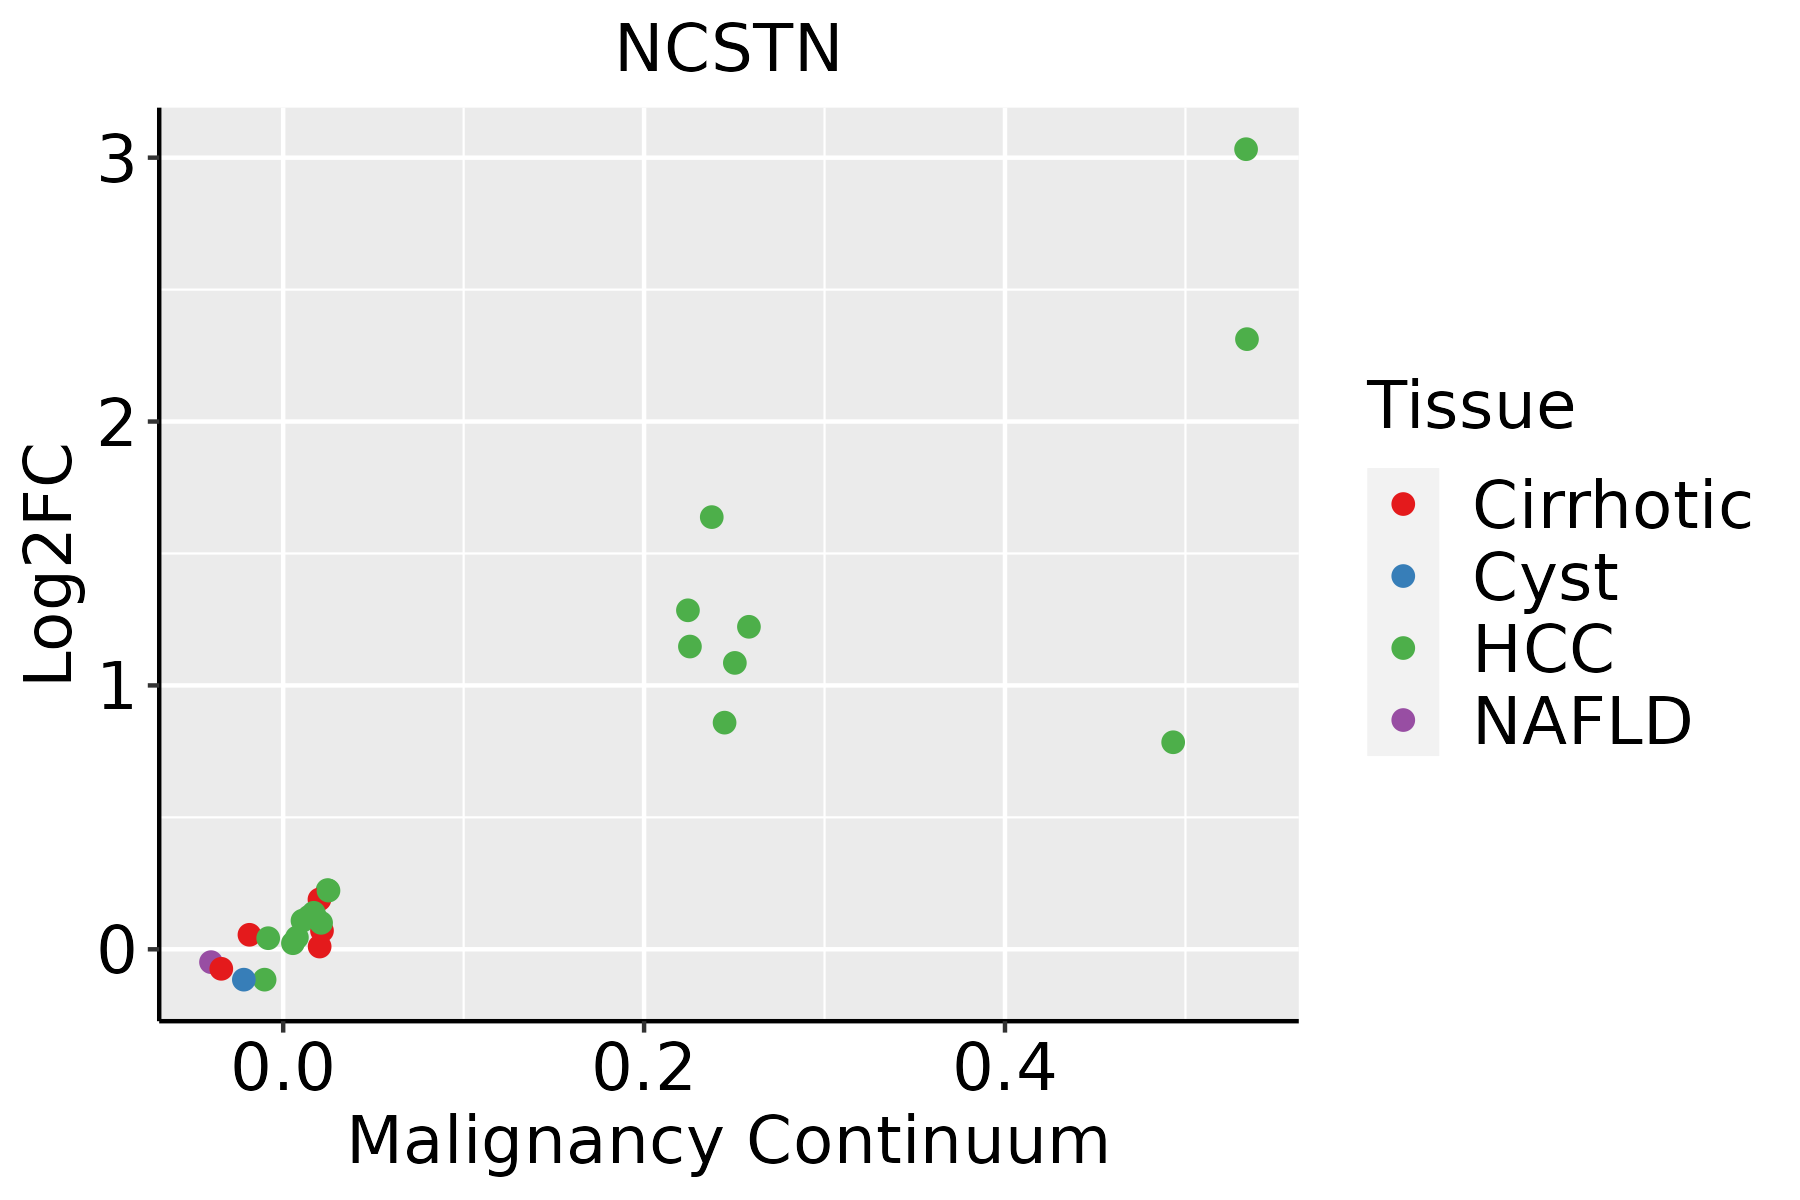 | HCC: Hepatocellular carcinoma |
| NAFLD: Non-alcoholic fatty liver disease | ||
| Oral Cavity | 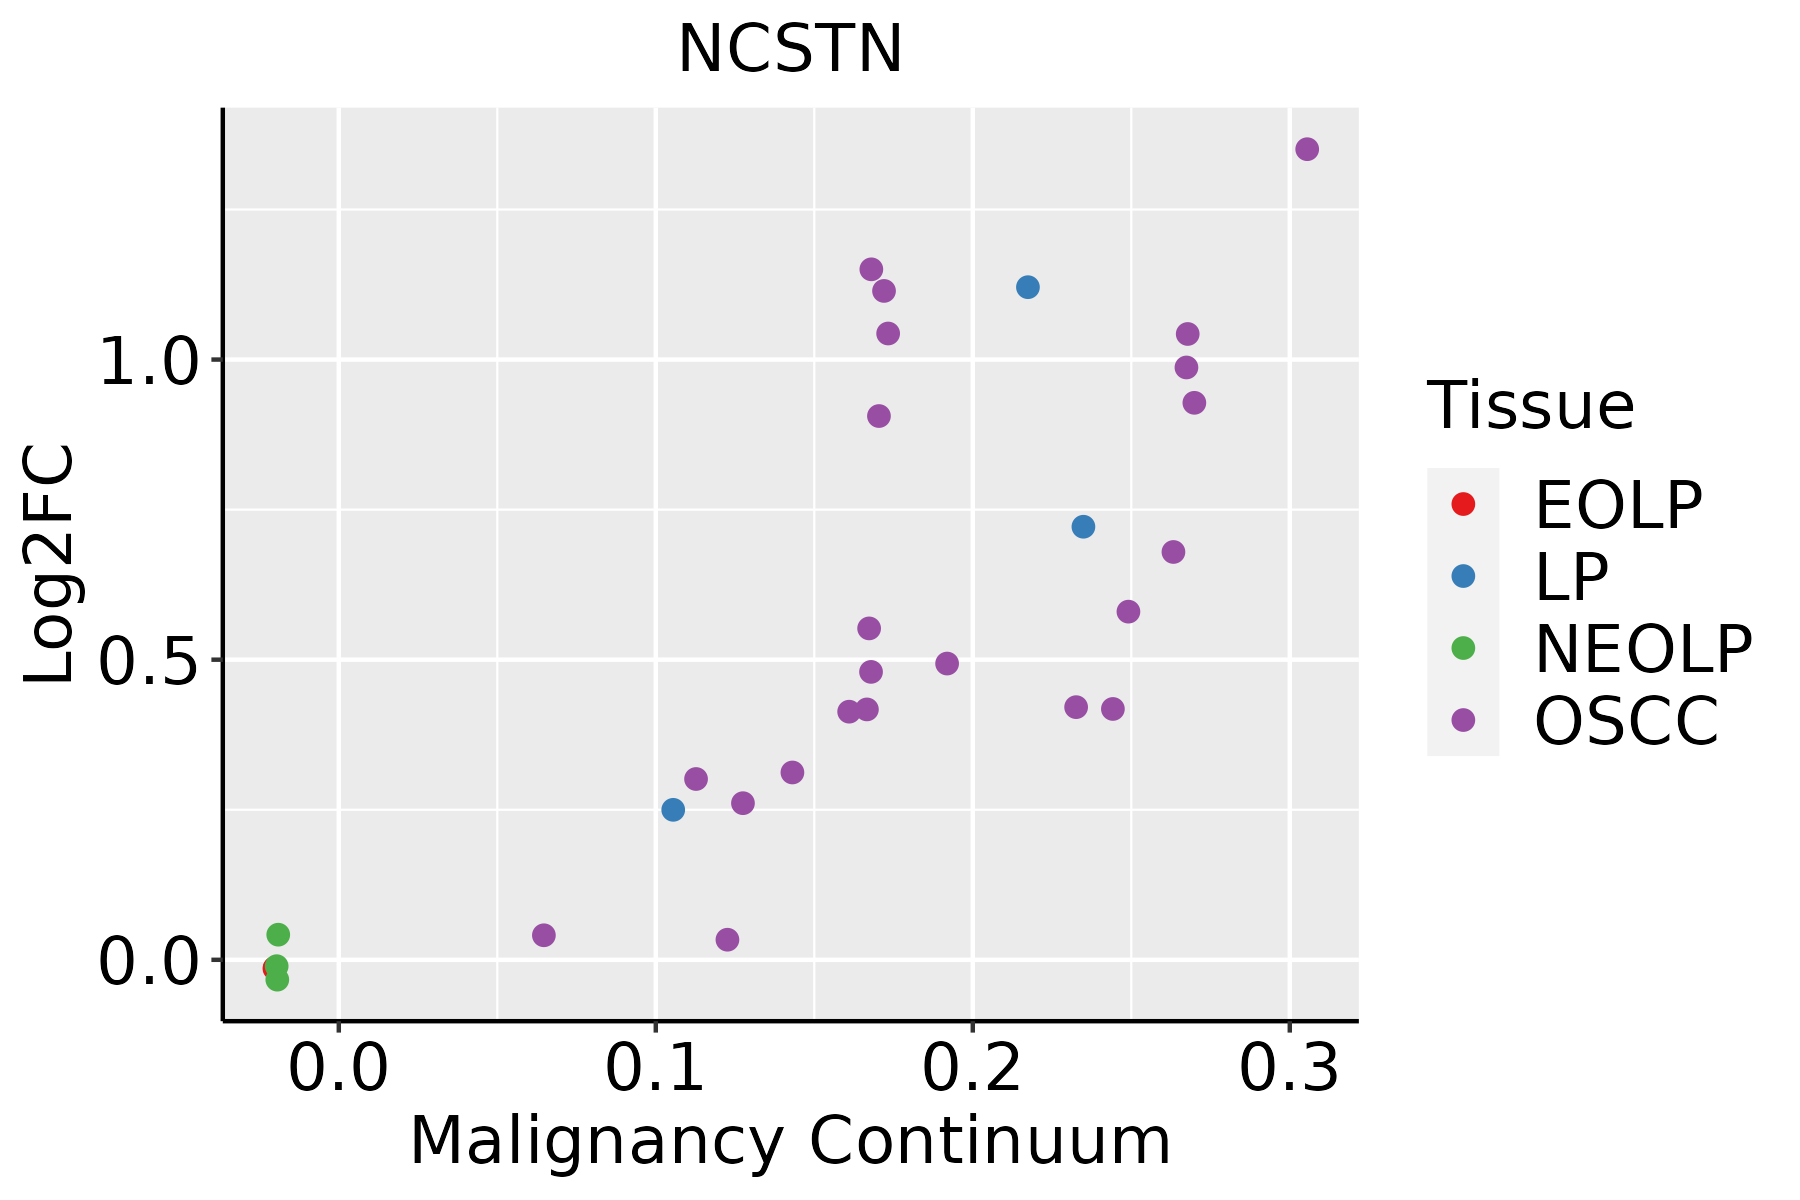 | EOLP: Erosive Oral lichen planus |
| LP: leukoplakia | ||
| NEOLP: Non-erosive oral lichen planus | ||
| OSCC: Oral squamous cell carcinoma | ||
| Skin | 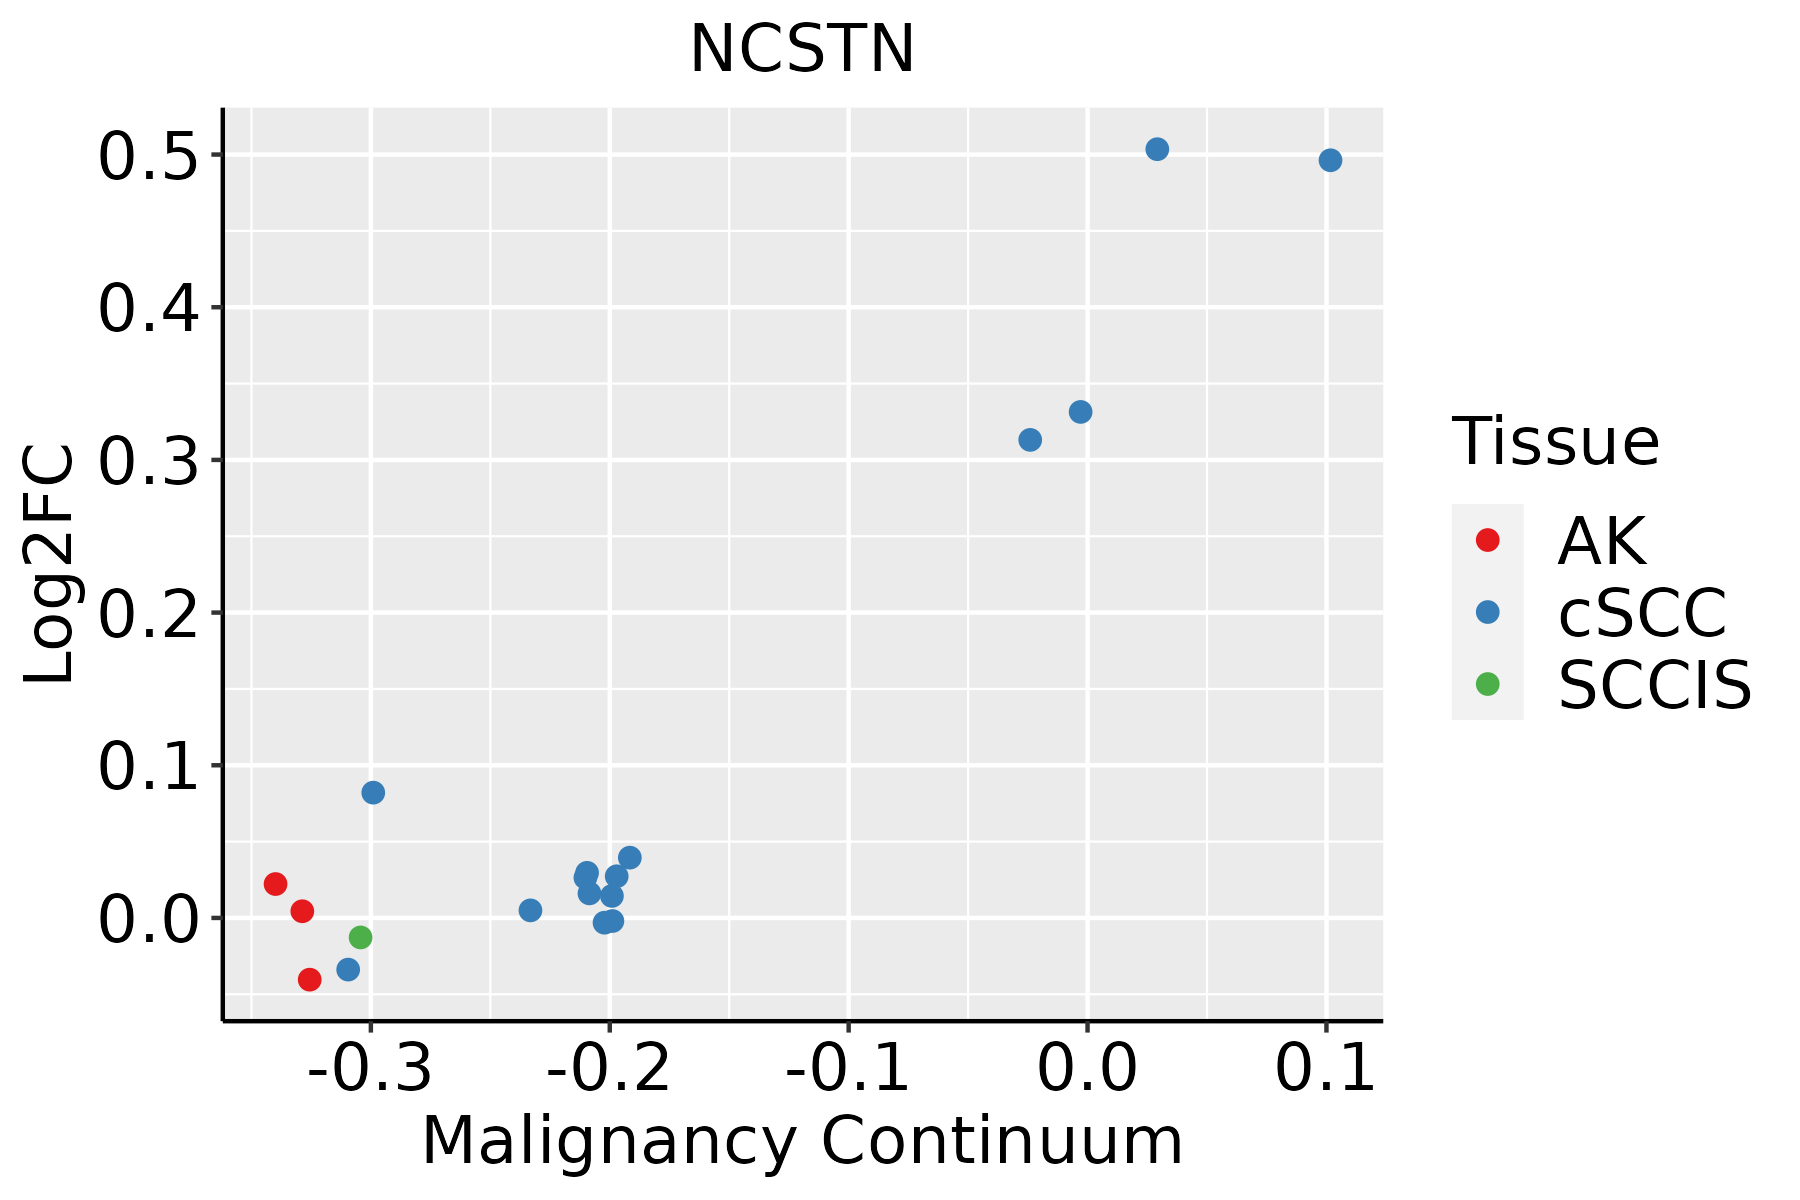 | AK: Actinic keratosis |
| cSCC: Cutaneous squamous cell carcinoma | ||
| SCCIS:squamous cell carcinoma in situ | ||
| Thyroid | 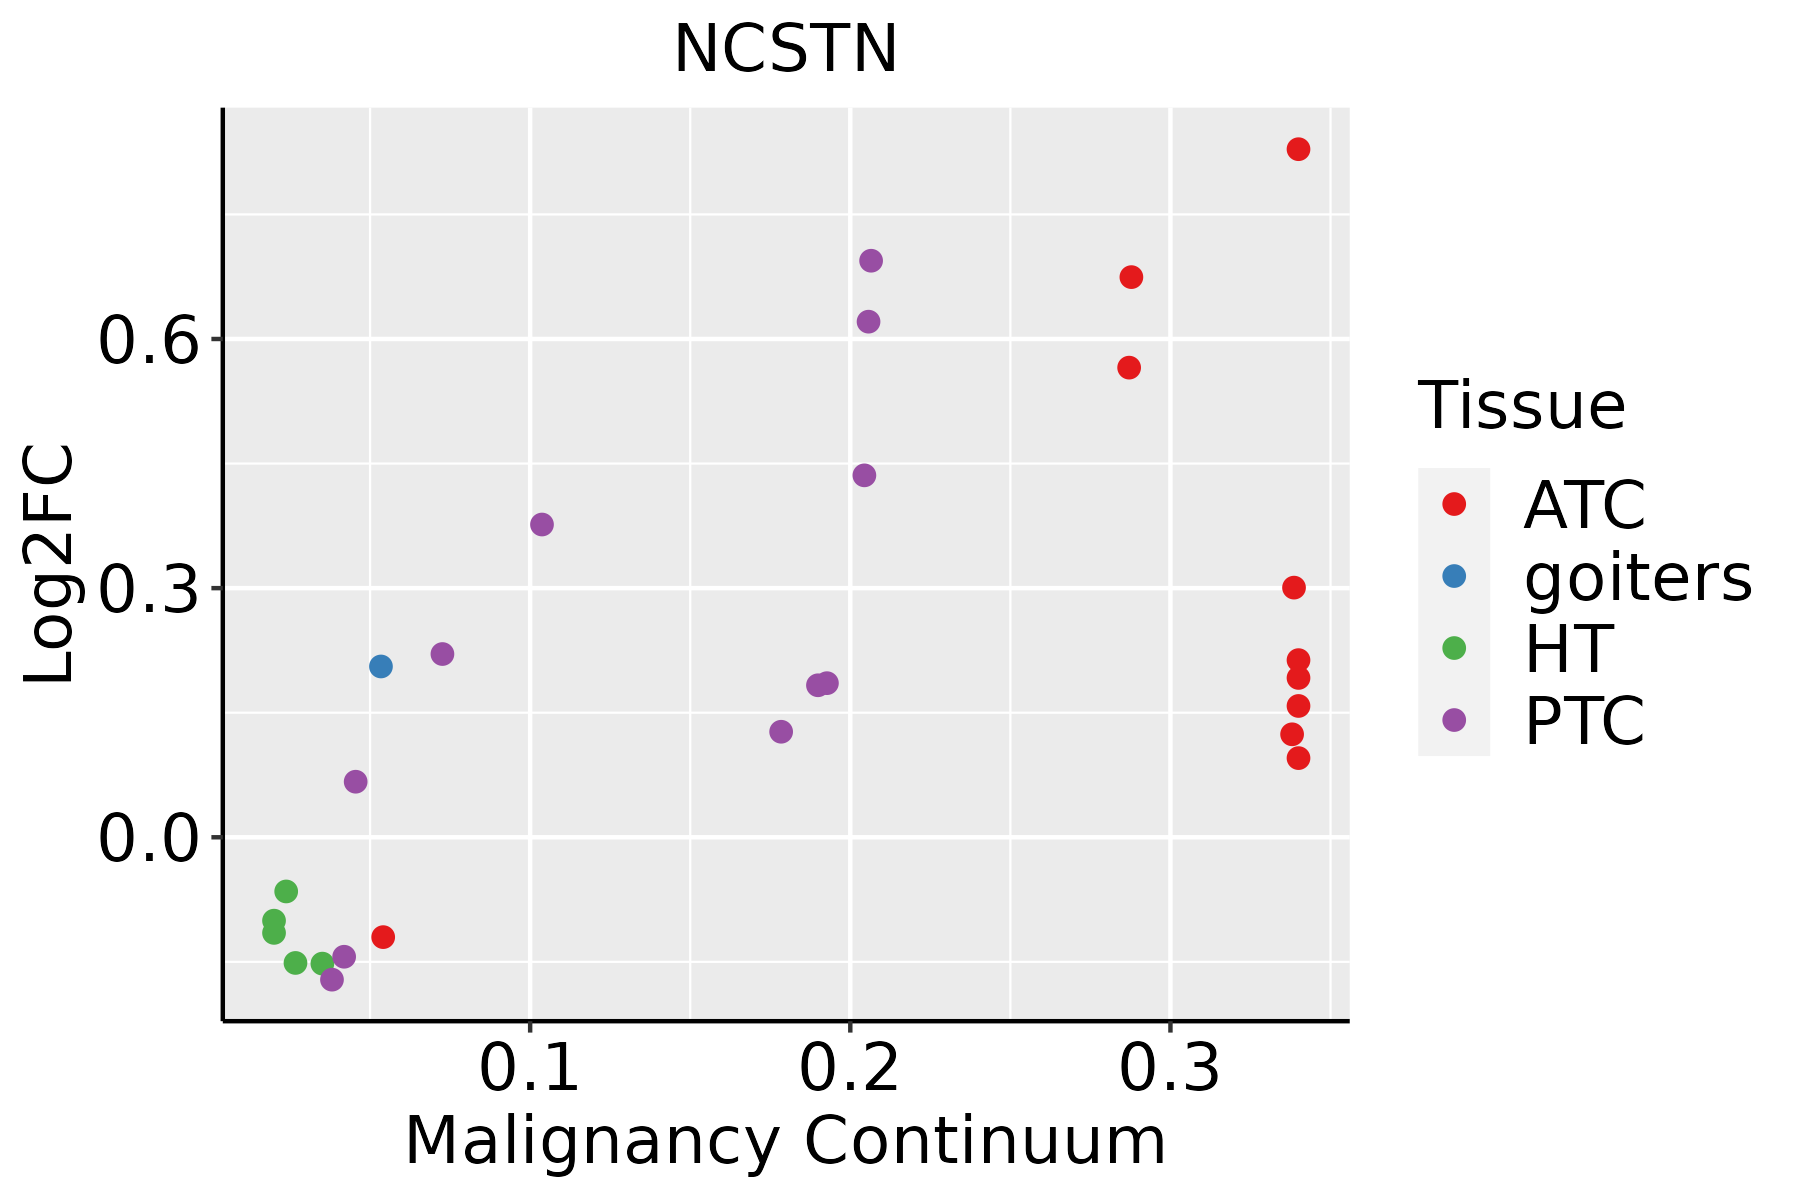 | ATC: Anaplastic thyroid cancer |
| HT: Hashimoto's thyroiditis | ||
| PTC: Papillary thyroid cancer |
| ∗log2FC in expression of this searched gene in stem-like cells from each diseased tissue sample relative to stem-like cells in normal samples in each tissue plotted against the malignancy continuum. Samples are colored based on if they are from different disease stage. |
Top |
Malignant transformation related pathway analysis |
| Find out the enriched GO biological processes and KEGG pathways involved in transition from healthy to precancer to cancer |
| Tissue | Disease Stage | Enriched GO biological Processes |
| Colorectum | AD |  |
| Colorectum | SER |  |
| Colorectum | MSS |  |
| Colorectum | MSI-H |  |
| Colorectum | FAP |  |
| ∗Top 15 enriched GO BP terms are showed in the bar plot of each disease state in each tissue. Each row represents a significant GO biological process which is colored according to the -log10(p.adjust). |
| Page: 1 2 3 4 5 6 7 8 9 |
| GO ID | Tissue | Disease Stage | Description | Gene Ratio | Bg Ratio | pvalue | p.adjust | Count |
| GO:0045862 | Colorectum | AD | positive regulation of proteolysis | 129/3918 | 372/18723 | 4.04e-10 | 3.46e-08 | 129 |
| GO:0070997 | Colorectum | AD | neuron death | 114/3918 | 361/18723 | 1.13e-06 | 3.72e-05 | 114 |
| GO:0052547 | Colorectum | AD | regulation of peptidase activity | 137/3918 | 461/18723 | 4.12e-06 | 1.12e-04 | 137 |
| GO:0002262 | Colorectum | AD | myeloid cell homeostasis | 57/3918 | 157/18723 | 6.17e-06 | 1.56e-04 | 57 |
| GO:0010952 | Colorectum | AD | positive regulation of peptidase activity | 68/3918 | 197/18723 | 6.30e-06 | 1.59e-04 | 68 |
| GO:0048872 | Colorectum | AD | homeostasis of number of cells | 87/3918 | 272/18723 | 1.16e-05 | 2.61e-04 | 87 |
| GO:0052548 | Colorectum | AD | regulation of endopeptidase activity | 124/3918 | 432/18723 | 6.58e-05 | 1.07e-03 | 124 |
| GO:0051402 | Colorectum | AD | neuron apoptotic process | 77/3918 | 246/18723 | 8.07e-05 | 1.28e-03 | 77 |
| GO:0010950 | Colorectum | AD | positive regulation of endopeptidase activity | 59/3918 | 179/18723 | 1.11e-04 | 1.65e-03 | 59 |
| GO:0010038 | Colorectum | AD | response to metal ion | 106/3918 | 373/18723 | 3.22e-04 | 3.83e-03 | 106 |
| GO:0071248 | Colorectum | AD | cellular response to metal ion | 61/3918 | 197/18723 | 5.74e-04 | 6.09e-03 | 61 |
| GO:0051604 | Colorectum | AD | protein maturation | 85/3918 | 294/18723 | 6.73e-04 | 6.91e-03 | 85 |
| GO:0071241 | Colorectum | AD | cellular response to inorganic substance | 68/3918 | 226/18723 | 6.98e-04 | 7.10e-03 | 68 |
| GO:0050673 | Colorectum | AD | epithelial cell proliferation | 119/3918 | 437/18723 | 8.75e-04 | 8.51e-03 | 119 |
| GO:0033619 | Colorectum | AD | membrane protein proteolysis | 21/3918 | 57/18723 | 4.16e-03 | 2.88e-02 | 21 |
| GO:0016485 | Colorectum | AD | protein processing | 63/3918 | 225/18723 | 6.77e-03 | 4.19e-02 | 63 |
| GO:0007219 | Colorectum | AD | Notch signaling pathway | 50/3918 | 172/18723 | 6.92e-03 | 4.26e-02 | 50 |
| GO:00458621 | Colorectum | SER | positive regulation of proteolysis | 106/2897 | 372/18723 | 8.40e-11 | 1.20e-08 | 106 |
| GO:00525471 | Colorectum | SER | regulation of peptidase activity | 114/2897 | 461/18723 | 1.18e-07 | 7.17e-06 | 114 |
| GO:00525481 | Colorectum | SER | regulation of endopeptidase activity | 103/2897 | 432/18723 | 2.86e-06 | 1.16e-04 | 103 |
| Page: 1 2 3 4 5 6 7 8 9 10 11 12 13 |
| Pathway ID | Tissue | Disease Stage | Description | Gene Ratio | Bg Ratio | pvalue | p.adjust | qvalue | Count |
| hsa05010 | Colorectum | AD | Alzheimer disease | 174/2092 | 384/8465 | 1.82e-19 | 9.26e-18 | 5.91e-18 | 174 |
| hsa050101 | Colorectum | AD | Alzheimer disease | 174/2092 | 384/8465 | 1.82e-19 | 9.26e-18 | 5.91e-18 | 174 |
| hsa050102 | Colorectum | SER | Alzheimer disease | 146/1580 | 384/8465 | 6.52e-20 | 2.40e-18 | 1.75e-18 | 146 |
| hsa050103 | Colorectum | SER | Alzheimer disease | 146/1580 | 384/8465 | 6.52e-20 | 2.40e-18 | 1.75e-18 | 146 |
| hsa050104 | Colorectum | MSS | Alzheimer disease | 169/1875 | 384/8465 | 1.21e-22 | 1.01e-20 | 6.21e-21 | 169 |
| hsa050105 | Colorectum | MSS | Alzheimer disease | 169/1875 | 384/8465 | 1.21e-22 | 1.01e-20 | 6.21e-21 | 169 |
| hsa05010210 | Esophagus | ESCC | Alzheimer disease | 263/4205 | 384/8465 | 1.80e-14 | 5.47e-13 | 2.80e-13 | 263 |
| hsa043306 | Esophagus | ESCC | Notch signaling pathway | 42/4205 | 62/8465 | 2.97e-03 | 7.97e-03 | 4.08e-03 | 42 |
| hsa0501038 | Esophagus | ESCC | Alzheimer disease | 263/4205 | 384/8465 | 1.80e-14 | 5.47e-13 | 2.80e-13 | 263 |
| hsa0433013 | Esophagus | ESCC | Notch signaling pathway | 42/4205 | 62/8465 | 2.97e-03 | 7.97e-03 | 4.08e-03 | 42 |
| hsa0501014 | Liver | Cirrhotic | Alzheimer disease | 180/2530 | 384/8465 | 5.52e-13 | 1.36e-11 | 8.36e-12 | 180 |
| hsa0501015 | Liver | Cirrhotic | Alzheimer disease | 180/2530 | 384/8465 | 5.52e-13 | 1.36e-11 | 8.36e-12 | 180 |
| hsa0501022 | Liver | HCC | Alzheimer disease | 254/4020 | 384/8465 | 3.75e-14 | 8.97e-13 | 4.99e-13 | 254 |
| hsa0501032 | Liver | HCC | Alzheimer disease | 254/4020 | 384/8465 | 3.75e-14 | 8.97e-13 | 4.99e-13 | 254 |
| hsa0501028 | Oral cavity | OSCC | Alzheimer disease | 244/3704 | 384/8465 | 1.18e-15 | 3.60e-14 | 1.83e-14 | 244 |
| hsa043305 | Oral cavity | OSCC | Notch signaling pathway | 44/3704 | 62/8465 | 1.26e-05 | 5.55e-05 | 2.83e-05 | 44 |
| hsa05010112 | Oral cavity | OSCC | Alzheimer disease | 244/3704 | 384/8465 | 1.18e-15 | 3.60e-14 | 1.83e-14 | 244 |
| hsa0433012 | Oral cavity | OSCC | Notch signaling pathway | 44/3704 | 62/8465 | 1.26e-05 | 5.55e-05 | 2.83e-05 | 44 |
| hsa0501029 | Oral cavity | LP | Alzheimer disease | 197/2418 | 384/8465 | 6.66e-22 | 3.69e-20 | 2.38e-20 | 197 |
| hsa0501037 | Oral cavity | LP | Alzheimer disease | 197/2418 | 384/8465 | 6.66e-22 | 3.69e-20 | 2.38e-20 | 197 |
| Page: 1 |
Top |
Cell-cell communication analysis |
| Identification of potential cell-cell interactions between two cell types and their ligand-receptor pairs for different disease states |
| Ligand | Receptor | LRpair | Pathway | Tissue | Disease Stage |
| Page: 1 |
Top |
Single-cell gene regulatory network inference analysis |
| Find out the significant the regulons (TFs) and the target genes of each regulon across cell types for different disease states |
| TF | Cell Type | Tissue | Disease Stage | Target Gene | RSS | Regulon Activity |
| ∗The dot plots of a searched regulon are shown for all cell subpopulations in each disease state of each tissue based on the regulon specific score inferred using pySCENIC and by calculating the average expression. |
| Page: 1 |
Top |
Somatic mutation of malignant transformation related genes |
| Annotation of somatic variants for genes involved in malignant transformation |
| Hugo Symbol | Variant Class | Variant Classification | dbSNP RS | HGVSc | HGVSp | HGVSp Short | SWISSPROT | BIOTYPE | SIFT | PolyPhen | Tumor Sample Barcode | Tissue | Histology | Sex | Age | Stage | Therapy Types | Drugs | Outcome |
| NCSTN | SNV | Missense_Mutation | c.170N>G | p.Thr57Ser | p.T57S | Q92542 | protein_coding | deleterious(0.01) | probably_damaging(0.983) | TCGA-A7-A0DA-01 | Breast | breast invasive carcinoma | Female | <65 | I/II | Chemotherapy | adriamycin | SD | |
| NCSTN | SNV | Missense_Mutation | c.1420G>C | p.Glu474Gln | p.E474Q | Q92542 | protein_coding | deleterious(0.03) | benign(0.238) | TCGA-AC-A23H-01 | Breast | breast invasive carcinoma | Female | >=65 | I/II | Unknown | Unknown | PD | |
| NCSTN | SNV | Missense_Mutation | c.2070C>G | p.Ile690Met | p.I690M | Q92542 | protein_coding | tolerated(0.06) | benign(0.067) | TCGA-AC-A23H-01 | Breast | breast invasive carcinoma | Female | >=65 | I/II | Unknown | Unknown | PD | |
| NCSTN | SNV | Missense_Mutation | novel | c.1715C>T | p.Ala572Val | p.A572V | Q92542 | protein_coding | deleterious(0.02) | possibly_damaging(0.787) | TCGA-E9-A3Q9-01 | Breast | breast invasive carcinoma | Female | >=65 | III/IV | Chemotherapy | cyclophosphane | CR |
| NCSTN | SNV | Missense_Mutation | novel | c.1625N>C | p.Leu542Pro | p.L542P | Q92542 | protein_coding | tolerated(0.14) | possibly_damaging(0.675) | TCGA-OL-A6VO-01 | Breast | breast invasive carcinoma | Female | <65 | I/II | Chemotherapy | taxotere | CR |
| NCSTN | insertion | Nonsense_Mutation | novel | c.724_725insGTCCCAAAGGATCAGGAGAGCCTACTGTCACCTAAGGCTCAC | p.Ile242delinsSerProLysGlySerGlyGluProThrValThrTerGlySerLeu | p.I242delinsSPKGSGEPTVT*GSL | Q92542 | protein_coding | TCGA-AN-A0FW-01 | Breast | breast invasive carcinoma | Female | >=65 | III/IV | Unknown | Unknown | SD | ||
| NCSTN | SNV | Missense_Mutation | rs200800006 | c.892G>A | p.Ala298Thr | p.A298T | Q92542 | protein_coding | tolerated(0.54) | benign(0.121) | TCGA-2W-A8YY-01 | Cervix | cervical & endocervical cancer | Female | <65 | I/II | Chemotherapy | cisplatin | CR |
| NCSTN | SNV | Missense_Mutation | c.375N>C | p.Leu125Phe | p.L125F | Q92542 | protein_coding | tolerated(0.7) | benign(0) | TCGA-C5-A1MK-01 | Cervix | cervical & endocervical cancer | Female | >=65 | III/IV | Chemotherapy | carboplatin | PD | |
| NCSTN | SNV | Missense_Mutation | c.1144C>T | p.Pro382Ser | p.P382S | Q92542 | protein_coding | deleterious(0) | probably_damaging(1) | TCGA-EK-A2PG-01 | Cervix | cervical & endocervical cancer | Female | >=65 | I/II | Unknown | Unknown | SD | |
| NCSTN | SNV | Missense_Mutation | c.412N>A | p.Val138Ile | p.V138I | Q92542 | protein_coding | tolerated(0.38) | benign(0.033) | TCGA-A6-2672-01 | Colorectum | colon adenocarcinoma | Female | >=65 | III/IV | Unknown | Unknown | SD |
| Page: 1 2 3 4 5 6 7 8 |
Top |
Related drugs of malignant transformation related genes |
| Identification of chemicals and drugs interact with genes involved in malignant transfromation |
| (DGIdb 4.0) |
| Entrez ID | Symbol | Category | Interaction Types | Drug Claim Name | Drug Name | PMIDs |
| 23385 | NCSTN | DRUGGABLE GENOME, CLINICALLY ACTIONABLE | inhibitor | MK0752 | ||
| 23385 | NCSTN | DRUGGABLE GENOME, CLINICALLY ACTIONABLE | inhibitor | RO 4929097 | ||
| 23385 | NCSTN | DRUGGABLE GENOME, CLINICALLY ACTIONABLE | inhibitor | PF03084014 | ||
| 23385 | NCSTN | DRUGGABLE GENOME, CLINICALLY ACTIONABLE | BMS-299897 | CHEMBL247471 | ||
| 23385 | NCSTN | DRUGGABLE GENOME, CLINICALLY ACTIONABLE | IC261 | IC261 | 20350806 | |
| 23385 | NCSTN | DRUGGABLE GENOME, CLINICALLY ACTIONABLE | GSI-136 | GSI-136 | ||
| 23385 | NCSTN | DRUGGABLE GENOME, CLINICALLY ACTIONABLE | inhibitor | CHEMBL463981 | BEGACESTAT | |
| 23385 | NCSTN | DRUGGABLE GENOME, CLINICALLY ACTIONABLE | modulator | CHEMBL190083 | TARENFLURBIL | |
| 23385 | NCSTN | DRUGGABLE GENOME, CLINICALLY ACTIONABLE | inhibitor | CHEMBL520733 | SEMAGACESTAT | |
| 23385 | NCSTN | DRUGGABLE GENOME, CLINICALLY ACTIONABLE | inhibitor | MK0752 |
| Page: 1 2 |

Copyright 2023-Present -The University of Texas Health Science Center at Houston |