| Tissue | Expression Dynamics | Abbreviation |
| Colorectum (GSE201348) |  | FAP: Familial adenomatous polyposis |
| CRC: Colorectal cancer |
| Colorectum (HTA11) |  | AD: Adenomas |
| SER: Sessile serrated lesions |
| MSI-H: Microsatellite-high colorectal cancer |
| MSS: Microsatellite stable colorectal cancer |
| Esophagus | 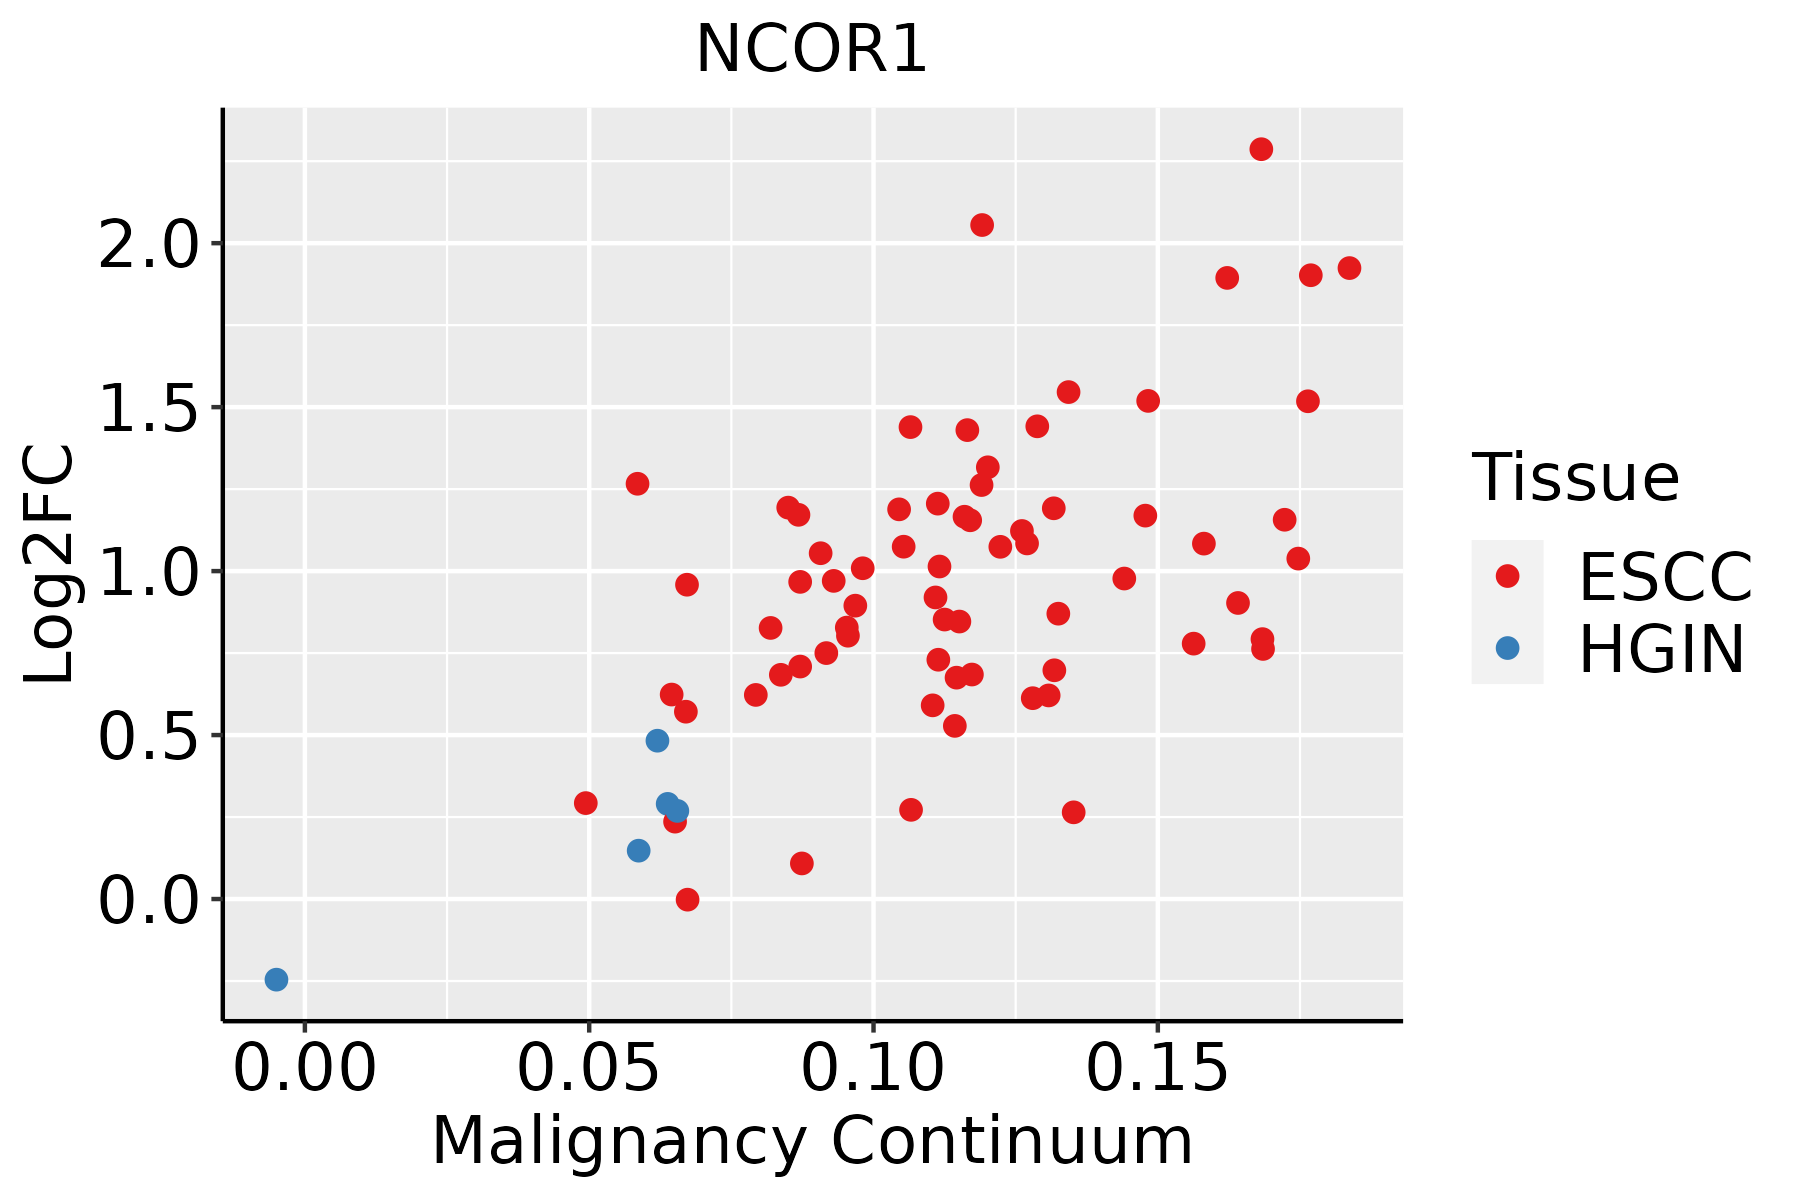 | ESCC: Esophageal squamous cell carcinoma |
| HGIN: High-grade intraepithelial neoplasias |
| LGIN: Low-grade intraepithelial neoplasias |
| GC |  | CAG: Chronic atrophic gastritis |
| CAG with IM: Chronic atrophic gastritis with intestinal metaplasia |
| CSG: Chronic superficial gastritis |
| GC: Gastric cancer |
| SIM: Severe intestinal metaplasia |
| WIM: Wild intestinal metaplasia |
| Liver |  | HCC: Hepatocellular carcinoma |
| NAFLD: Non-alcoholic fatty liver disease |
| Lung | 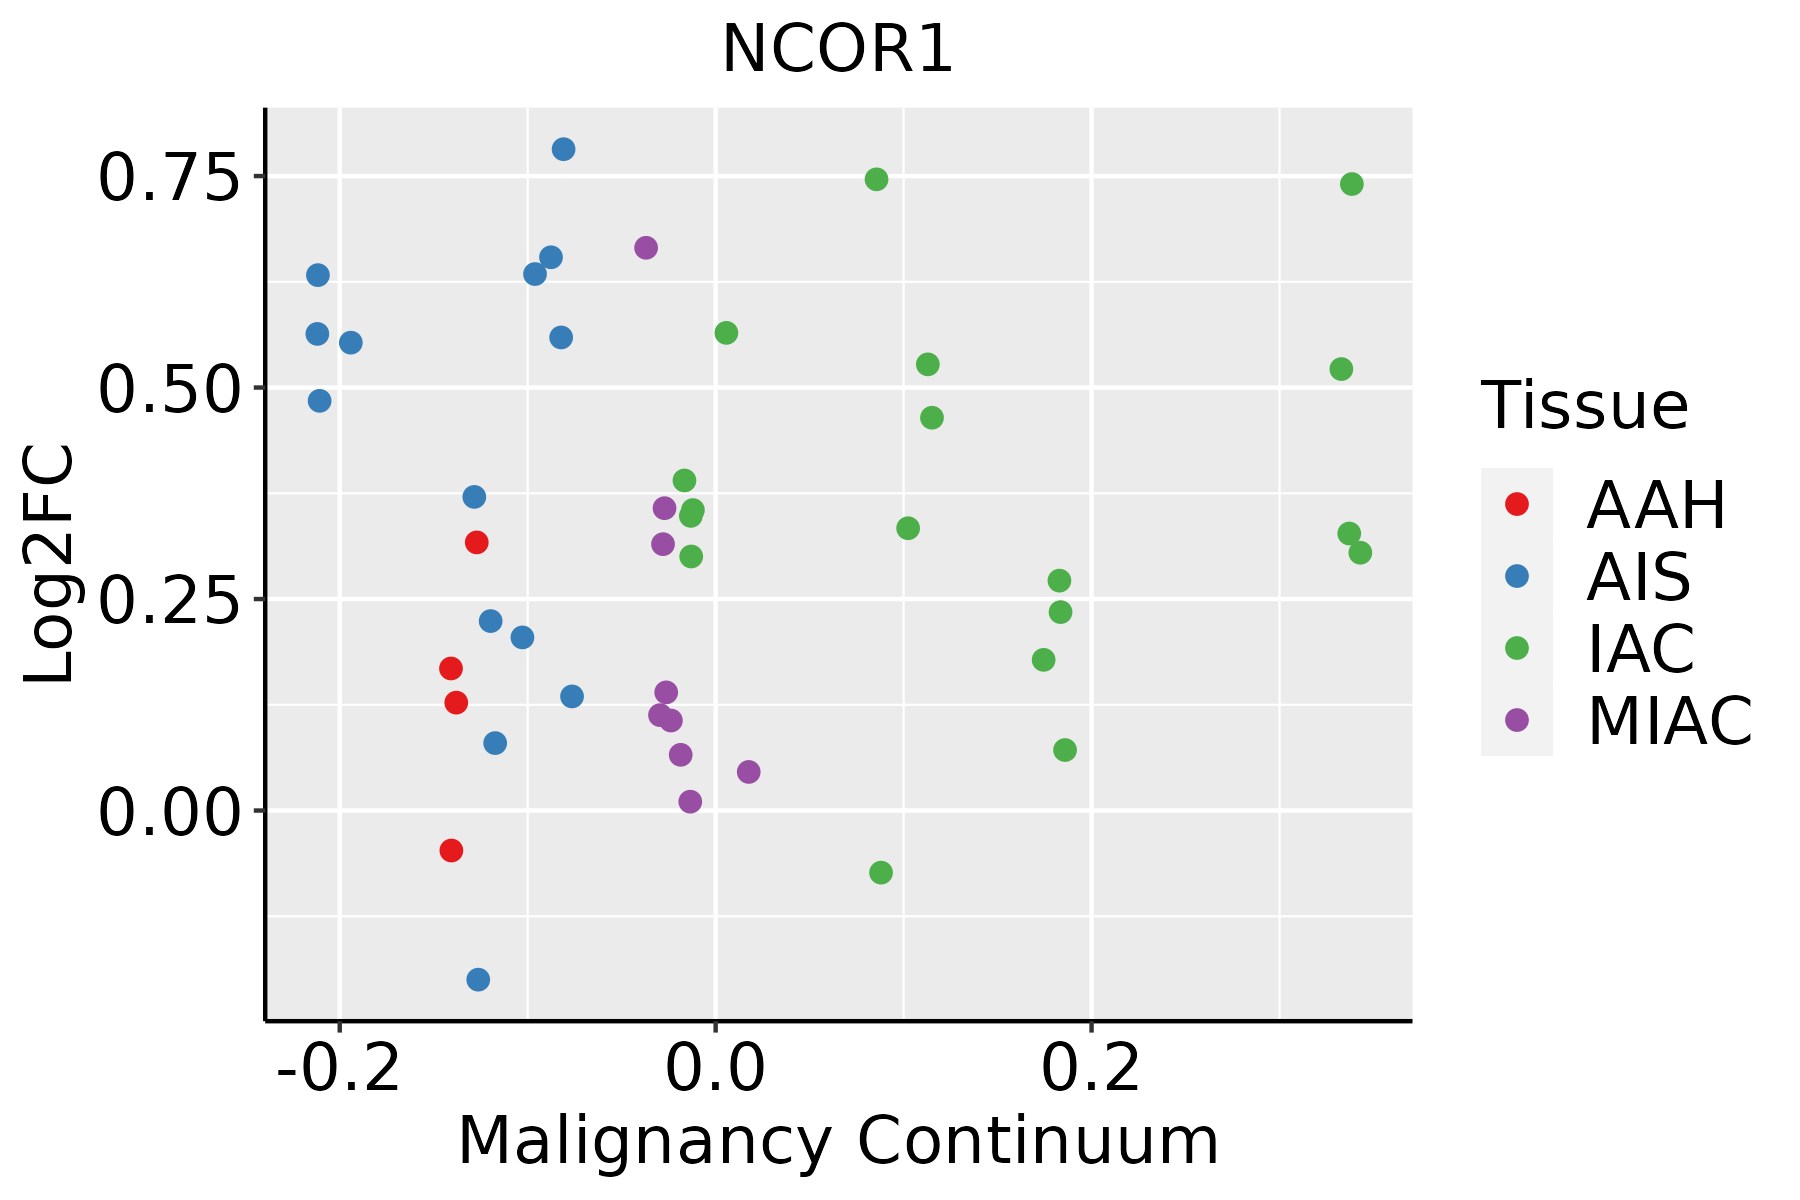 | AAH: Atypical adenomatous hyperplasia |
| AIS: Adenocarcinoma in situ |
| IAC: Invasive lung adenocarcinoma |
| MIA: Minimally invasive adenocarcinoma |
| Oral Cavity |  | EOLP: Erosive Oral lichen planus |
| LP: leukoplakia |
| NEOLP: Non-erosive oral lichen planus |
| OSCC: Oral squamous cell carcinoma |
| Prostate | 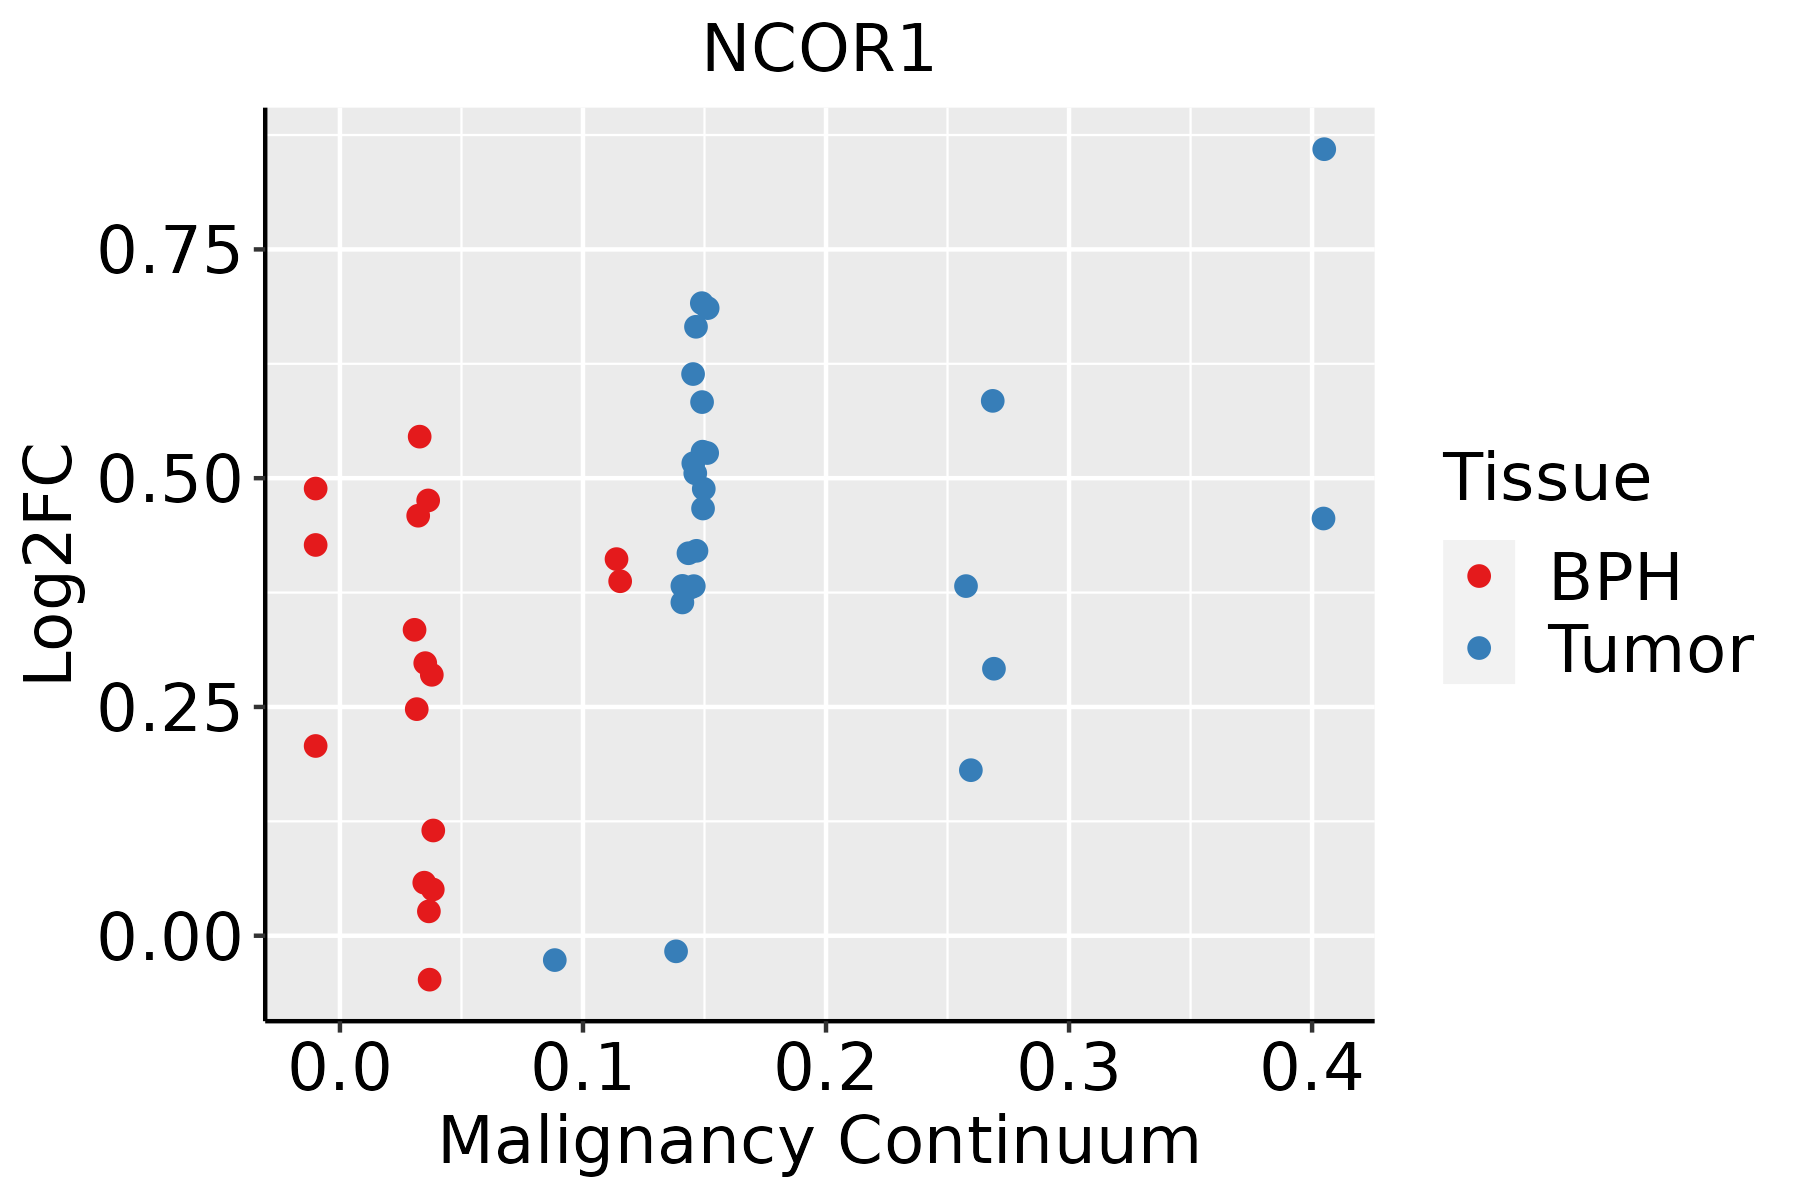 | BPH: Benign Prostatic Hyperplasia |
| Skin |  | AK: Actinic keratosis |
| cSCC: Cutaneous squamous cell carcinoma |
| SCCIS:squamous cell carcinoma in situ |
| Thyroid | 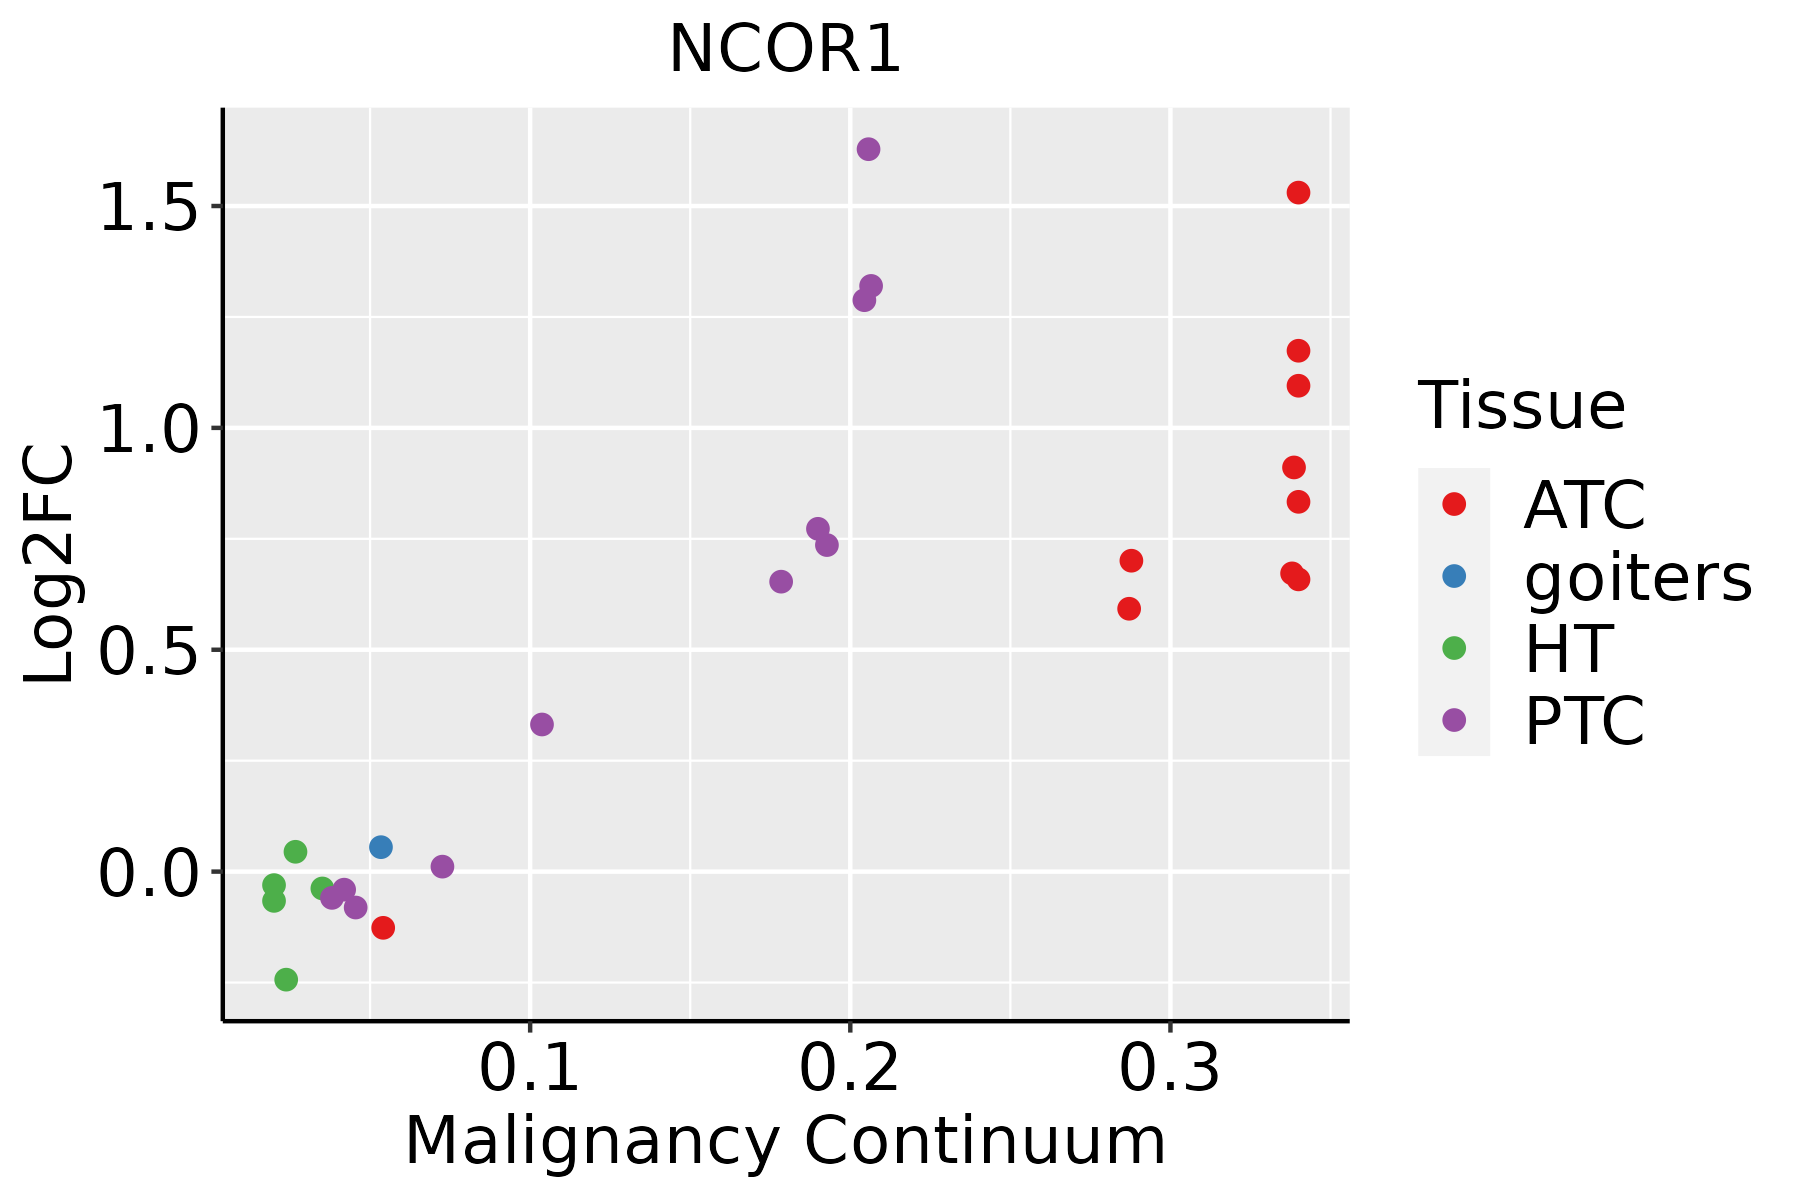 | ATC: Anaplastic thyroid cancer |
| HT: Hashimoto's thyroiditis |
| PTC: Papillary thyroid cancer |
| GO ID | Tissue | Disease Stage | Description | Gene Ratio | Bg Ratio | pvalue | p.adjust | Count |
| GO:0046034 | Colorectum | AD | ATP metabolic process | 142/3918 | 277/18723 | 2.64e-29 | 8.26e-26 | 142 |
| GO:0006091 | Colorectum | AD | generation of precursor metabolites and energy | 209/3918 | 490/18723 | 3.17e-28 | 6.61e-25 | 209 |
| GO:0009150 | Colorectum | AD | purine ribonucleotide metabolic process | 142/3918 | 368/18723 | 4.29e-15 | 1.17e-12 | 142 |
| GO:0006163 | Colorectum | AD | purine nucleotide metabolic process | 149/3918 | 396/18723 | 1.08e-14 | 2.80e-12 | 149 |
| GO:0072521 | Colorectum | AD | purine-containing compound metabolic process | 153/3918 | 416/18723 | 4.34e-14 | 1.01e-11 | 153 |
| GO:0009259 | Colorectum | AD | ribonucleotide metabolic process | 144/3918 | 385/18723 | 5.25e-14 | 1.13e-11 | 144 |
| GO:0009895 | Colorectum | AD | negative regulation of catabolic process | 124/3918 | 320/18723 | 1.66e-13 | 3.35e-11 | 124 |
| GO:0019693 | Colorectum | AD | ribose phosphate metabolic process | 145/3918 | 396/18723 | 3.01e-13 | 5.71e-11 | 145 |
| GO:0009117 | Colorectum | AD | nucleotide metabolic process | 168/3918 | 489/18723 | 2.20e-12 | 3.36e-10 | 168 |
| GO:0006753 | Colorectum | AD | nucleoside phosphate metabolic process | 169/3918 | 497/18723 | 4.99e-12 | 6.98e-10 | 169 |
| GO:0009135 | Colorectum | AD | purine nucleoside diphosphate metabolic process | 47/3918 | 103/18723 | 1.61e-08 | 9.22e-07 | 47 |
| GO:0009179 | Colorectum | AD | purine ribonucleoside diphosphate metabolic process | 47/3918 | 103/18723 | 1.61e-08 | 9.22e-07 | 47 |
| GO:0006090 | Colorectum | AD | pyruvate metabolic process | 47/3918 | 106/18723 | 4.85e-08 | 2.55e-06 | 47 |
| GO:0009185 | Colorectum | AD | ribonucleoside diphosphate metabolic process | 47/3918 | 106/18723 | 4.85e-08 | 2.55e-06 | 47 |
| GO:0046031 | Colorectum | AD | ADP metabolic process | 41/3918 | 90/18723 | 1.37e-07 | 6.42e-06 | 41 |
| GO:0006096 | Colorectum | AD | glycolytic process | 38/3918 | 81/18723 | 1.52e-07 | 6.78e-06 | 38 |
| GO:0006757 | Colorectum | AD | ATP generation from ADP | 38/3918 | 82/18723 | 2.26e-07 | 9.37e-06 | 38 |
| GO:0071383 | Colorectum | AD | cellular response to steroid hormone stimulus | 73/3918 | 204/18723 | 6.31e-07 | 2.24e-05 | 73 |
| GO:0009132 | Colorectum | AD | nucleoside diphosphate metabolic process | 49/3918 | 124/18723 | 1.75e-06 | 5.31e-05 | 49 |
| GO:0046939 | Colorectum | AD | nucleotide phosphorylation | 42/3918 | 101/18723 | 1.99e-06 | 5.92e-05 | 42 |
| Pathway ID | Tissue | Disease Stage | Description | Gene Ratio | Bg Ratio | pvalue | p.adjust | qvalue | Count |
| hsa04919 | Colorectum | AD | Thyroid hormone signaling pathway | 51/2092 | 121/8465 | 1.71e-05 | 1.73e-04 | 1.10e-04 | 51 |
| hsa049191 | Colorectum | AD | Thyroid hormone signaling pathway | 51/2092 | 121/8465 | 1.71e-05 | 1.73e-04 | 1.10e-04 | 51 |
| hsa049192 | Colorectum | SER | Thyroid hormone signaling pathway | 40/1580 | 121/8465 | 1.02e-04 | 1.06e-03 | 7.67e-04 | 40 |
| hsa04350 | Colorectum | SER | TGF-beta signaling pathway | 31/1580 | 108/8465 | 7.00e-03 | 3.77e-02 | 2.74e-02 | 31 |
| hsa049193 | Colorectum | SER | Thyroid hormone signaling pathway | 40/1580 | 121/8465 | 1.02e-04 | 1.06e-03 | 7.67e-04 | 40 |
| hsa043501 | Colorectum | SER | TGF-beta signaling pathway | 31/1580 | 108/8465 | 7.00e-03 | 3.77e-02 | 2.74e-02 | 31 |
| hsa049194 | Colorectum | MSS | Thyroid hormone signaling pathway | 46/1875 | 121/8465 | 5.04e-05 | 4.97e-04 | 3.05e-04 | 46 |
| hsa049195 | Colorectum | MSS | Thyroid hormone signaling pathway | 46/1875 | 121/8465 | 5.04e-05 | 4.97e-04 | 3.05e-04 | 46 |
| hsa049196 | Colorectum | MSI-H | Thyroid hormone signaling pathway | 21/797 | 121/8465 | 4.18e-03 | 4.10e-02 | 3.44e-02 | 21 |
| hsa049197 | Colorectum | MSI-H | Thyroid hormone signaling pathway | 21/797 | 121/8465 | 4.18e-03 | 4.10e-02 | 3.44e-02 | 21 |
| hsa049198 | Colorectum | FAP | Thyroid hormone signaling pathway | 41/1404 | 121/8465 | 2.28e-06 | 4.28e-05 | 2.60e-05 | 41 |
| hsa05202 | Colorectum | FAP | Transcriptional misregulation in cancer | 45/1404 | 193/8465 | 9.19e-03 | 3.33e-02 | 2.03e-02 | 45 |
| hsa049199 | Colorectum | FAP | Thyroid hormone signaling pathway | 41/1404 | 121/8465 | 2.28e-06 | 4.28e-05 | 2.60e-05 | 41 |
| hsa052021 | Colorectum | FAP | Transcriptional misregulation in cancer | 45/1404 | 193/8465 | 9.19e-03 | 3.33e-02 | 2.03e-02 | 45 |
| hsa0491910 | Colorectum | CRC | Thyroid hormone signaling pathway | 35/1091 | 121/8465 | 2.05e-06 | 6.85e-05 | 4.64e-05 | 35 |
| hsa0491911 | Colorectum | CRC | Thyroid hormone signaling pathway | 35/1091 | 121/8465 | 2.05e-06 | 6.85e-05 | 4.64e-05 | 35 |
| hsa0491928 | Esophagus | ESCC | Thyroid hormone signaling pathway | 78/4205 | 121/8465 | 6.79e-04 | 2.23e-03 | 1.14e-03 | 78 |
| hsa043507 | Esophagus | ESCC | TGF-beta signaling pathway | 69/4205 | 108/8465 | 1.92e-03 | 5.54e-03 | 2.84e-03 | 69 |
| hsa052028 | Esophagus | ESCC | Transcriptional misregulation in cancer | 116/4205 | 193/8465 | 2.08e-03 | 5.95e-03 | 3.05e-03 | 116 |
| hsa015227 | Esophagus | ESCC | Endocrine resistance | 63/4205 | 98/8465 | 2.38e-03 | 6.58e-03 | 3.37e-03 | 63 |
| Hugo Symbol | Variant Class | Variant Classification | dbSNP RS | HGVSc | HGVSp | HGVSp Short | SWISSPROT | BIOTYPE | SIFT | PolyPhen | Tumor Sample Barcode | Tissue | Histology | Sex | Age | Stage | Therapy Types | Drugs | Outcome |
| NCOR1 | SNV | Missense_Mutation | novel | c.19C>T | p.Pro7Ser | p.P7S | O75376 | protein_coding | deleterious(0) | possibly_damaging(0.621) | TCGA-3C-AALK-01 | Breast | breast invasive carcinoma | Female | <65 | I/II | Chemotherapy | docetaxel | SD |
| NCOR1 | SNV | Missense_Mutation | | c.1591N>C | p.Glu531Gln | p.E531Q | O75376 | protein_coding | tolerated(0.07) | benign(0.042) | TCGA-A1-A0SN-01 | Breast | breast invasive carcinoma | Female | <65 | I/II | Chemotherapy | ac | SD |
| NCOR1 | SNV | Missense_Mutation | | c.3488N>A | p.Gly1163Asp | p.G1163D | O75376 | protein_coding | deleterious(0) | probably_damaging(0.998) | TCGA-A2-A0CU-01 | Breast | breast invasive carcinoma | Female | >=65 | I/II | Hormone Therapy | tamoxiphen | SD |
| NCOR1 | SNV | Missense_Mutation | | c.7010N>T | p.Ser2337Phe | p.S2337F | O75376 | protein_coding | deleterious(0) | probably_damaging(0.991) | TCGA-A8-A08R-01 | Breast | breast invasive carcinoma | Female | <65 | I/II | Unknown | Unknown | SD |
| NCOR1 | SNV | Missense_Mutation | novel | c.2161G>A | p.Glu721Lys | p.E721K | O75376 | protein_coding | deleterious(0.02) | probably_damaging(0.971) | TCGA-AC-A8OP-01 | Breast | breast invasive carcinoma | Female | >=65 | I/II | Unknown | Unknown | SD |
| NCOR1 | SNV | Missense_Mutation | rs367758096 | c.451N>A | p.Gly151Ser | p.G151S | O75376 | protein_coding | tolerated(0.18) | benign(0.001) | TCGA-AN-A046-01 | Breast | breast invasive carcinoma | Female | >=65 | I/II | Unknown | Unknown | SD |
| NCOR1 | SNV | Missense_Mutation | | c.5725N>T | p.Pro1909Ser | p.P1909S | O75376 | protein_coding | tolerated(0.09) | benign(0.162) | TCGA-AN-A0AK-01 | Breast | breast invasive carcinoma | Female | >=65 | I/II | Unknown | Unknown | SD |
| NCOR1 | SNV | Missense_Mutation | | c.5263N>T | p.Arg1755Cys | p.R1755C | O75376 | protein_coding | deleterious(0) | probably_damaging(0.925) | TCGA-AN-A0AK-01 | Breast | breast invasive carcinoma | Female | >=65 | I/II | Unknown | Unknown | SD |
| NCOR1 | SNV | Missense_Mutation | rs754505756 | c.4882N>T | p.Arg1628Cys | p.R1628C | O75376 | protein_coding | deleterious(0) | probably_damaging(0.99) | TCGA-AO-A128-01 | Breast | breast invasive carcinoma | Female | <65 | I/II | Chemotherapy | doxorubicin | SD |
| NCOR1 | SNV | Missense_Mutation | | c.3644N>G | p.Lys1215Arg | p.K1215R | O75376 | protein_coding | deleterious(0.03) | probably_damaging(0.985) | TCGA-AR-A0TV-01 | Breast | breast invasive carcinoma | Female | >=65 | I/II | Unknown | Unknown | SD |


