
|
|||||
|
 | |
| |
| |
| |
| |
| |
|
Gene: NCOA7 |
Gene summary for NCOA7 |
| Gene information | Species | Human | Gene symbol | NCOA7 | Gene ID | 135112 |
| Gene name | nuclear receptor coactivator 7 | |
| Gene Alias | ERAP140 | |
| Cytomap | 6q22.31-q22.32 | |
| Gene Type | protein-coding | GO ID | GO:0006139 | UniProtAcc | B3KXK4 |
Top |
Malignant transformation analysis |
| Identification of the aberrant gene expression in precancerous and cancerous lesions by comparing the gene expression of stem-like cells in diseased tissues with normal stem cells |
| Entrez ID | Symbol | Replicates | Species | Organ | Tissue | Adj P-value | Log2FC | Malignancy |
| 135112 | NCOA7 | CA_HPV_1 | Human | Cervix | CC | 2.55e-03 | -4.44e-02 | 0.0264 |
| 135112 | NCOA7 | CCI_2 | Human | Cervix | CC | 2.40e-03 | 8.17e-01 | 0.5249 |
| 135112 | NCOA7 | sample1 | Human | Cervix | CC | 9.35e-14 | 7.63e-01 | 0.0959 |
| 135112 | NCOA7 | L1 | Human | Cervix | CC | 1.10e-02 | -3.17e-01 | 0.0802 |
| 135112 | NCOA7 | T1 | Human | Cervix | CC | 2.70e-23 | 7.46e-01 | 0.0918 |
| 135112 | NCOA7 | LZE4T | Human | Esophagus | ESCC | 6.42e-05 | 1.06e+00 | 0.0811 |
| 135112 | NCOA7 | LZE8T | Human | Esophagus | ESCC | 2.33e-14 | 1.38e+00 | 0.067 |
| 135112 | NCOA7 | LZE24T | Human | Esophagus | ESCC | 6.48e-20 | 2.20e+00 | 0.0596 |
| 135112 | NCOA7 | LZE21T | Human | Esophagus | ESCC | 1.78e-03 | 1.12e+00 | 0.0655 |
| 135112 | NCOA7 | P1T-E | Human | Esophagus | ESCC | 3.45e-09 | 1.52e+00 | 0.0875 |
| 135112 | NCOA7 | P2T-E | Human | Esophagus | ESCC | 2.33e-62 | 2.61e+00 | 0.1177 |
| 135112 | NCOA7 | P4T-E | Human | Esophagus | ESCC | 1.83e-27 | 2.40e+00 | 0.1323 |
| 135112 | NCOA7 | P5T-E | Human | Esophagus | ESCC | 1.20e-03 | 6.93e-01 | 0.1327 |
| 135112 | NCOA7 | P8T-E | Human | Esophagus | ESCC | 1.05e-27 | 2.17e+00 | 0.0889 |
| 135112 | NCOA7 | P9T-E | Human | Esophagus | ESCC | 8.61e-06 | 3.83e-01 | 0.1131 |
| 135112 | NCOA7 | P11T-E | Human | Esophagus | ESCC | 3.40e-03 | 8.06e-01 | 0.1426 |
| 135112 | NCOA7 | P15T-E | Human | Esophagus | ESCC | 1.42e-20 | 1.81e+00 | 0.1149 |
| 135112 | NCOA7 | P16T-E | Human | Esophagus | ESCC | 3.46e-25 | 1.36e+00 | 0.1153 |
| 135112 | NCOA7 | P20T-E | Human | Esophagus | ESCC | 5.44e-29 | 2.37e+00 | 0.1124 |
| 135112 | NCOA7 | P21T-E | Human | Esophagus | ESCC | 1.15e-40 | 2.50e+00 | 0.1617 |
| Page: 1 2 3 4 5 6 7 8 9 |
| Tissue | Expression Dynamics | Abbreviation |
| Cervix | 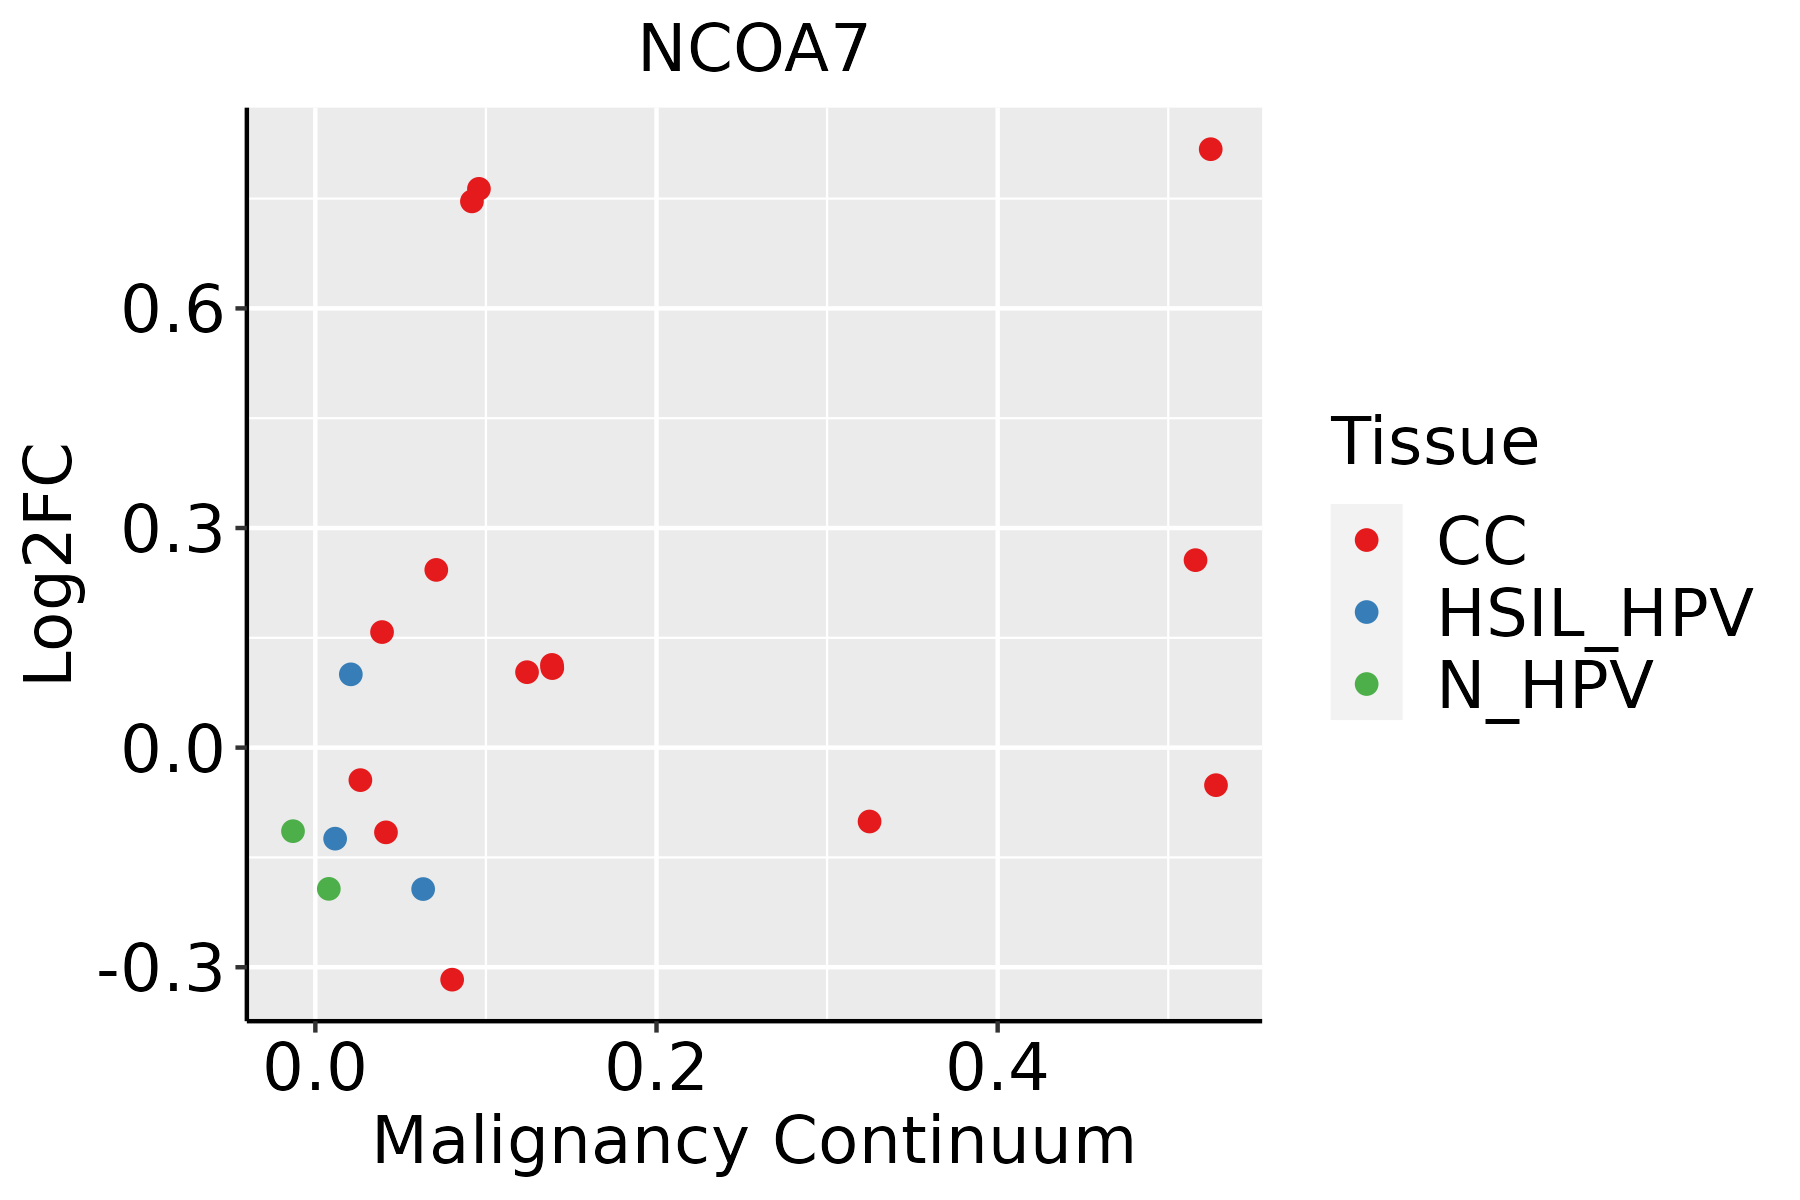 | CC: Cervix cancer |
| HSIL_HPV: HPV-infected high-grade squamous intraepithelial lesions | ||
| N_HPV: HPV-infected normal cervix | ||
| Esophagus | 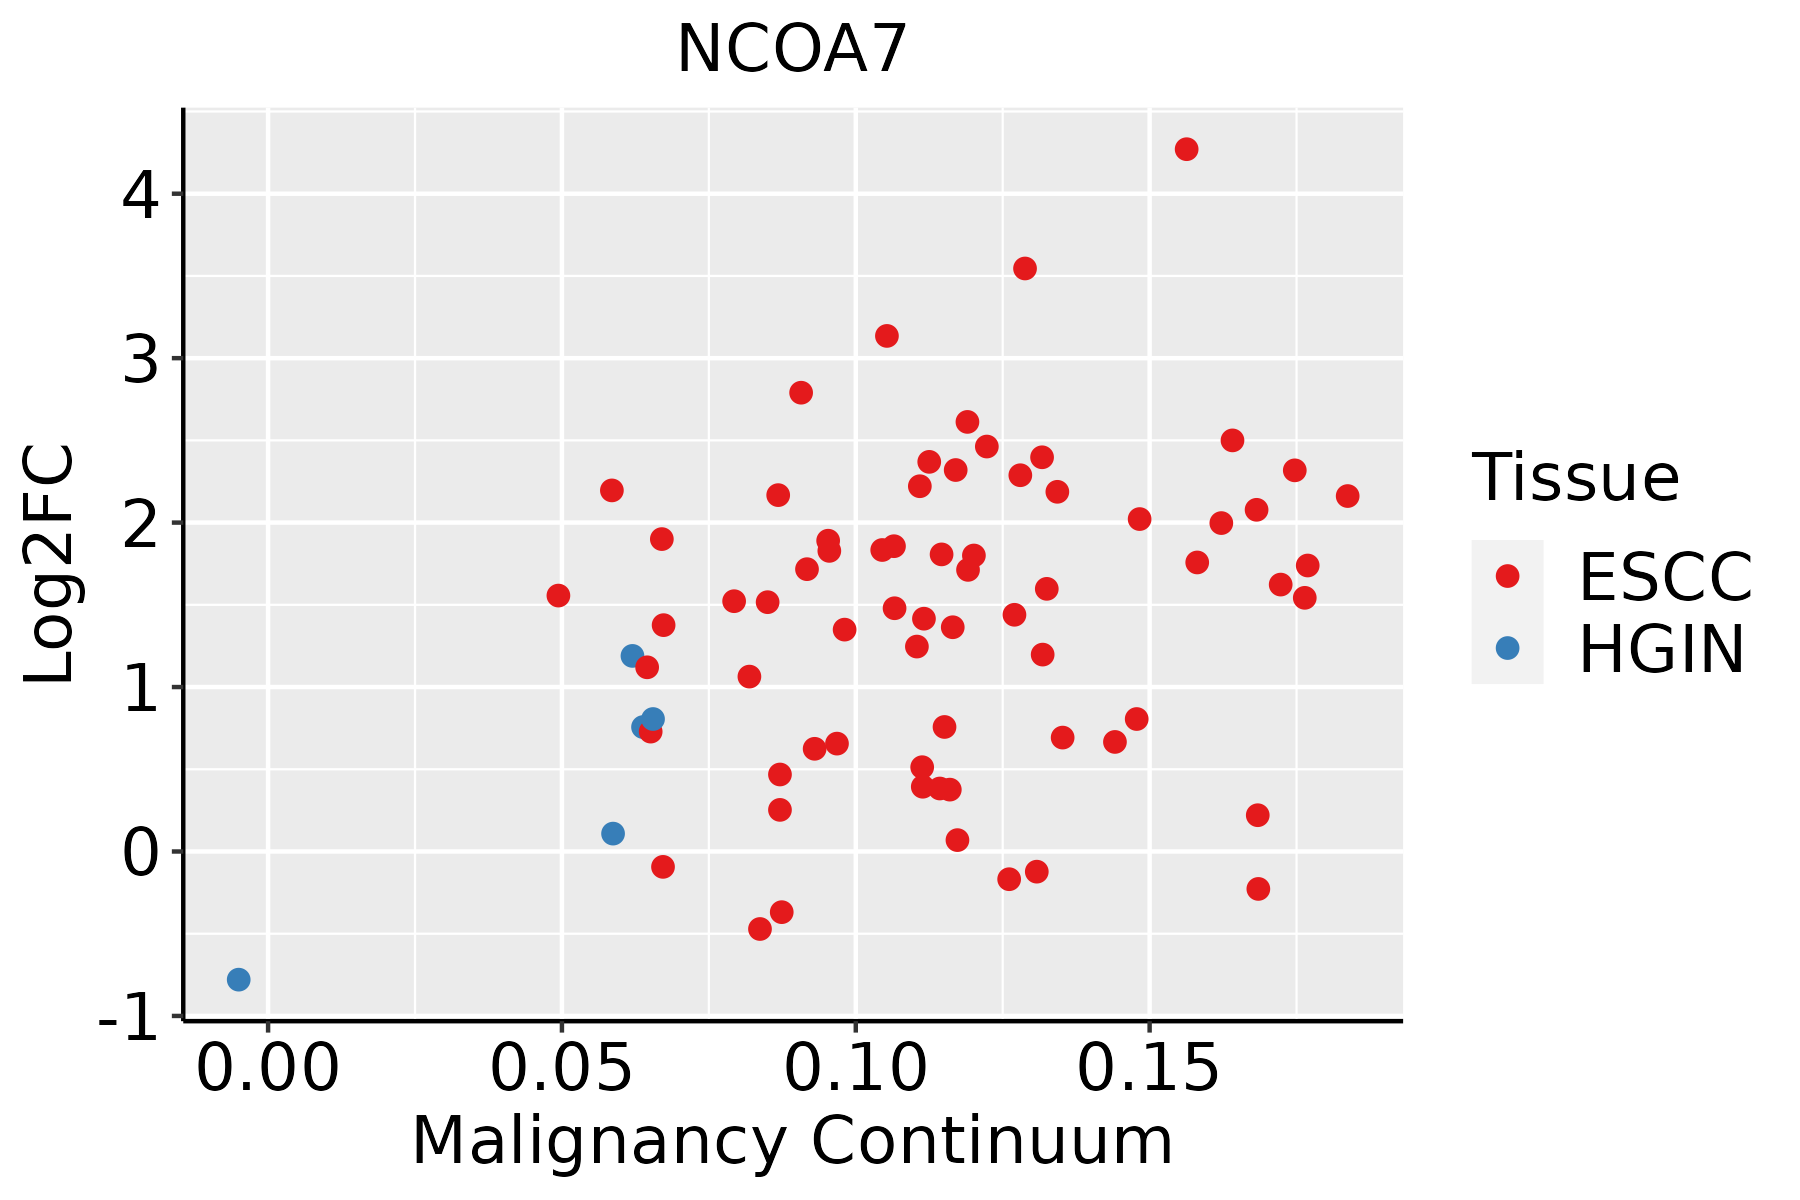 | ESCC: Esophageal squamous cell carcinoma |
| HGIN: High-grade intraepithelial neoplasias | ||
| LGIN: Low-grade intraepithelial neoplasias | ||
| GC |  | CAG: Chronic atrophic gastritis |
| CAG with IM: Chronic atrophic gastritis with intestinal metaplasia | ||
| CSG: Chronic superficial gastritis | ||
| GC: Gastric cancer | ||
| SIM: Severe intestinal metaplasia | ||
| WIM: Wild intestinal metaplasia | ||
| Liver | 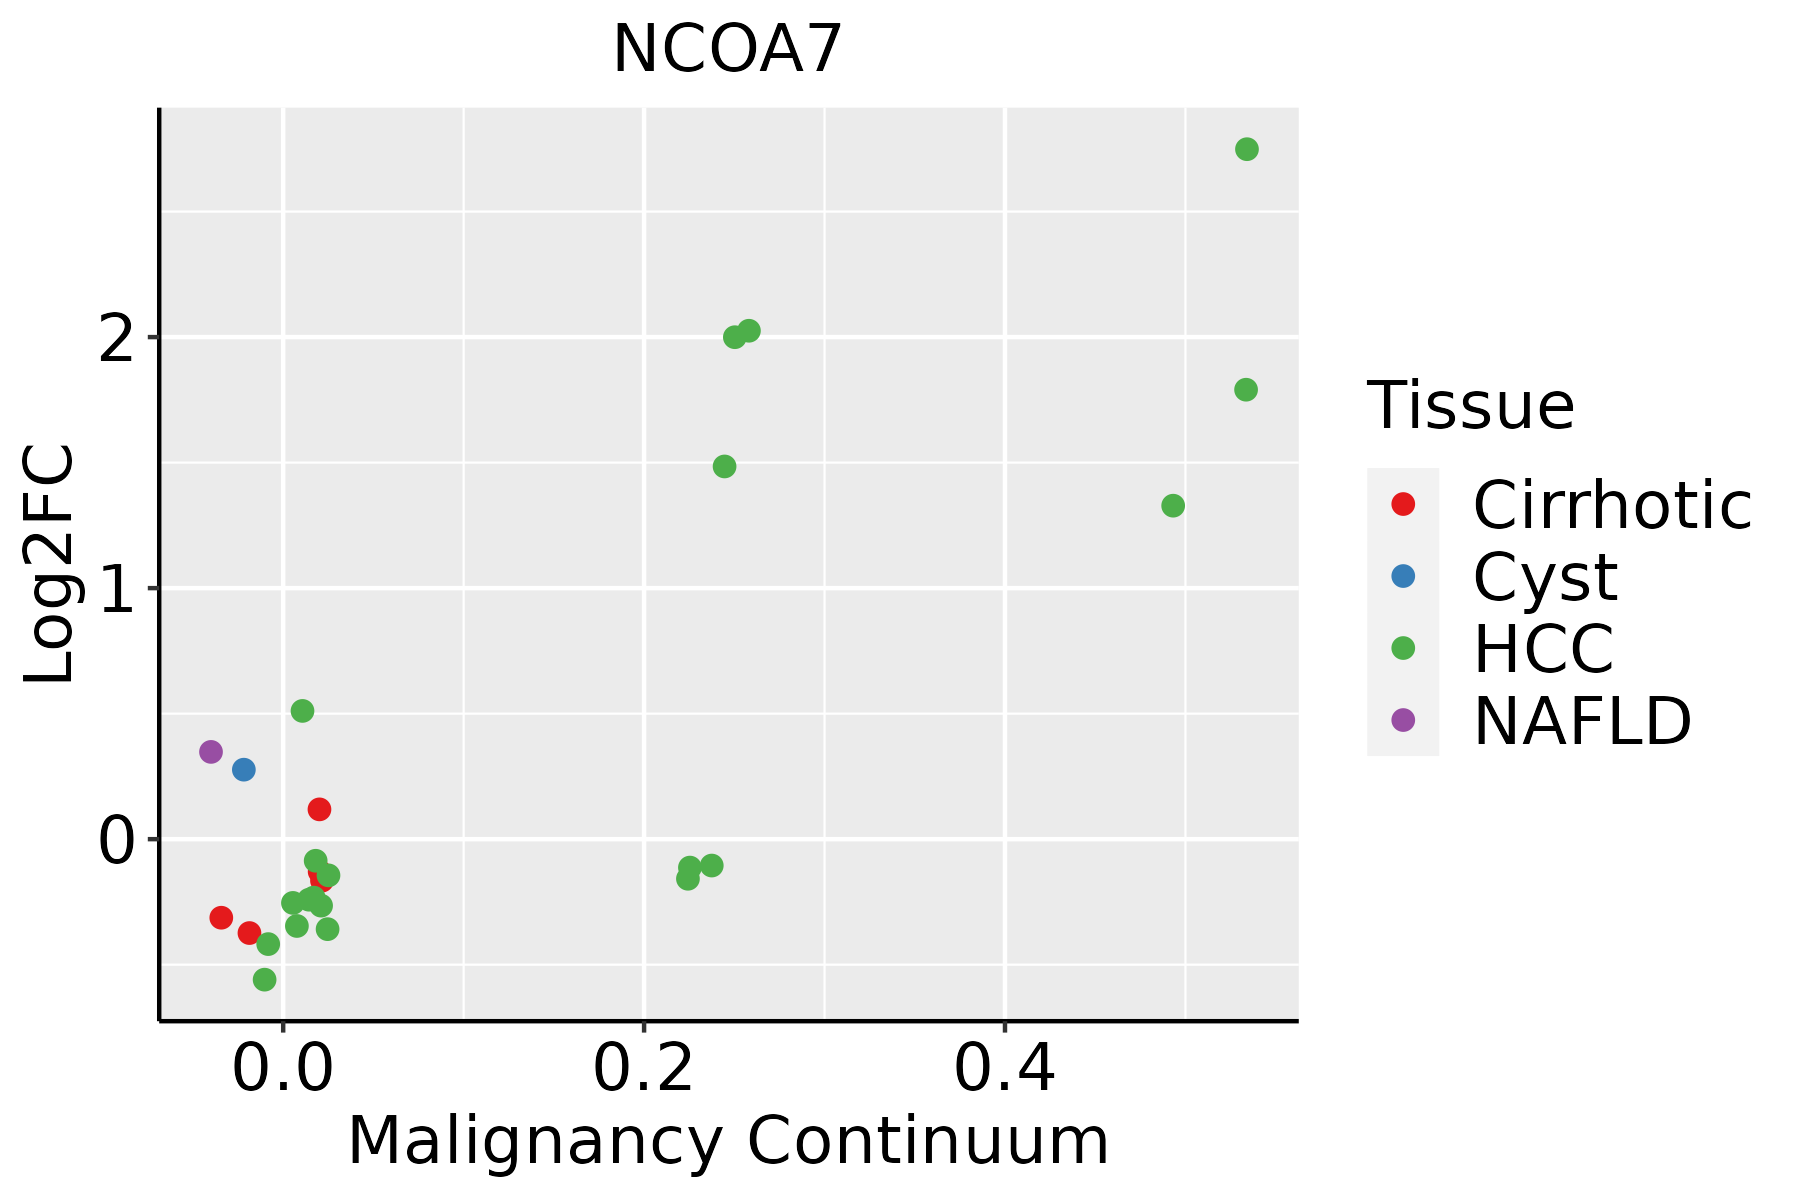 | HCC: Hepatocellular carcinoma |
| NAFLD: Non-alcoholic fatty liver disease | ||
| Lung | 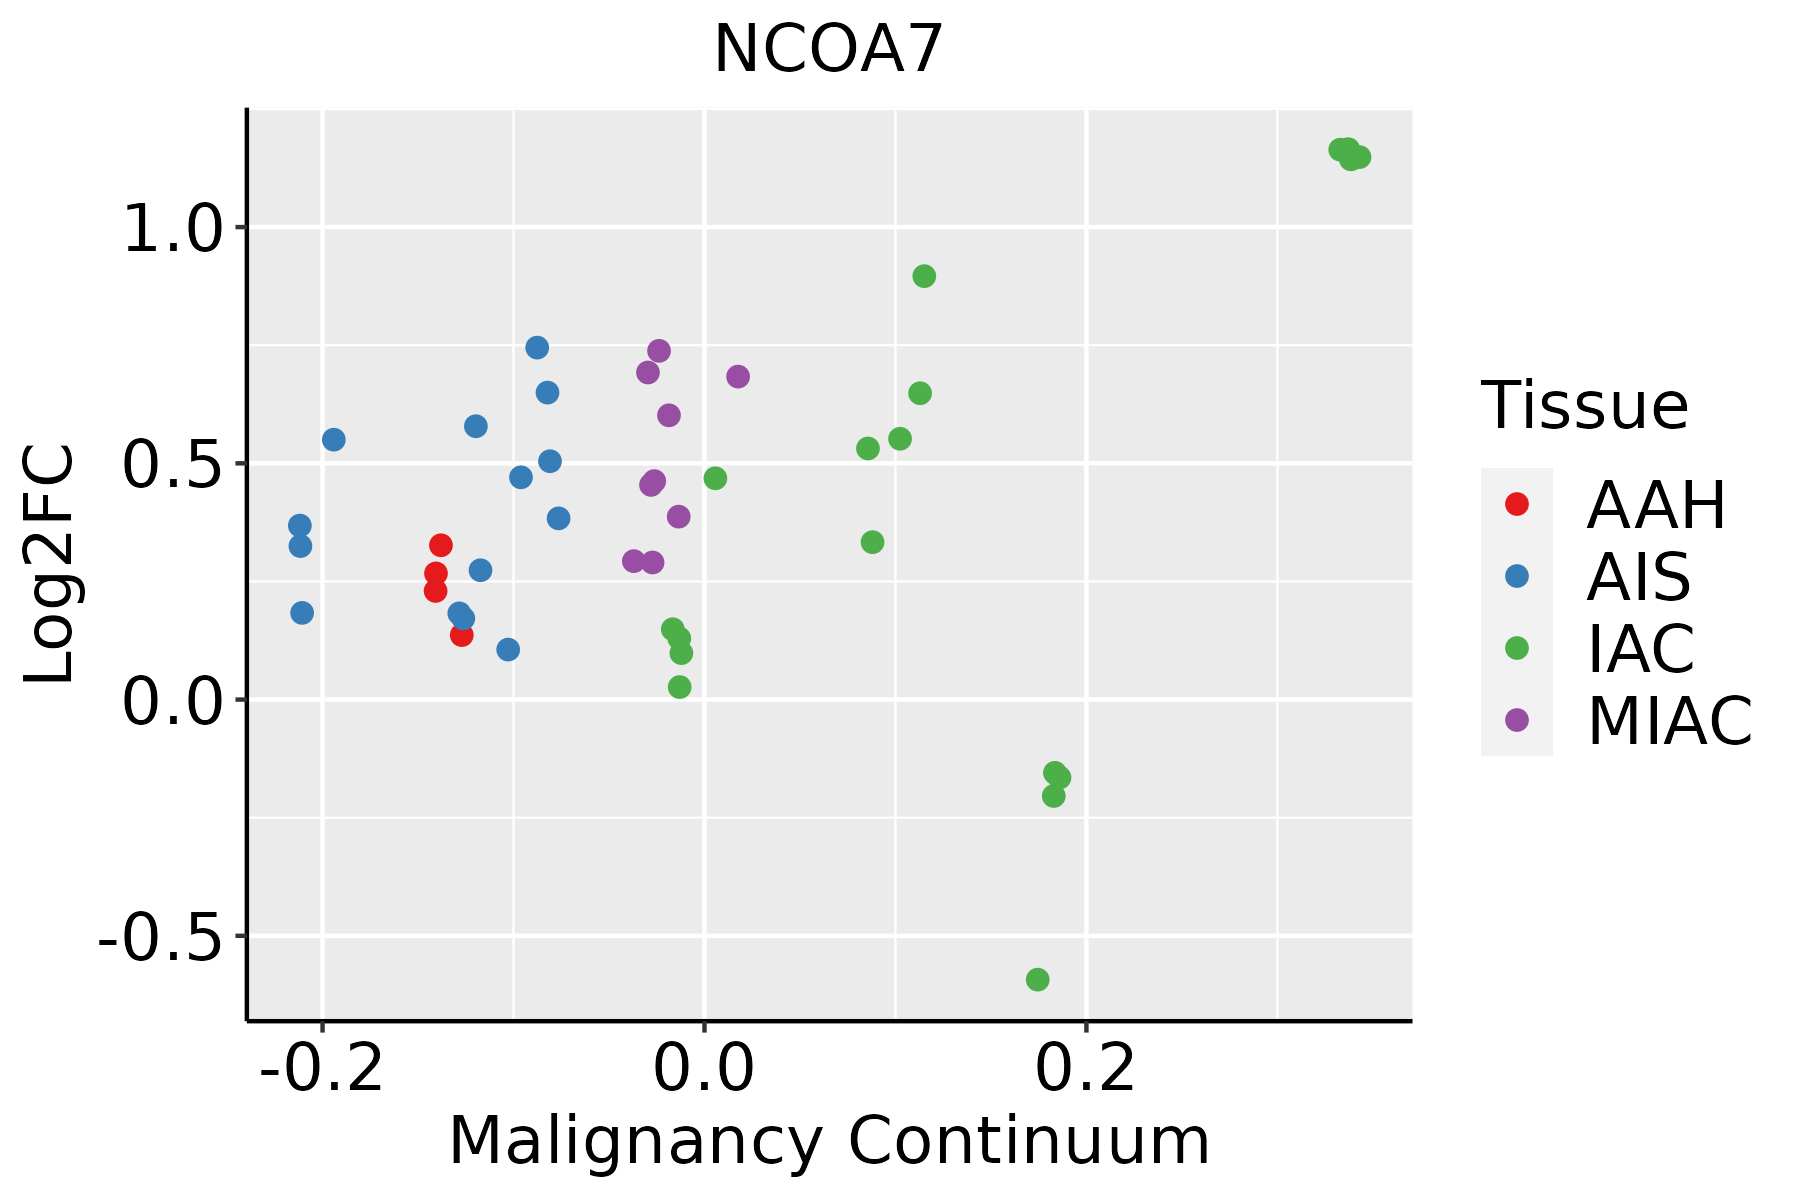 | AAH: Atypical adenomatous hyperplasia |
| AIS: Adenocarcinoma in situ | ||
| IAC: Invasive lung adenocarcinoma | ||
| MIA: Minimally invasive adenocarcinoma | ||
| Oral Cavity | 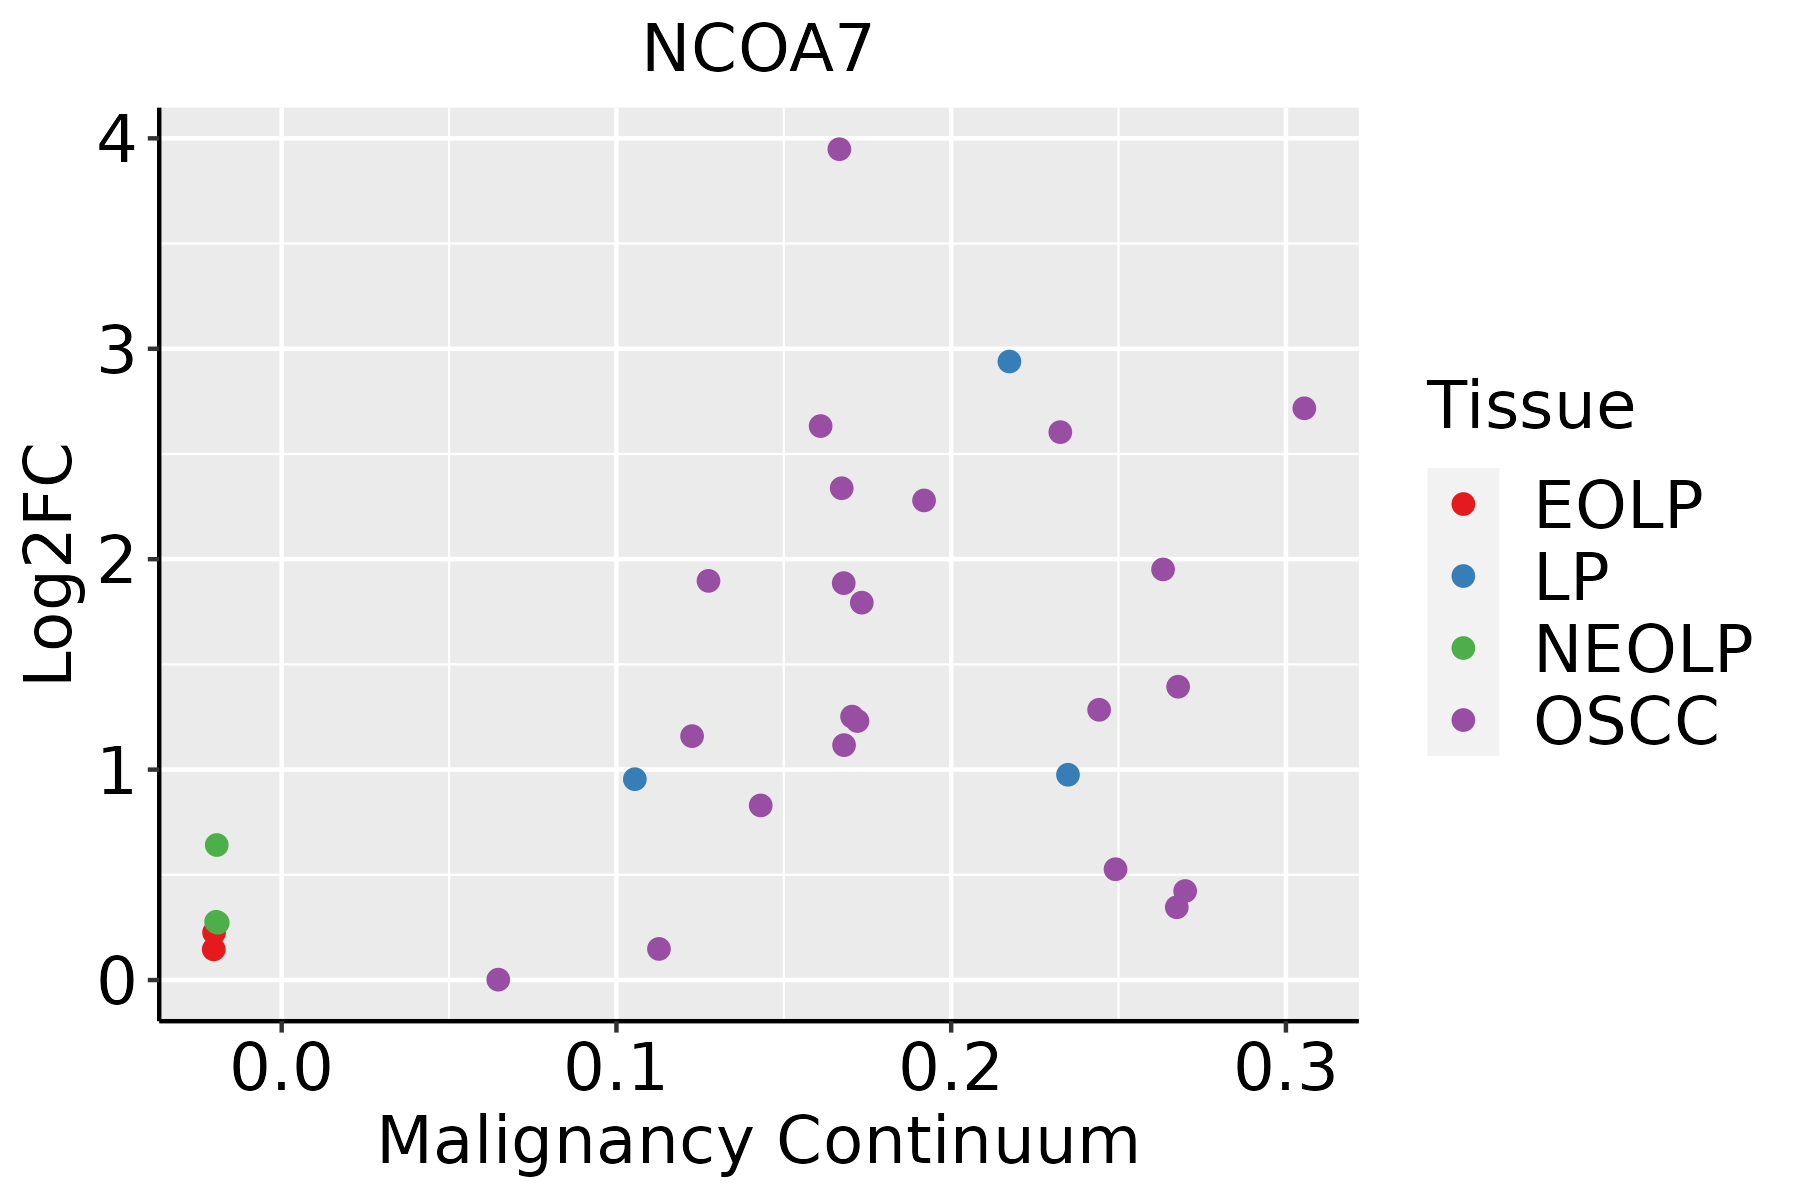 | EOLP: Erosive Oral lichen planus |
| LP: leukoplakia | ||
| NEOLP: Non-erosive oral lichen planus | ||
| OSCC: Oral squamous cell carcinoma | ||
| Prostate |  | BPH: Benign Prostatic Hyperplasia |
| Skin | 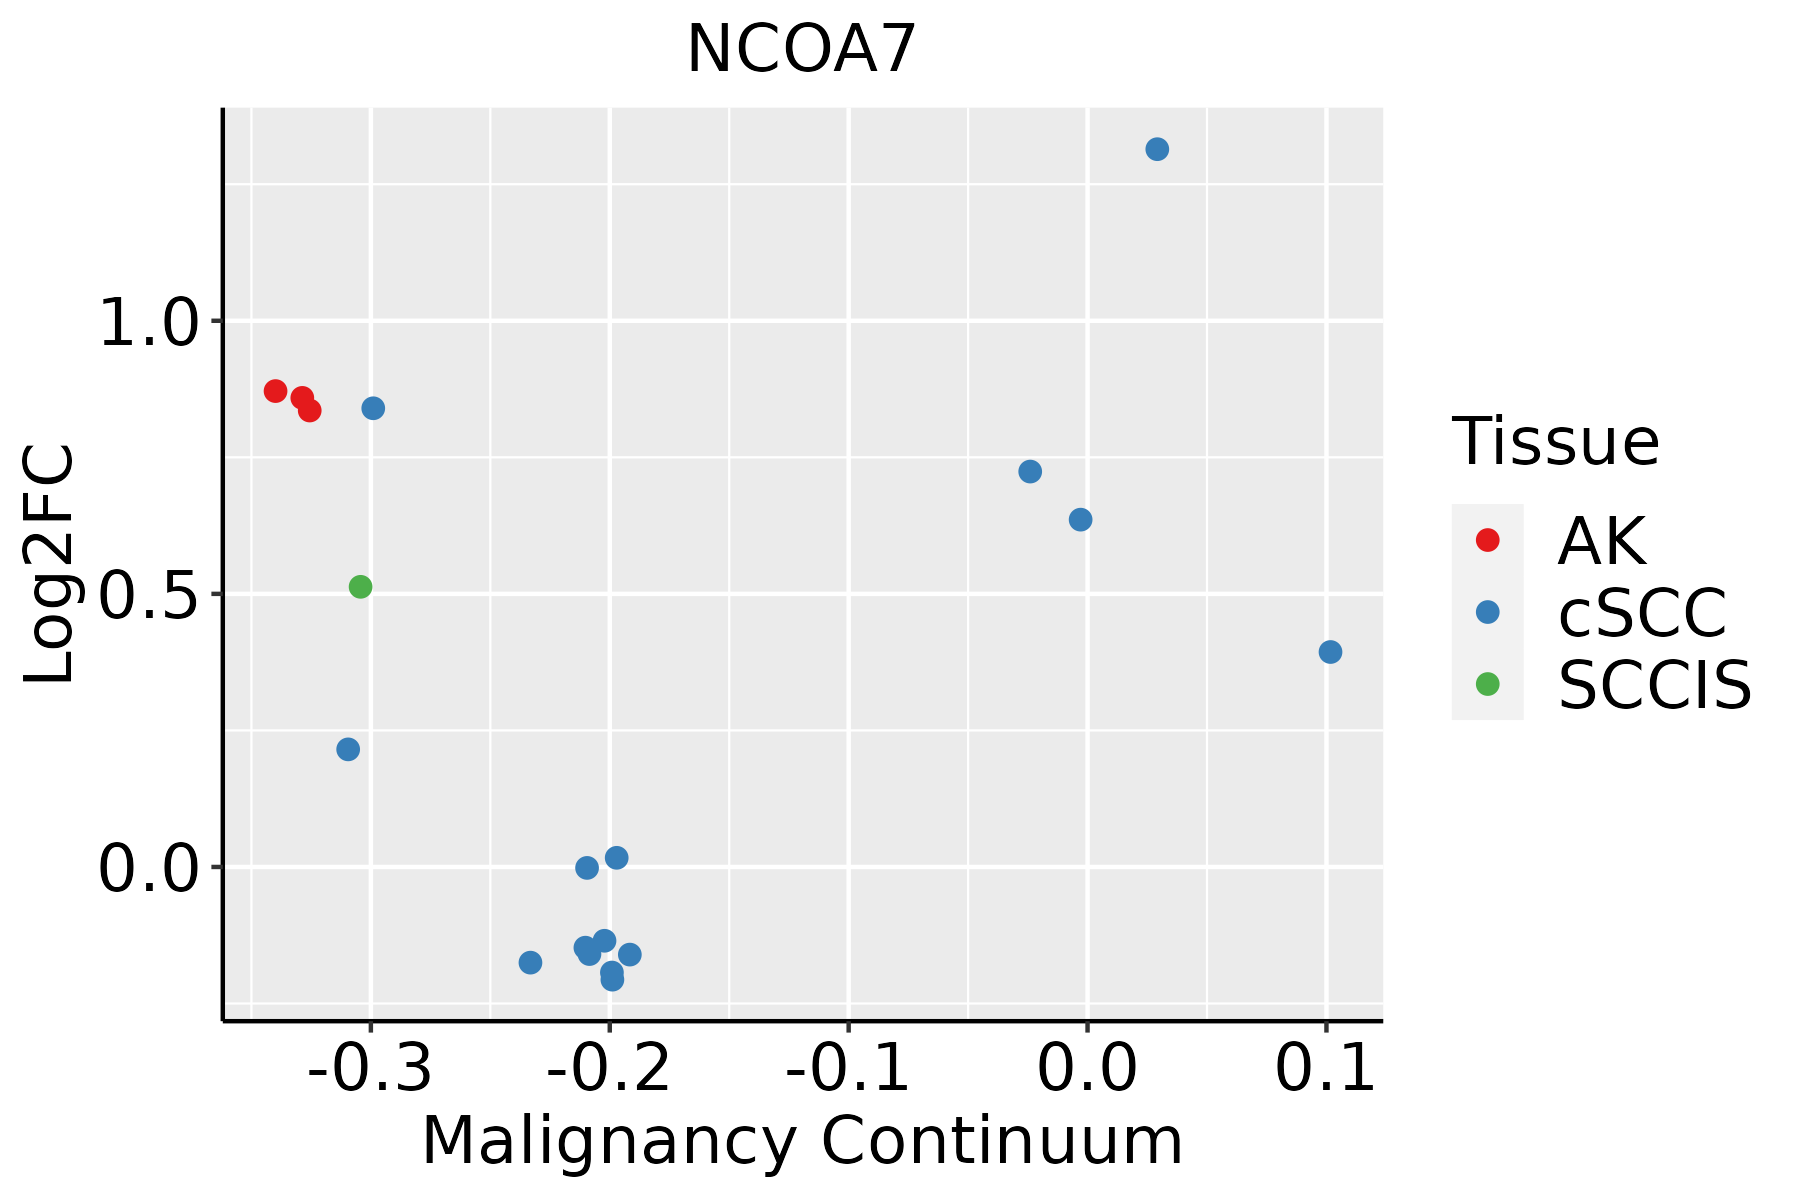 | AK: Actinic keratosis |
| cSCC: Cutaneous squamous cell carcinoma | ||
| SCCIS:squamous cell carcinoma in situ | ||
| Thyroid | 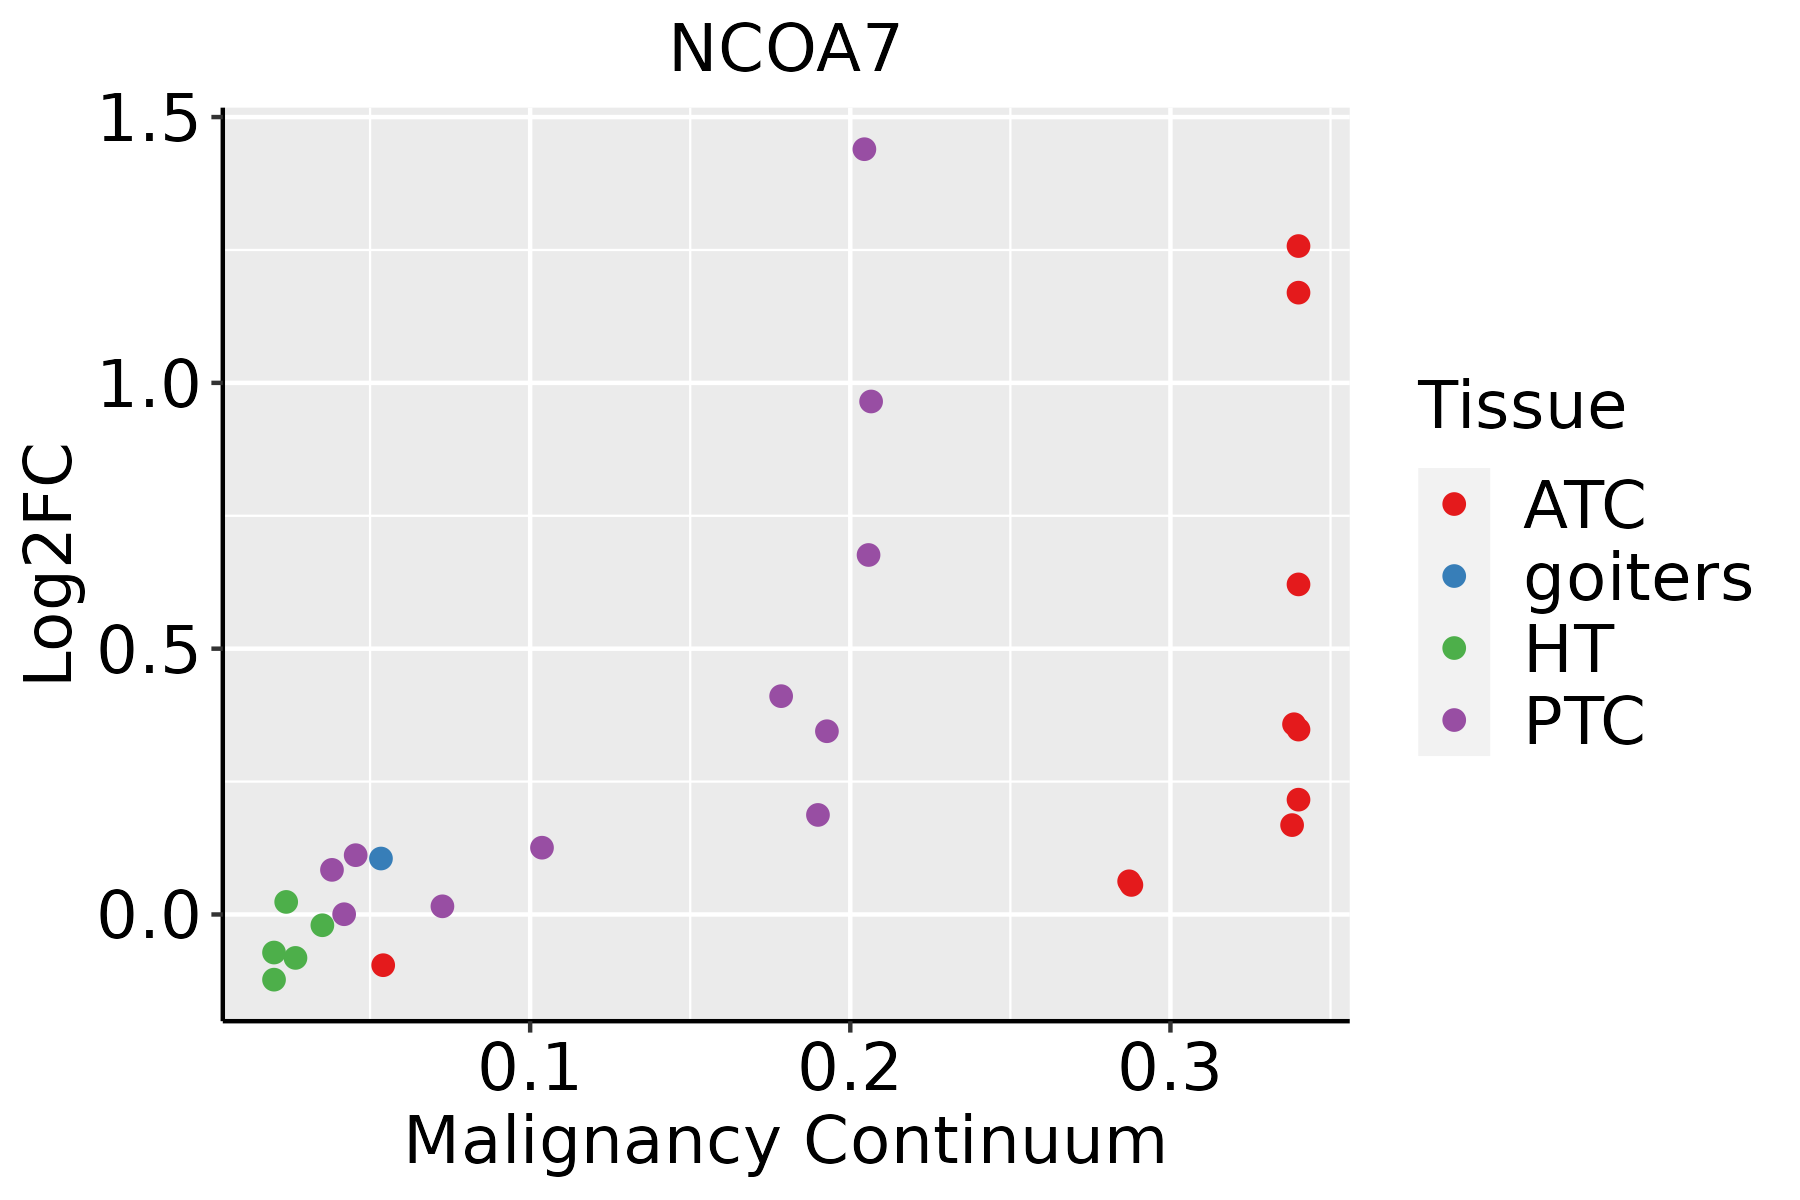 | ATC: Anaplastic thyroid cancer |
| HT: Hashimoto's thyroiditis | ||
| PTC: Papillary thyroid cancer |
| ∗log2FC in expression of this searched gene in stem-like cells from each diseased tissue sample relative to stem-like cells in normal samples in each tissue plotted against the malignancy continuum. Samples are colored based on if they are from different disease stage. |
Top |
Malignant transformation related pathway analysis |
| Find out the enriched GO biological processes and KEGG pathways involved in transition from healthy to precancer to cancer |
| Tissue | Disease Stage | Enriched GO biological Processes |
| Colorectum | AD |  |
| Colorectum | SER |  |
| Colorectum | MSS |  |
| Colorectum | MSI-H |  |
| Colorectum | FAP |  |
| ∗Top 15 enriched GO BP terms are showed in the bar plot of each disease state in each tissue. Each row represents a significant GO biological process which is colored according to the -log10(p.adjust). |
| Page: 1 2 3 4 5 6 7 8 9 |
| GO ID | Tissue | Disease Stage | Description | Gene Ratio | Bg Ratio | pvalue | p.adjust | Count |
| GO:000697910 | Cervix | CC | response to oxidative stress | 102/2311 | 446/18723 | 2.99e-10 | 4.36e-08 | 102 |
| GO:006219710 | Cervix | CC | cellular response to chemical stress | 76/2311 | 337/18723 | 1.01e-07 | 5.25e-06 | 76 |
| GO:003459910 | Cervix | CC | cellular response to oxidative stress | 63/2311 | 288/18723 | 3.58e-06 | 9.50e-05 | 63 |
| GO:007099710 | Cervix | CC | neuron death | 70/2311 | 361/18723 | 7.50e-05 | 1.03e-03 | 70 |
| GO:190121410 | Cervix | CC | regulation of neuron death | 61/2311 | 319/18723 | 3.11e-04 | 3.31e-03 | 61 |
| GO:00170143 | Cervix | CC | protein nitrosylation | 7/2311 | 16/18723 | 1.79e-03 | 1.34e-02 | 7 |
| GO:00181193 | Cervix | CC | peptidyl-cysteine S-nitrosylation | 7/2311 | 16/18723 | 1.79e-03 | 1.34e-02 | 7 |
| GO:003647310 | Cervix | CC | cell death in response to oxidative stress | 21/2311 | 95/18723 | 5.32e-03 | 3.10e-02 | 21 |
| GO:0006979111 | Esophagus | ESCC | response to oxidative stress | 303/8552 | 446/18723 | 7.15e-22 | 1.30e-19 | 303 |
| GO:0062197111 | Esophagus | ESCC | cellular response to chemical stress | 234/8552 | 337/18723 | 5.37e-19 | 5.97e-17 | 234 |
| GO:0034599111 | Esophagus | ESCC | cellular response to oxidative stress | 197/8552 | 288/18723 | 3.76e-15 | 2.15e-13 | 197 |
| GO:0070997111 | Esophagus | ESCC | neuron death | 216/8552 | 361/18723 | 3.49e-08 | 6.45e-07 | 216 |
| GO:1901214111 | Esophagus | ESCC | regulation of neuron death | 186/8552 | 319/18723 | 3.35e-06 | 3.73e-05 | 186 |
| GO:003647320 | Esophagus | ESCC | cell death in response to oxidative stress | 59/8552 | 95/18723 | 9.12e-04 | 4.65e-03 | 59 |
| GO:190121516 | Esophagus | ESCC | negative regulation of neuron death | 115/8552 | 208/18723 | 3.24e-03 | 1.34e-02 | 115 |
| GO:190288220 | Esophagus | ESCC | regulation of response to oxidative stress | 58/8552 | 98/18723 | 4.86e-03 | 1.88e-02 | 58 |
| GO:190320316 | Esophagus | ESCC | regulation of oxidative stress-induced neuron death | 19/8552 | 27/18723 | 8.35e-03 | 2.95e-02 | 19 |
| GO:190040720 | Esophagus | ESCC | regulation of cellular response to oxidative stress | 52/8552 | 89/18723 | 1.04e-02 | 3.56e-02 | 52 |
| GO:190320120 | Esophagus | ESCC | regulation of oxidative stress-induced cell death | 44/8552 | 74/18723 | 1.18e-02 | 3.94e-02 | 44 |
| GO:00069797 | Liver | NAFLD | response to oxidative stress | 78/1882 | 446/18723 | 7.85e-07 | 4.29e-05 | 78 |
| Page: 1 2 3 4 5 6 7 8 9 10 11 12 13 14 |
| Pathway ID | Tissue | Disease Stage | Description | Gene Ratio | Bg Ratio | pvalue | p.adjust | qvalue | Count |
| hsa0414222 | Esophagus | ESCC | Lysosome | 102/4205 | 132/8465 | 5.11e-11 | 7.13e-10 | 3.65e-10 | 102 |
| hsa0414232 | Esophagus | ESCC | Lysosome | 102/4205 | 132/8465 | 5.11e-11 | 7.13e-10 | 3.65e-10 | 102 |
| hsa041424 | Liver | Cirrhotic | Lysosome | 68/2530 | 132/8465 | 1.34e-07 | 1.97e-06 | 1.21e-06 | 68 |
| hsa0414211 | Liver | Cirrhotic | Lysosome | 68/2530 | 132/8465 | 1.34e-07 | 1.97e-06 | 1.21e-06 | 68 |
| hsa041422 | Liver | HCC | Lysosome | 100/4020 | 132/8465 | 2.32e-11 | 4.31e-10 | 2.40e-10 | 100 |
| hsa041423 | Liver | HCC | Lysosome | 100/4020 | 132/8465 | 2.32e-11 | 4.31e-10 | 2.40e-10 | 100 |
| hsa041425 | Oral cavity | OSCC | Lysosome | 87/3704 | 132/8465 | 1.97e-07 | 1.35e-06 | 6.86e-07 | 87 |
| hsa0414212 | Oral cavity | OSCC | Lysosome | 87/3704 | 132/8465 | 1.97e-07 | 1.35e-06 | 6.86e-07 | 87 |
| hsa0414221 | Oral cavity | LP | Lysosome | 67/2418 | 132/8465 | 5.13e-08 | 7.77e-07 | 5.01e-07 | 67 |
| hsa0414231 | Oral cavity | LP | Lysosome | 67/2418 | 132/8465 | 5.13e-08 | 7.77e-07 | 5.01e-07 | 67 |
| Page: 1 |
Top |
Cell-cell communication analysis |
| Identification of potential cell-cell interactions between two cell types and their ligand-receptor pairs for different disease states |
| Ligand | Receptor | LRpair | Pathway | Tissue | Disease Stage |
| Page: 1 |
Top |
Single-cell gene regulatory network inference analysis |
| Find out the significant the regulons (TFs) and the target genes of each regulon across cell types for different disease states |
| TF | Cell Type | Tissue | Disease Stage | Target Gene | RSS | Regulon Activity |
| ∗The dot plots of a searched regulon are shown for all cell subpopulations in each disease state of each tissue based on the regulon specific score inferred using pySCENIC and by calculating the average expression. |
| Page: 1 |
Top |
Somatic mutation of malignant transformation related genes |
| Annotation of somatic variants for genes involved in malignant transformation |
| Hugo Symbol | Variant Class | Variant Classification | dbSNP RS | HGVSc | HGVSp | HGVSp Short | SWISSPROT | BIOTYPE | SIFT | PolyPhen | Tumor Sample Barcode | Tissue | Histology | Sex | Age | Stage | Therapy Types | Drugs | Outcome |
| NCOA7 | SNV | Missense_Mutation | rs767033570 | c.1327N>A | p.Asp443Asn | p.D443N | Q8NI08 | protein_coding | tolerated_low_confidence(0.07) | benign(0.006) | TCGA-AC-A6IX-01 | Breast | breast invasive carcinoma | Female | <65 | III/IV | Unknown | Unknown | SD |
| NCOA7 | SNV | Missense_Mutation | c.2407N>A | p.Pro803Thr | p.P803T | Q8NI08 | protein_coding | deleterious(0) | probably_damaging(0.982) | TCGA-BH-A18G-01 | Breast | breast invasive carcinoma | Female | >=65 | I/II | Unknown | Unknown | SD | |
| NCOA7 | SNV | Missense_Mutation | c.580N>A | p.Asp194Asn | p.D194N | Q8NI08 | protein_coding | tolerated(0.06) | possibly_damaging(0.788) | TCGA-D8-A27G-01 | Breast | breast invasive carcinoma | Female | >=65 | I/II | Unknown | Unknown | SD | |
| NCOA7 | insertion | Nonsense_Mutation | novel | c.1113_1114insTGAGACGTGCATGTGAGAACCAGGATC | p.Leu371_Lys372insTer | p.L371_K372ins* | Q8NI08 | protein_coding | TCGA-AR-A0TY-01 | Breast | breast invasive carcinoma | Female | <65 | I/II | Unspecific | Paclitaxel | PD | ||
| NCOA7 | deletion | Frame_Shift_Del | c.242delN | p.Arg81LeufsTer4 | p.R81Lfs*4 | Q8NI08 | protein_coding | TCGA-EW-A2FV-01 | Breast | breast invasive carcinoma | Female | <65 | III/IV | Chemotherapy | docetaxel | SD | |||
| NCOA7 | SNV | Missense_Mutation | c.2767G>A | p.Asp923Asn | p.D923N | Q8NI08 | protein_coding | tolerated(0.15) | probably_damaging(0.999) | TCGA-IR-A3LA-01 | Cervix | cervical & endocervical cancer | Female | <65 | I/II | Chemotherapy | cisplatin | CR | |
| NCOA7 | SNV | Missense_Mutation | novel | c.2747C>G | p.Ser916Cys | p.S916C | Q8NI08 | protein_coding | deleterious(0.03) | benign(0.159) | TCGA-VS-A9U7-01 | Cervix | cervical & endocervical cancer | Female | <65 | I/II | Chemotherapy | cisplatin | CR |
| NCOA7 | SNV | Missense_Mutation | c.1415N>T | p.Thr472Ile | p.T472I | Q8NI08 | protein_coding | tolerated_low_confidence(0.21) | benign(0.021) | TCGA-AA-3710-01 | Colorectum | colon adenocarcinoma | Female | >=65 | I/II | Unknown | Unknown | SD | |
| NCOA7 | SNV | Missense_Mutation | c.2612N>G | p.His871Arg | p.H871R | Q8NI08 | protein_coding | deleterious(0.01) | benign(0.079) | TCGA-AA-3811-01 | Colorectum | colon adenocarcinoma | Female | >=65 | III/IV | Unknown | Unknown | PD | |
| NCOA7 | SNV | Missense_Mutation | c.2320N>T | p.Pro774Ser | p.P774S | Q8NI08 | protein_coding | deleterious(0) | probably_damaging(0.958) | TCGA-D5-6928-01 | Colorectum | colon adenocarcinoma | Male | >=65 | I/II | Unknown | Unknown | SD |
| Page: 1 2 3 4 5 6 7 8 9 10 |
Top |
Related drugs of malignant transformation related genes |
| Identification of chemicals and drugs interact with genes involved in malignant transfromation |
| (DGIdb 4.0) |
| Entrez ID | Symbol | Category | Interaction Types | Drug Claim Name | Drug Name | PMIDs |
| Page: 1 |

Copyright 2023-Present -The University of Texas Health Science Center at Houston |