
|
|||||
|
 | |
| |
| |
| |
| |
| |
|
Gene: NCOA4 |
Gene summary for NCOA4 |
| Gene information | Species | Human | Gene symbol | NCOA4 | Gene ID | 8031 |
| Gene name | nuclear receptor coactivator 4 | |
| Gene Alias | ARA70 | |
| Cytomap | 10q11.22 | |
| Gene Type | protein-coding | GO ID | GO:0000003 | UniProtAcc | Q13772 |
Top |
Malignant transformation analysis |
| Identification of the aberrant gene expression in precancerous and cancerous lesions by comparing the gene expression of stem-like cells in diseased tissues with normal stem cells |
| Entrez ID | Symbol | Replicates | Species | Organ | Tissue | Adj P-value | Log2FC | Malignancy |
| 8031 | NCOA4 | HTA11_78_2000001011 | Human | Colorectum | AD | 3.08e-03 | 4.03e-01 | -0.1088 |
| 8031 | NCOA4 | HTA11_347_2000001011 | Human | Colorectum | AD | 1.42e-08 | 4.33e-01 | -0.1954 |
| 8031 | NCOA4 | HTA11_99999970781_79442 | Human | Colorectum | MSS | 4.89e-06 | 3.82e-01 | 0.294 |
| 8031 | NCOA4 | HTA11_99999965104_69814 | Human | Colorectum | MSS | 3.25e-03 | 4.40e-01 | 0.281 |
| 8031 | NCOA4 | A002-C-201 | Human | Colorectum | FAP | 4.66e-02 | -1.40e-01 | 0.0324 |
| 8031 | NCOA4 | A002-C-205 | Human | Colorectum | FAP | 5.49e-03 | -1.44e-01 | -0.1236 |
| 8031 | NCOA4 | A014-C-008 | Human | Colorectum | FAP | 1.08e-03 | -2.16e-01 | -0.191 |
| 8031 | NCOA4 | LZE2T | Human | Esophagus | ESCC | 3.56e-02 | 3.61e-01 | 0.082 |
| 8031 | NCOA4 | LZE4T | Human | Esophagus | ESCC | 9.70e-15 | 4.96e-01 | 0.0811 |
| 8031 | NCOA4 | LZE5T | Human | Esophagus | ESCC | 7.99e-05 | 7.00e-01 | 0.0514 |
| 8031 | NCOA4 | LZE7T | Human | Esophagus | ESCC | 3.40e-03 | 3.35e-02 | 0.0667 |
| 8031 | NCOA4 | LZE8T | Human | Esophagus | ESCC | 7.28e-13 | 5.06e-01 | 0.067 |
| 8031 | NCOA4 | LZE20T | Human | Esophagus | ESCC | 2.45e-04 | 8.44e-02 | 0.0662 |
| 8031 | NCOA4 | LZE24T | Human | Esophagus | ESCC | 8.12e-19 | 6.06e-01 | 0.0596 |
| 8031 | NCOA4 | LZE21T | Human | Esophagus | ESCC | 8.05e-04 | 1.36e-01 | 0.0655 |
| 8031 | NCOA4 | P1T-E | Human | Esophagus | ESCC | 2.74e-05 | 3.90e-01 | 0.0875 |
| 8031 | NCOA4 | P2T-E | Human | Esophagus | ESCC | 1.63e-20 | 4.60e-01 | 0.1177 |
| 8031 | NCOA4 | P4T-E | Human | Esophagus | ESCC | 7.60e-15 | 2.56e-01 | 0.1323 |
| 8031 | NCOA4 | P5T-E | Human | Esophagus | ESCC | 5.96e-10 | 1.38e-01 | 0.1327 |
| 8031 | NCOA4 | P8T-E | Human | Esophagus | ESCC | 4.61e-21 | 5.47e-01 | 0.0889 |
| Page: 1 2 3 4 5 6 7 8 |
| Tissue | Expression Dynamics | Abbreviation |
| Colorectum (GSE201348) |  | FAP: Familial adenomatous polyposis |
| CRC: Colorectal cancer | ||
| Colorectum (HTA11) |  | AD: Adenomas |
| SER: Sessile serrated lesions | ||
| MSI-H: Microsatellite-high colorectal cancer | ||
| MSS: Microsatellite stable colorectal cancer | ||
| Esophagus |  | ESCC: Esophageal squamous cell carcinoma |
| HGIN: High-grade intraepithelial neoplasias | ||
| LGIN: Low-grade intraepithelial neoplasias | ||
| Liver | 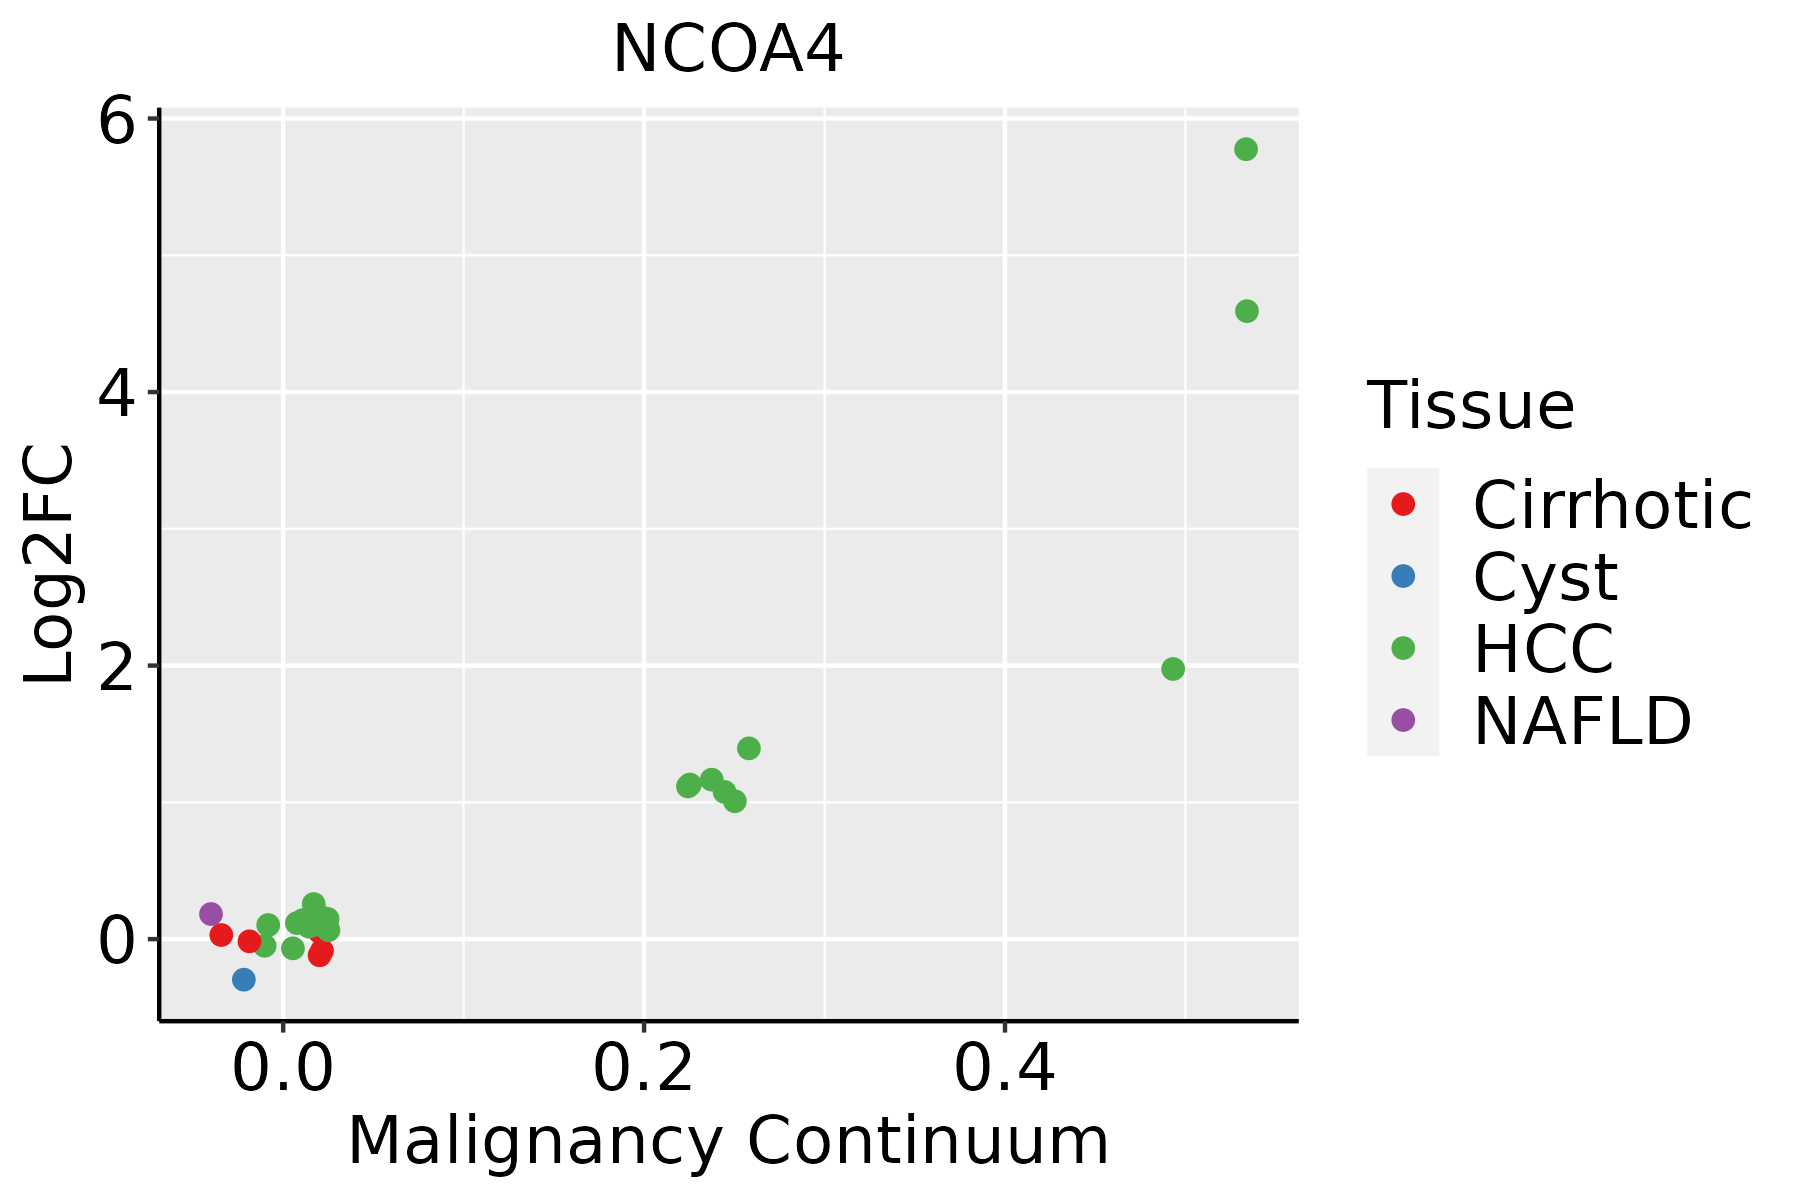 | HCC: Hepatocellular carcinoma |
| NAFLD: Non-alcoholic fatty liver disease | ||
| Lung |  | AAH: Atypical adenomatous hyperplasia |
| AIS: Adenocarcinoma in situ | ||
| IAC: Invasive lung adenocarcinoma | ||
| MIA: Minimally invasive adenocarcinoma | ||
| Oral Cavity |  | EOLP: Erosive Oral lichen planus |
| LP: leukoplakia | ||
| NEOLP: Non-erosive oral lichen planus | ||
| OSCC: Oral squamous cell carcinoma | ||
| Prostate | 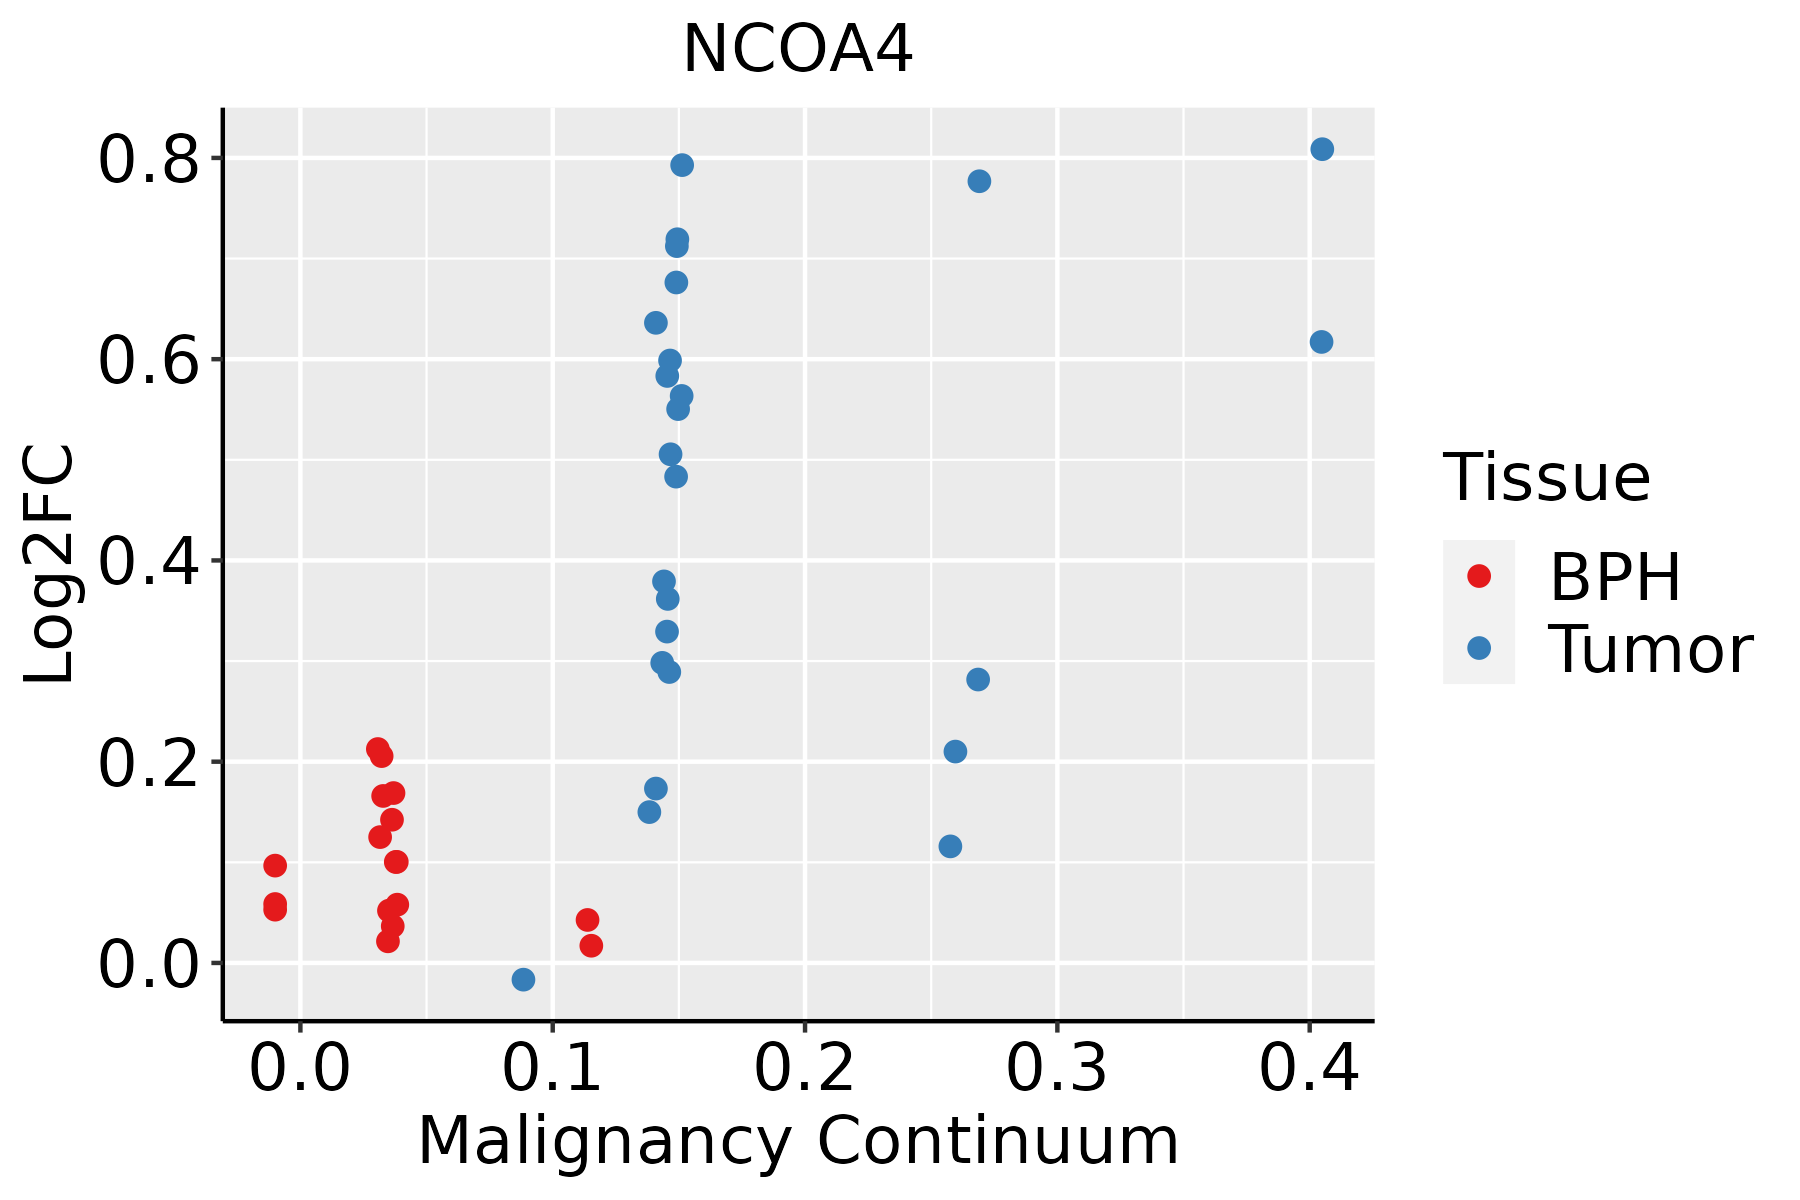 | BPH: Benign Prostatic Hyperplasia |
| Skin | 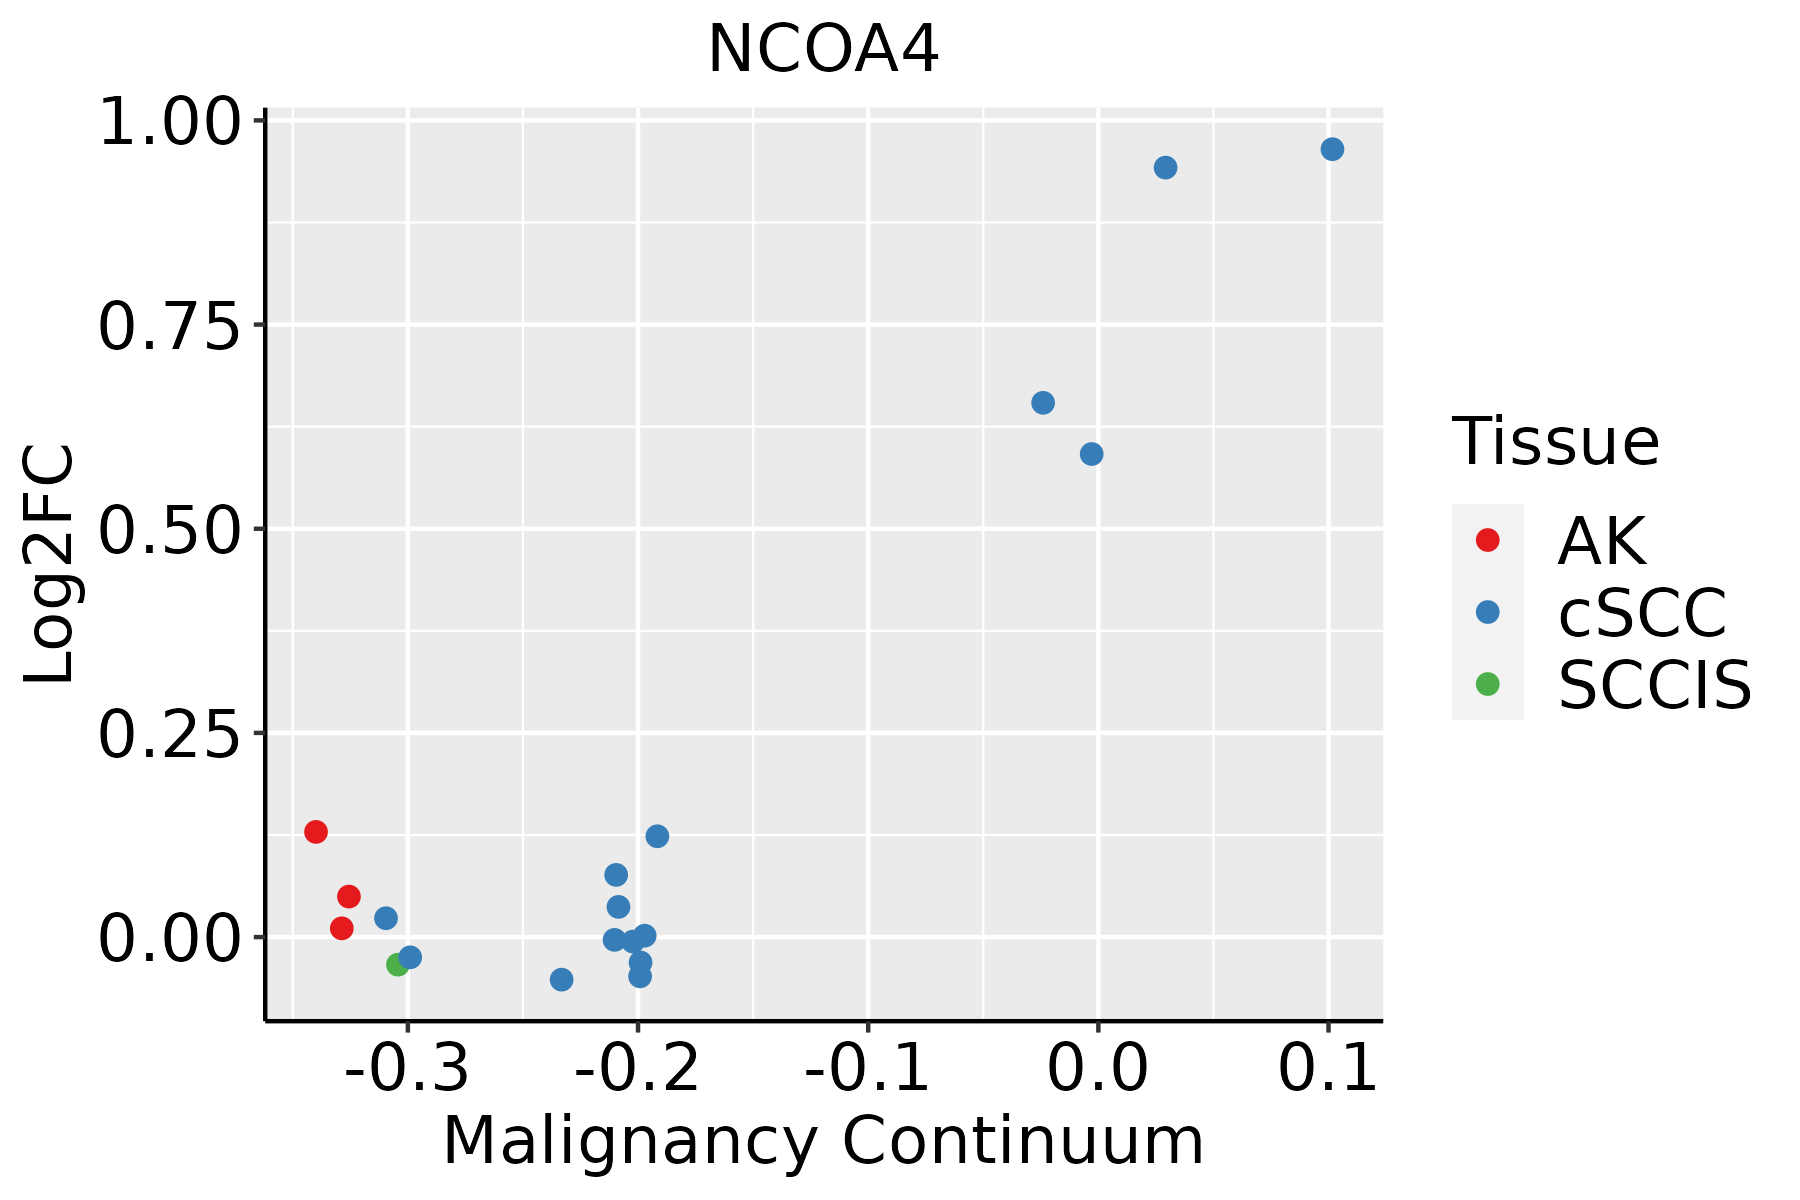 | AK: Actinic keratosis |
| cSCC: Cutaneous squamous cell carcinoma | ||
| SCCIS:squamous cell carcinoma in situ | ||
| Thyroid | 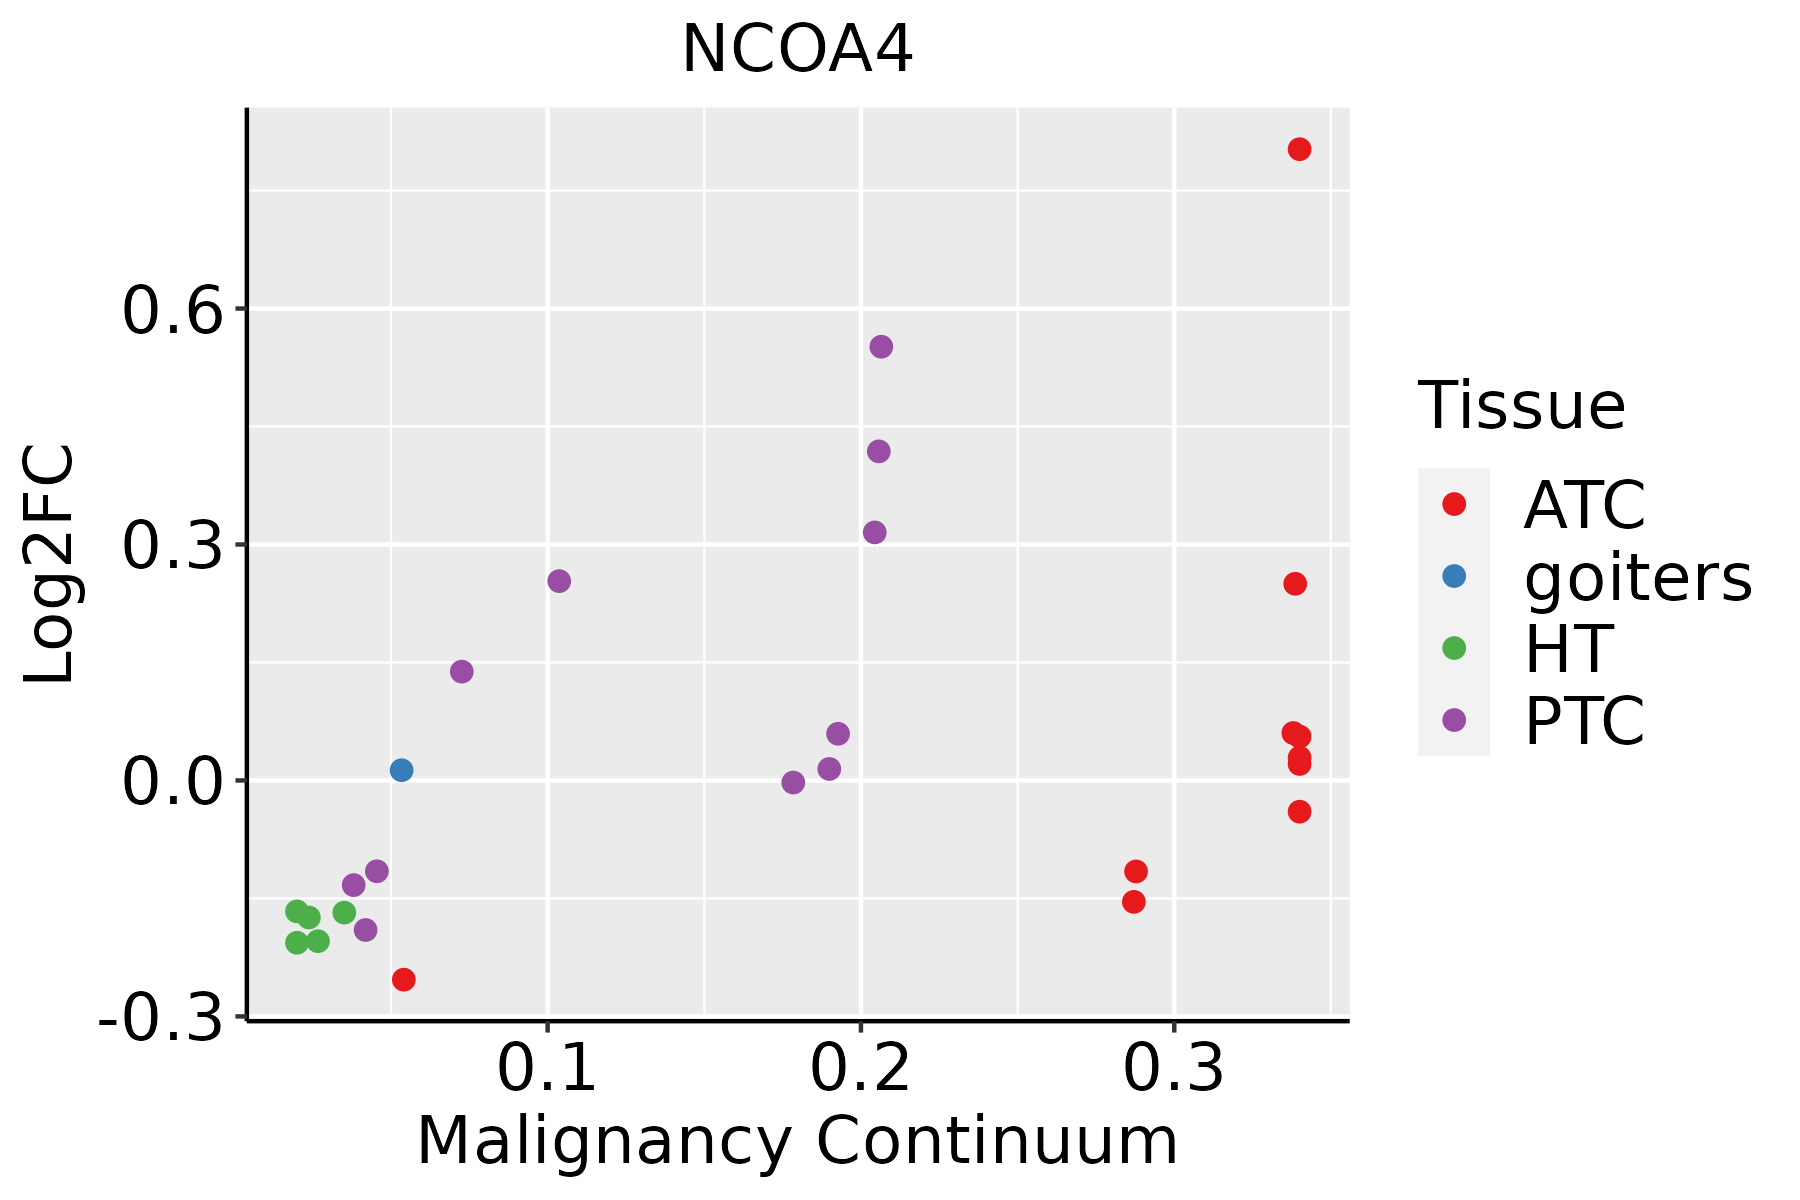 | ATC: Anaplastic thyroid cancer |
| HT: Hashimoto's thyroiditis | ||
| PTC: Papillary thyroid cancer |
| ∗log2FC in expression of this searched gene in stem-like cells from each diseased tissue sample relative to stem-like cells in normal samples in each tissue plotted against the malignancy continuum. Samples are colored based on if they are from different disease stage. |
Top |
Malignant transformation related pathway analysis |
| Find out the enriched GO biological processes and KEGG pathways involved in transition from healthy to precancer to cancer |
| Tissue | Disease Stage | Enriched GO biological Processes |
| Colorectum | AD |  |
| Colorectum | SER |  |
| Colorectum | MSS |  |
| Colorectum | MSI-H |  |
| Colorectum | FAP |  |
| ∗Top 15 enriched GO BP terms are showed in the bar plot of each disease state in each tissue. Each row represents a significant GO biological process which is colored according to the -log10(p.adjust). |
| Page: 1 2 3 4 5 6 7 8 9 |
| GO ID | Tissue | Disease Stage | Description | Gene Ratio | Bg Ratio | pvalue | p.adjust | Count |
| GO:0072594 | Colorectum | AD | establishment of protein localization to organelle | 148/3918 | 422/18723 | 7.95e-12 | 1.04e-09 | 148 |
| GO:0006605 | Colorectum | AD | protein targeting | 105/3918 | 314/18723 | 1.39e-07 | 6.44e-06 | 105 |
| GO:0007034 | Colorectum | AD | vacuolar transport | 60/3918 | 157/18723 | 4.97e-07 | 1.85e-05 | 60 |
| GO:0071383 | Colorectum | AD | cellular response to steroid hormone stimulus | 73/3918 | 204/18723 | 6.31e-07 | 2.24e-05 | 73 |
| GO:0055076 | Colorectum | AD | transition metal ion homeostasis | 53/3918 | 138/18723 | 1.89e-06 | 5.65e-05 | 53 |
| GO:0030522 | Colorectum | AD | intracellular receptor signaling pathway | 87/3918 | 265/18723 | 3.69e-06 | 1.03e-04 | 87 |
| GO:0043401 | Colorectum | AD | steroid hormone mediated signaling pathway | 51/3918 | 136/18723 | 6.52e-06 | 1.63e-04 | 51 |
| GO:0048545 | Colorectum | AD | response to steroid hormone | 104/3918 | 339/18723 | 1.33e-05 | 2.90e-04 | 104 |
| GO:0009755 | Colorectum | AD | hormone-mediated signaling pathway | 64/3918 | 190/18723 | 2.78e-05 | 5.24e-04 | 64 |
| GO:0046916 | Colorectum | AD | cellular transition metal ion homeostasis | 43/3918 | 115/18723 | 3.62e-05 | 6.56e-04 | 43 |
| GO:0030518 | Colorectum | AD | intracellular steroid hormone receptor signaling pathway | 43/3918 | 116/18723 | 4.61e-05 | 7.97e-04 | 43 |
| GO:0007041 | Colorectum | AD | lysosomal transport | 42/3918 | 114/18723 | 6.61e-05 | 1.07e-03 | 42 |
| GO:0072665 | Colorectum | AD | protein localization to vacuole | 27/3918 | 67/18723 | 2.40e-04 | 3.04e-03 | 27 |
| GO:0055072 | Colorectum | AD | iron ion homeostasis | 32/3918 | 85/18723 | 2.97e-04 | 3.60e-03 | 32 |
| GO:0061458 | Colorectum | AD | reproductive system development | 116/3918 | 427/18723 | 1.11e-03 | 1.01e-02 | 116 |
| GO:1901654 | Colorectum | AD | response to ketone | 59/3918 | 194/18723 | 1.14e-03 | 1.04e-02 | 59 |
| GO:0061462 | Colorectum | AD | protein localization to lysosome | 19/3918 | 46/18723 | 1.36e-03 | 1.19e-02 | 19 |
| GO:0006879 | Colorectum | AD | cellular iron ion homeostasis | 25/3918 | 67/18723 | 1.51e-03 | 1.27e-02 | 25 |
| GO:0048608 | Colorectum | AD | reproductive structure development | 114/3918 | 424/18723 | 1.78e-03 | 1.47e-02 | 114 |
| GO:0006623 | Colorectum | AD | protein targeting to vacuole | 15/3918 | 37/18723 | 5.24e-03 | 3.47e-02 | 15 |
| Page: 1 2 3 4 5 6 7 8 9 10 11 12 13 14 15 16 17 18 |
| Pathway ID | Tissue | Disease Stage | Description | Gene Ratio | Bg Ratio | pvalue | p.adjust | qvalue | Count |
| hsa05216 | Colorectum | AD | Thyroid cancer | 21/2092 | 37/8465 | 3.05e-05 | 2.76e-04 | 1.76e-04 | 21 |
| hsa04216 | Colorectum | AD | Ferroptosis | 21/2092 | 41/8465 | 2.23e-04 | 1.78e-03 | 1.13e-03 | 21 |
| hsa052161 | Colorectum | AD | Thyroid cancer | 21/2092 | 37/8465 | 3.05e-05 | 2.76e-04 | 1.76e-04 | 21 |
| hsa042161 | Colorectum | AD | Ferroptosis | 21/2092 | 41/8465 | 2.23e-04 | 1.78e-03 | 1.13e-03 | 21 |
| hsa052162 | Colorectum | MSS | Thyroid cancer | 21/1875 | 37/8465 | 4.98e-06 | 6.00e-05 | 3.68e-05 | 21 |
| hsa042162 | Colorectum | MSS | Ferroptosis | 18/1875 | 41/8465 | 1.53e-03 | 8.53e-03 | 5.23e-03 | 18 |
| hsa052163 | Colorectum | MSS | Thyroid cancer | 21/1875 | 37/8465 | 4.98e-06 | 6.00e-05 | 3.68e-05 | 21 |
| hsa042163 | Colorectum | MSS | Ferroptosis | 18/1875 | 41/8465 | 1.53e-03 | 8.53e-03 | 5.23e-03 | 18 |
| hsa0521628 | Esophagus | ESCC | Thyroid cancer | 32/4205 | 37/8465 | 2.98e-06 | 1.72e-05 | 8.81e-06 | 32 |
| hsa0421629 | Esophagus | ESCC | Ferroptosis | 33/4205 | 41/8465 | 4.58e-05 | 1.99e-04 | 1.02e-04 | 33 |
| hsa0521638 | Esophagus | ESCC | Thyroid cancer | 32/4205 | 37/8465 | 2.98e-06 | 1.72e-05 | 8.81e-06 | 32 |
| hsa0421638 | Esophagus | ESCC | Ferroptosis | 33/4205 | 41/8465 | 4.58e-05 | 1.99e-04 | 1.02e-04 | 33 |
| hsa052167 | Liver | Cirrhotic | Thyroid cancer | 23/2530 | 37/8465 | 4.63e-05 | 3.28e-04 | 2.02e-04 | 23 |
| hsa0421621 | Liver | Cirrhotic | Ferroptosis | 23/2530 | 41/8465 | 4.09e-04 | 2.57e-03 | 1.58e-03 | 23 |
| hsa0521612 | Liver | Cirrhotic | Thyroid cancer | 23/2530 | 37/8465 | 4.63e-05 | 3.28e-04 | 2.02e-04 | 23 |
| hsa0421631 | Liver | Cirrhotic | Ferroptosis | 23/2530 | 41/8465 | 4.09e-04 | 2.57e-03 | 1.58e-03 | 23 |
| hsa0421641 | Liver | HCC | Ferroptosis | 33/4020 | 41/8465 | 1.42e-05 | 9.88e-05 | 5.50e-05 | 33 |
| hsa0521622 | Liver | HCC | Thyroid cancer | 29/4020 | 37/8465 | 1.18e-04 | 5.88e-04 | 3.27e-04 | 29 |
| hsa0421651 | Liver | HCC | Ferroptosis | 33/4020 | 41/8465 | 1.42e-05 | 9.88e-05 | 5.50e-05 | 33 |
| hsa0521632 | Liver | HCC | Thyroid cancer | 29/4020 | 37/8465 | 1.18e-04 | 5.88e-04 | 3.27e-04 | 29 |
| Page: 1 2 3 |
Top |
Cell-cell communication analysis |
| Identification of potential cell-cell interactions between two cell types and their ligand-receptor pairs for different disease states |
| Ligand | Receptor | LRpair | Pathway | Tissue | Disease Stage |
| Page: 1 |
Top |
Single-cell gene regulatory network inference analysis |
| Find out the significant the regulons (TFs) and the target genes of each regulon across cell types for different disease states |
| TF | Cell Type | Tissue | Disease Stage | Target Gene | RSS | Regulon Activity |
| ∗The dot plots of a searched regulon are shown for all cell subpopulations in each disease state of each tissue based on the regulon specific score inferred using pySCENIC and by calculating the average expression. |
| Page: 1 |
Top |
Somatic mutation of malignant transformation related genes |
| Annotation of somatic variants for genes involved in malignant transformation |
| Hugo Symbol | Variant Class | Variant Classification | dbSNP RS | HGVSc | HGVSp | HGVSp Short | SWISSPROT | BIOTYPE | SIFT | PolyPhen | Tumor Sample Barcode | Tissue | Histology | Sex | Age | Stage | Therapy Types | Drugs | Outcome |
| NCOA4 | SNV | Missense_Mutation | rs782435505 | c.797N>A | p.Val266Asp | p.V266D | Q13772 | protein_coding | deleterious(0.03) | possibly_damaging(0.876) | TCGA-A7-A0CE-01 | Breast | breast invasive carcinoma | Female | <65 | I/II | Chemotherapy | adriamycin | SD |
| NCOA4 | SNV | Missense_Mutation | novel | c.1874N>A | p.Arg625Gln | p.R625Q | Q13772 | protein_coding | tolerated(0.47) | benign(0.074) | TCGA-AN-A046-01 | Breast | breast invasive carcinoma | Female | >=65 | I/II | Unknown | Unknown | SD |
| NCOA4 | insertion | In_Frame_Ins | novel | c.1448_1449insCTC | p.Val483_Ile484insSer | p.V483_I484insS | Q13772 | protein_coding | TCGA-A8-A07U-01 | Breast | breast invasive carcinoma | Female | >=65 | III/IV | Chemotherapy | 5-fluorouracil | SD | ||
| NCOA4 | insertion | In_Frame_Ins | novel | c.1446_1447insTTTTTTGTATTTTTGGTAGAGATGGGGTTTTGGCCTGGGCTG | p.Glu482_Val483insPhePheValPheLeuValGluMetGlyPheTrpProGlyLeu | p.E482_V483insFFVFLVEMGFWPGL | Q13772 | protein_coding | TCGA-A8-A07U-01 | Breast | breast invasive carcinoma | Female | >=65 | III/IV | Chemotherapy | 5-fluorouracil | SD | ||
| NCOA4 | insertion | Frame_Shift_Ins | novel | c.833_834insTGTTTTCATGAAGCAACCTACTCTTTTCTTTTCT | p.Lys279ValfsTer14 | p.K279Vfs*14 | Q13772 | protein_coding | TCGA-A8-A07U-01 | Breast | breast invasive carcinoma | Female | >=65 | III/IV | Chemotherapy | 5-fluorouracil | SD | ||
| NCOA4 | insertion | In_Frame_Ins | novel | c.1047_1048insATTATAGCTATTTATAAA | p.Gln349_Ser350insIleIleAlaIleTyrLys | p.Q349_S350insIIAIYK | Q13772 | protein_coding | TCGA-BH-A0B1-01 | Breast | breast invasive carcinoma | Female | >=65 | I/II | Chemotherapy | adriamycin | SD | ||
| NCOA4 | insertion | Nonsense_Mutation | novel | c.1497_1498insTTTCAGATCCCATGTGGATTCTAGTAG | p.Ala499_Asp500insPheGlnIleProCysGlyPheTerTer | p.A499_D500insFQIPCGF** | Q13772 | protein_coding | TCGA-BH-A0HK-01 | Breast | breast invasive carcinoma | Female | >=65 | I/II | Hormone Therapy | arimidex | SD | ||
| NCOA4 | insertion | Frame_Shift_Ins | novel | c.1692_1693insTTACATATGAAGTCATA | p.Ser566HisfsTer75 | p.S566Hfs*75 | Q13772 | protein_coding | TCGA-BH-A0HX-01 | Breast | breast invasive carcinoma | Female | <65 | I/II | Chemotherapy | adrimycin | SD | ||
| NCOA4 | deletion | Frame_Shift_Del | novel | c.523delA | p.Thr175ProfsTer8 | p.T175Pfs*8 | Q13772 | protein_coding | TCGA-D8-A27V-01 | Breast | breast invasive carcinoma | Female | <65 | I/II | Hormone Therapy | tamoxiphen | SD | ||
| NCOA4 | SNV | Missense_Mutation | novel | c.1613A>G | p.Lys538Arg | p.K538R | Q13772 | protein_coding | tolerated(0.09) | benign(0.055) | TCGA-2W-A8YY-01 | Cervix | cervical & endocervical cancer | Female | <65 | I/II | Chemotherapy | cisplatin | CR |
| Page: 1 2 3 4 5 6 7 |
Top |
Related drugs of malignant transformation related genes |
| Identification of chemicals and drugs interact with genes involved in malignant transfromation |
| (DGIdb 4.0) |
| Entrez ID | Symbol | Category | Interaction Types | Drug Claim Name | Drug Name | PMIDs |
| Page: 1 |

Copyright 2023-Present -The University of Texas Health Science Center at Houston |