| Tissue | Expression Dynamics | Abbreviation |
| Cervix | 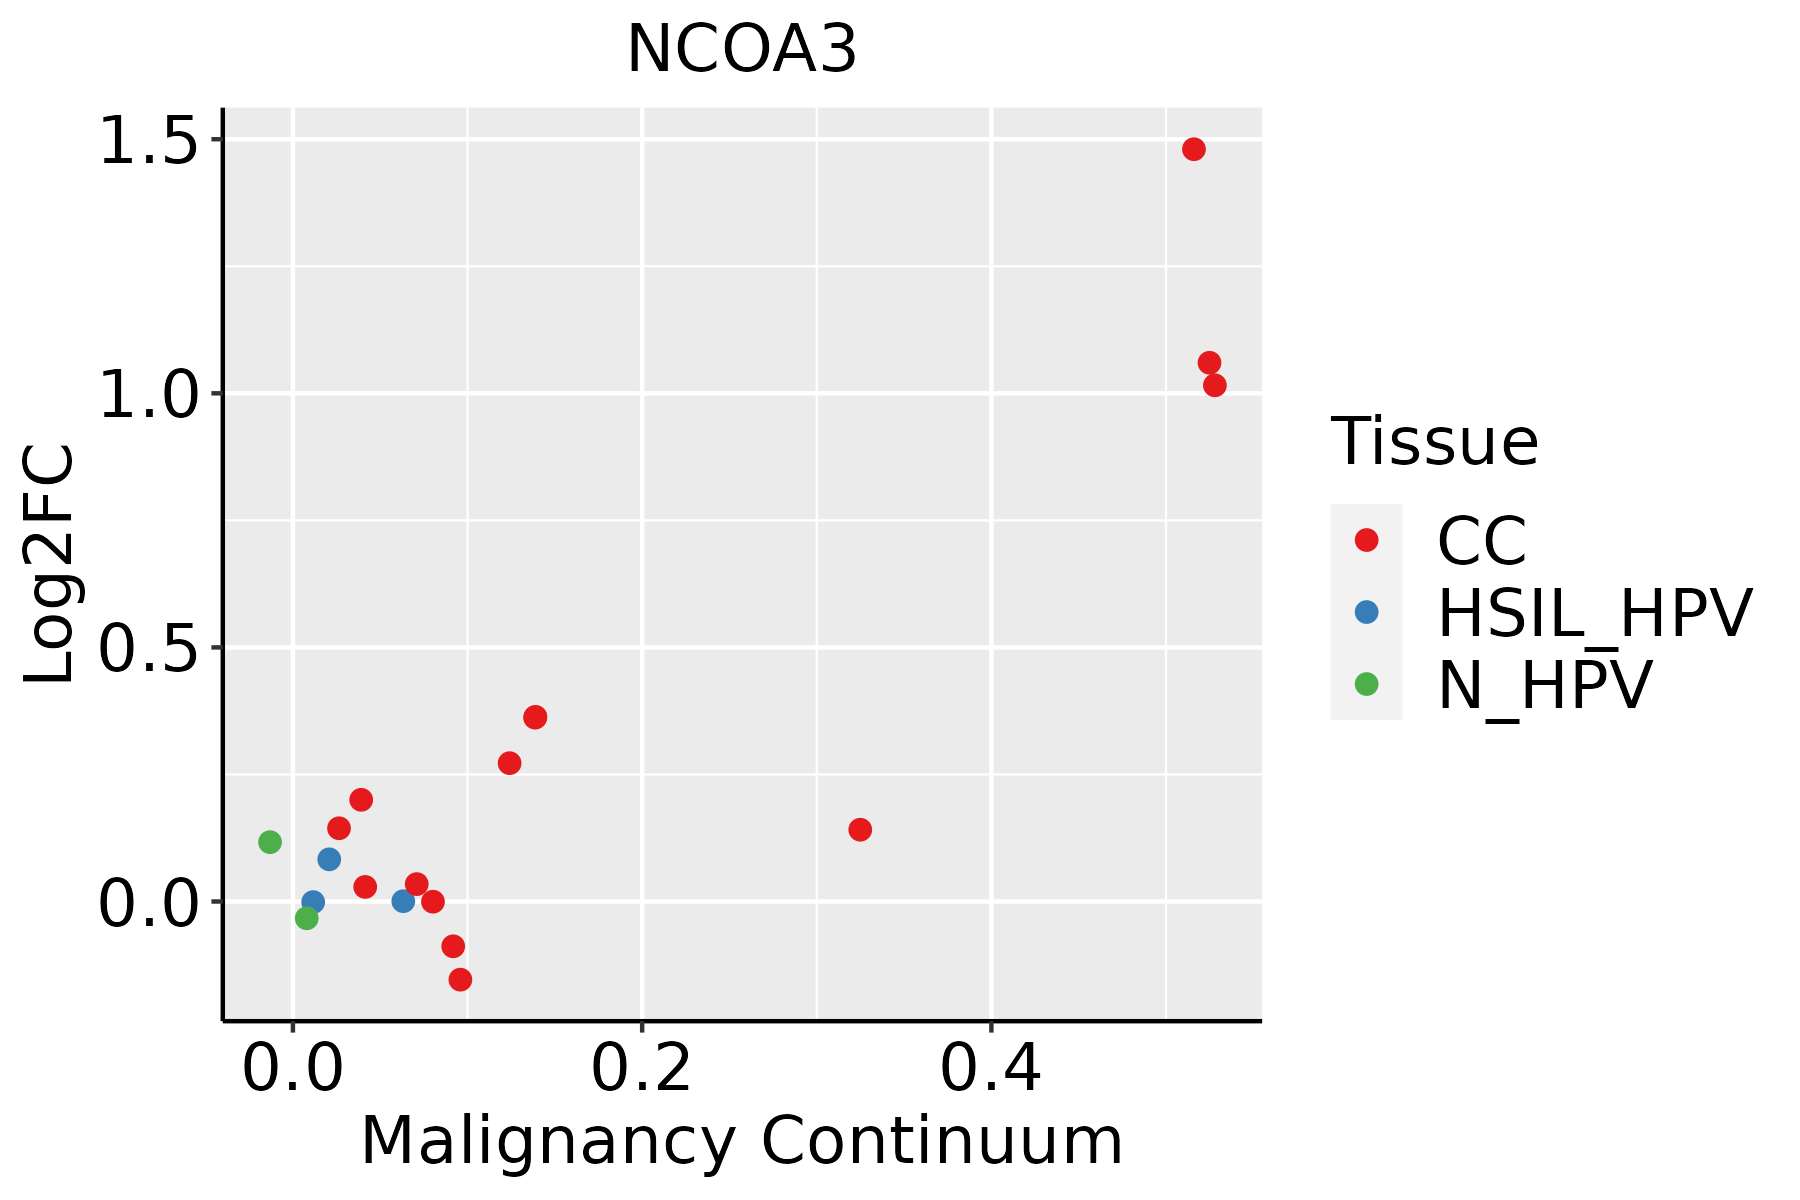 | CC: Cervix cancer |
| HSIL_HPV: HPV-infected high-grade squamous intraepithelial lesions |
| N_HPV: HPV-infected normal cervix |
| Colorectum (GSE201348) |  | FAP: Familial adenomatous polyposis |
| CRC: Colorectal cancer |
| Colorectum (HTA11) |  | AD: Adenomas |
| SER: Sessile serrated lesions |
| MSI-H: Microsatellite-high colorectal cancer |
| MSS: Microsatellite stable colorectal cancer |
| Endometrium | 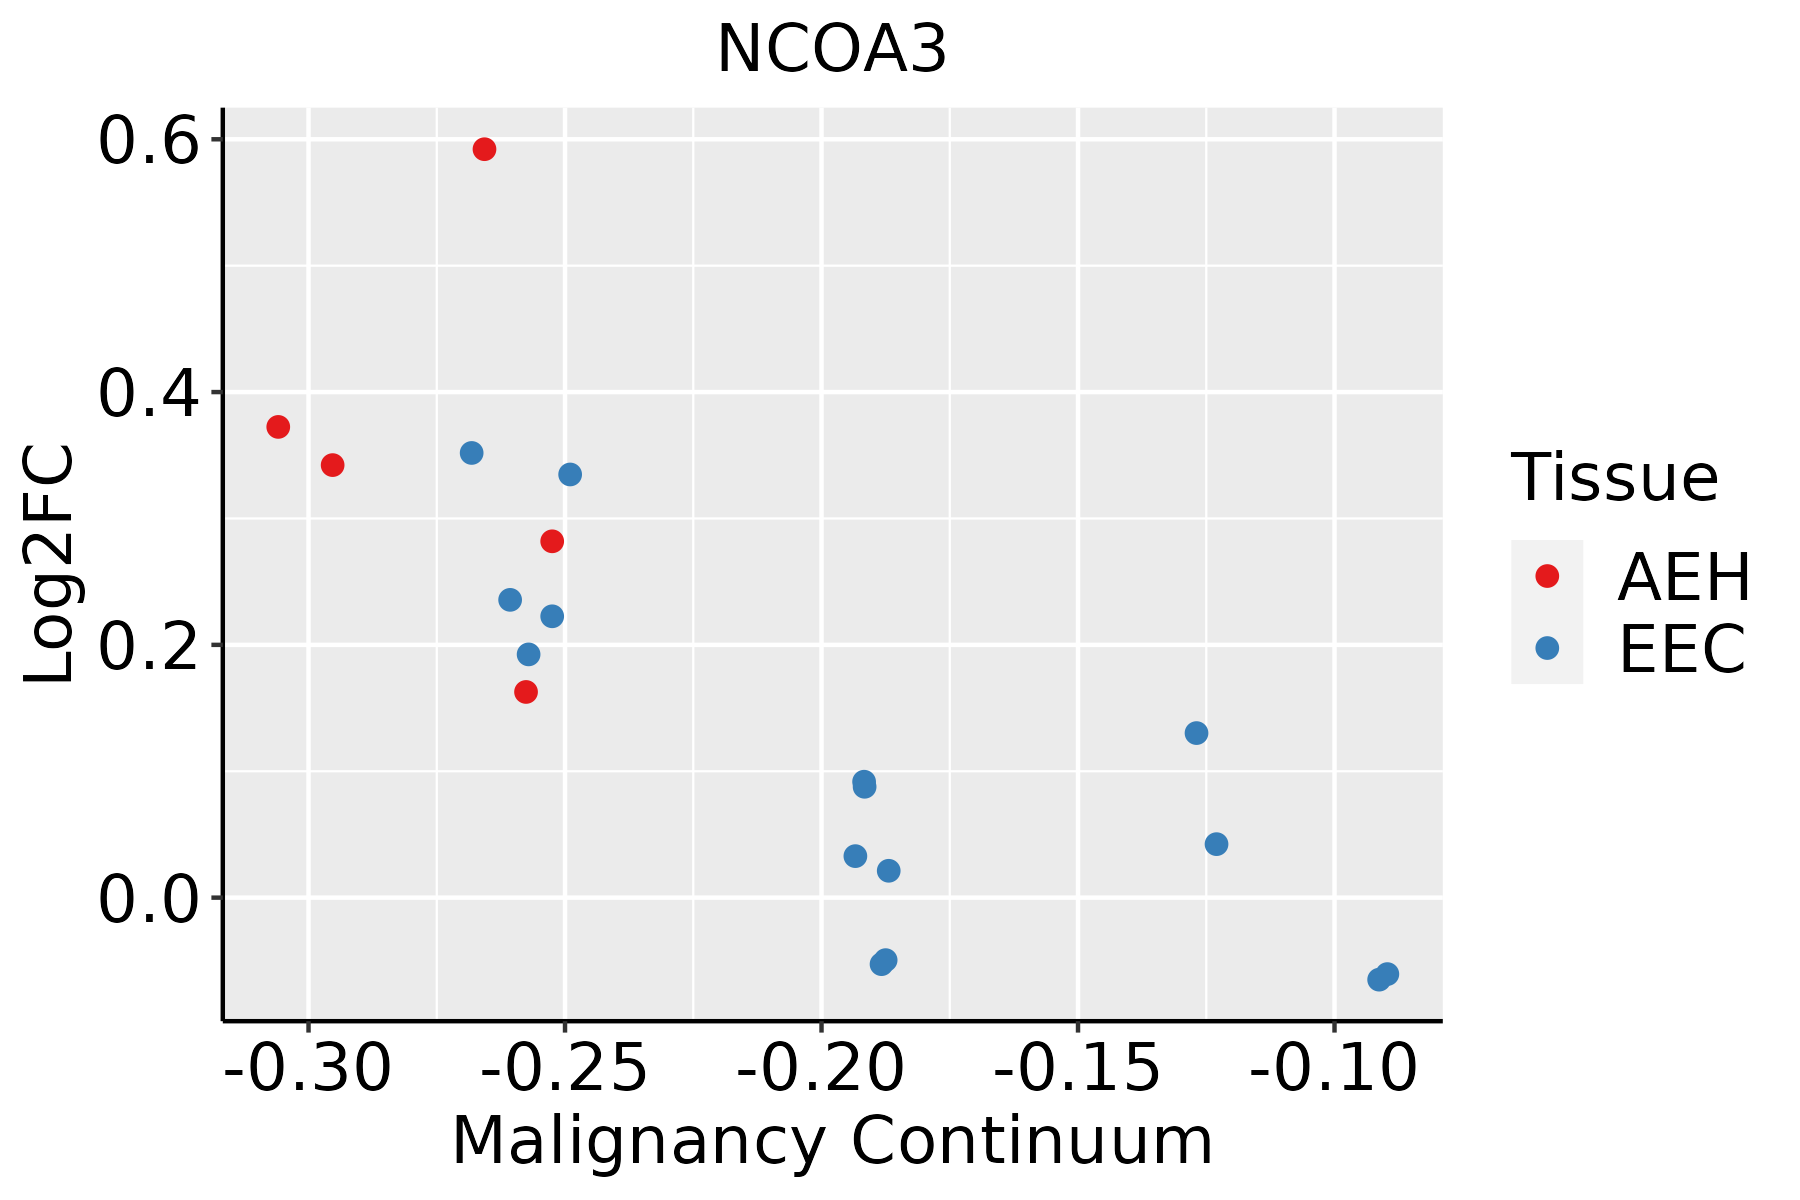 | AEH: Atypical endometrial hyperplasia |
| EEC: Endometrioid Cancer |
| Esophagus | 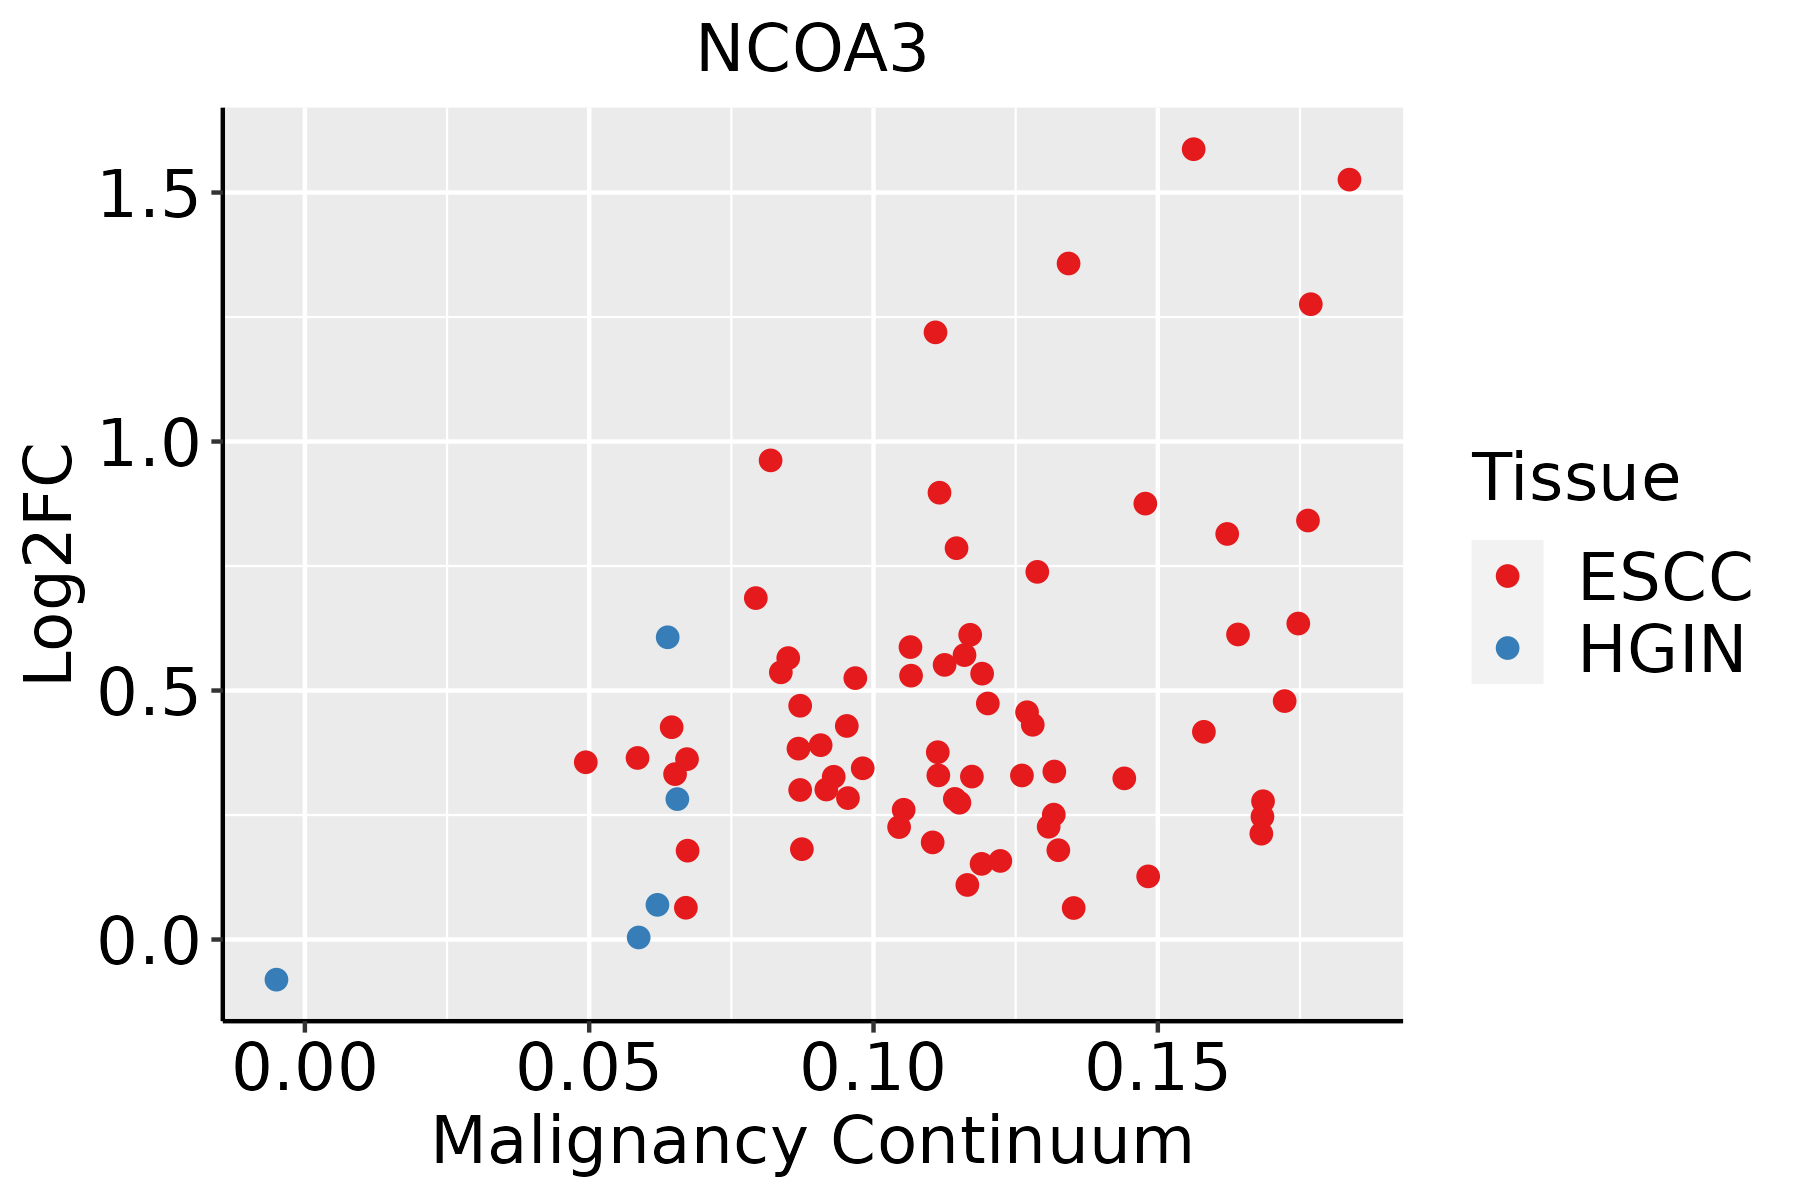 | ESCC: Esophageal squamous cell carcinoma |
| HGIN: High-grade intraepithelial neoplasias |
| LGIN: Low-grade intraepithelial neoplasias |
| Liver | 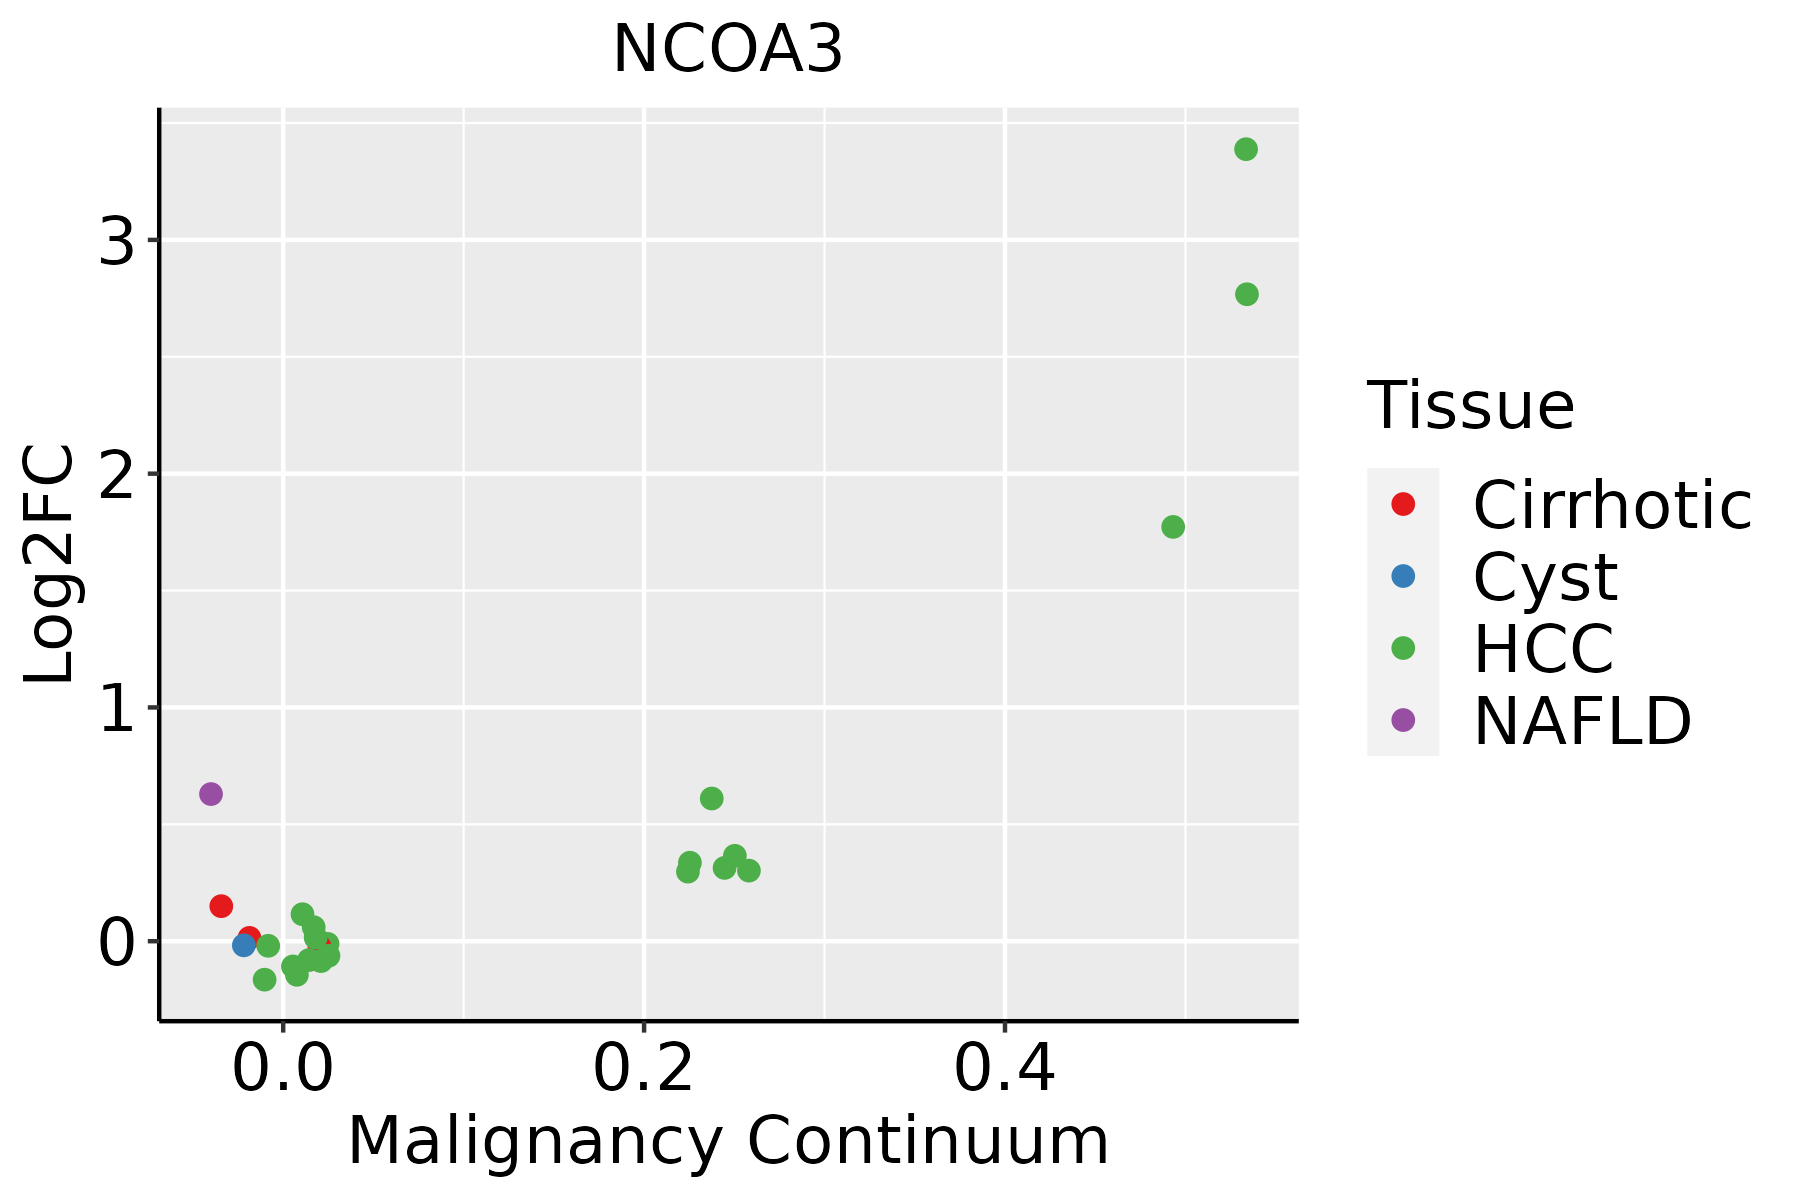 | HCC: Hepatocellular carcinoma |
| NAFLD: Non-alcoholic fatty liver disease |
| Lung | 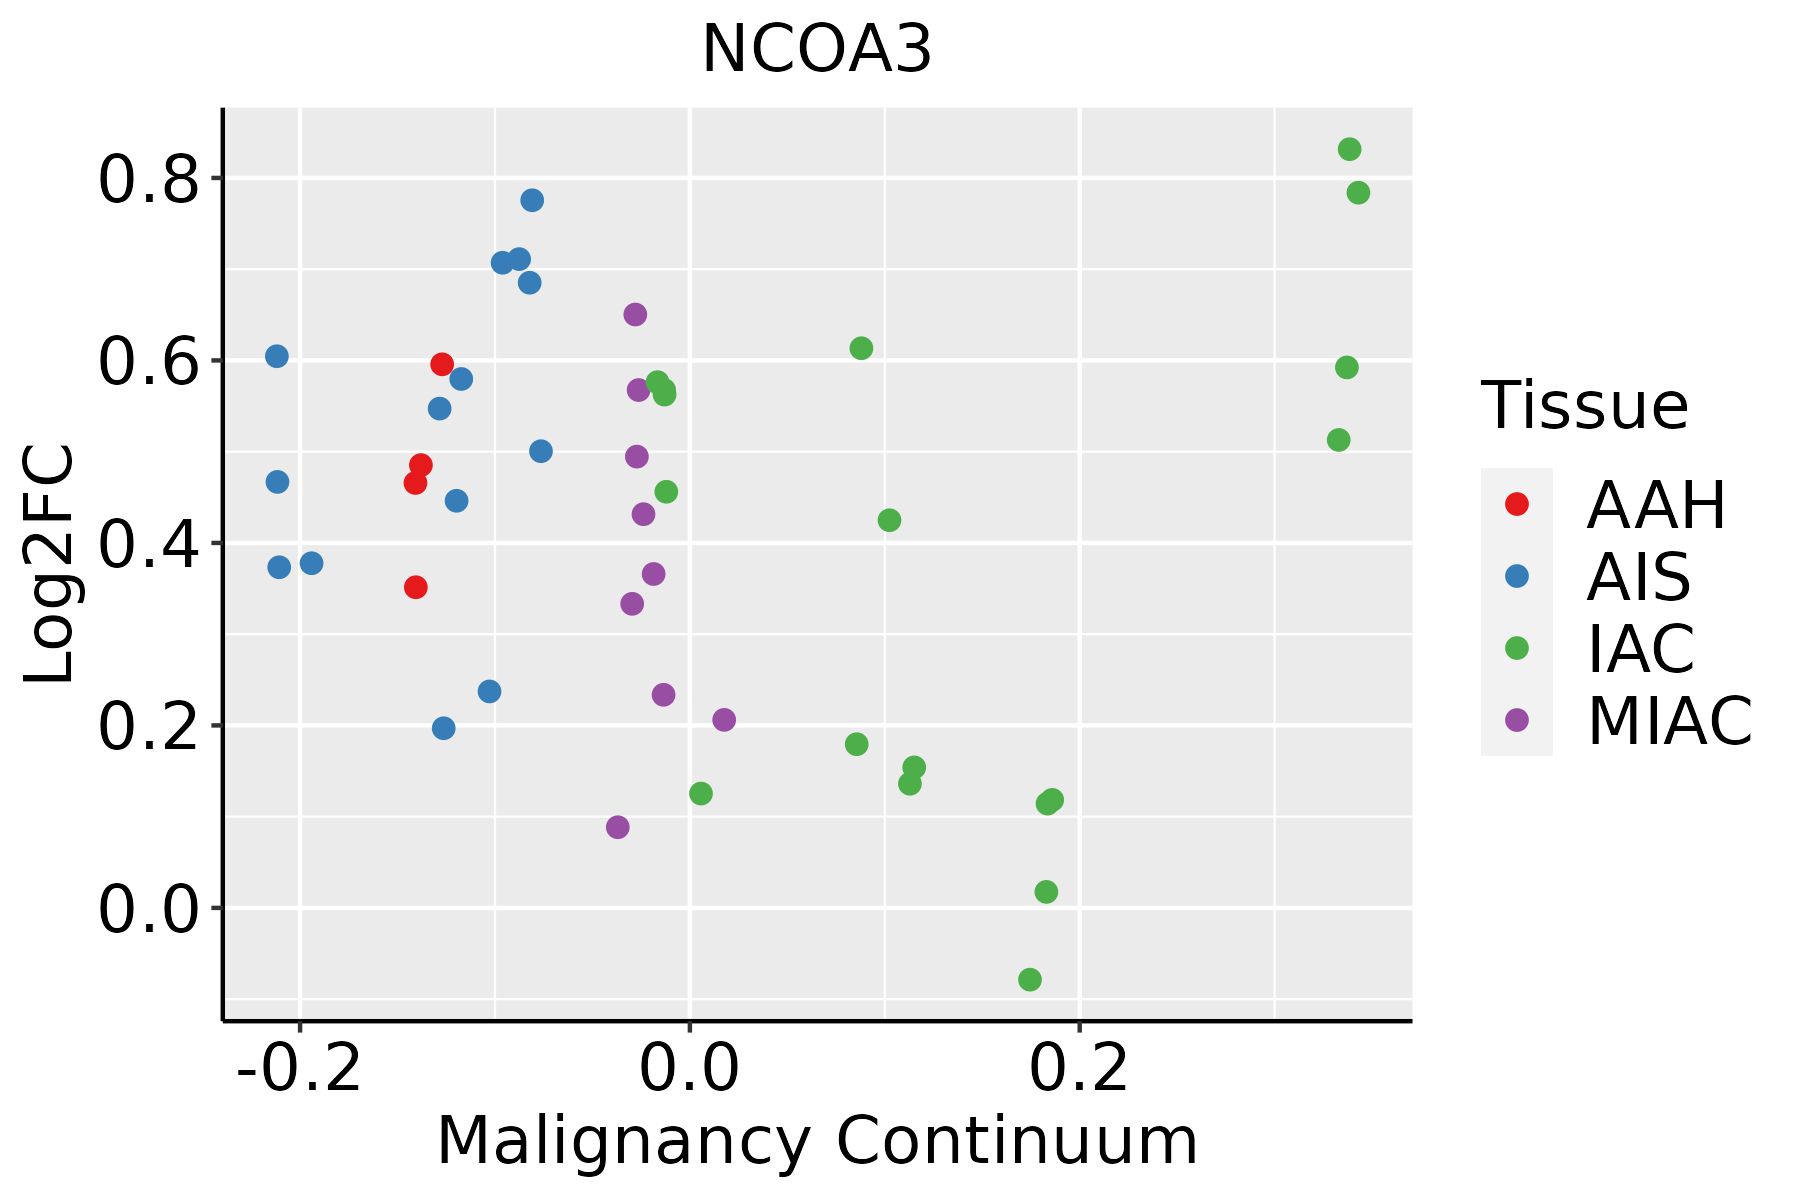 | AAH: Atypical adenomatous hyperplasia |
| AIS: Adenocarcinoma in situ |
| IAC: Invasive lung adenocarcinoma |
| MIA: Minimally invasive adenocarcinoma |
| Oral Cavity |  | EOLP: Erosive Oral lichen planus |
| LP: leukoplakia |
| NEOLP: Non-erosive oral lichen planus |
| OSCC: Oral squamous cell carcinoma |
| Prostate | 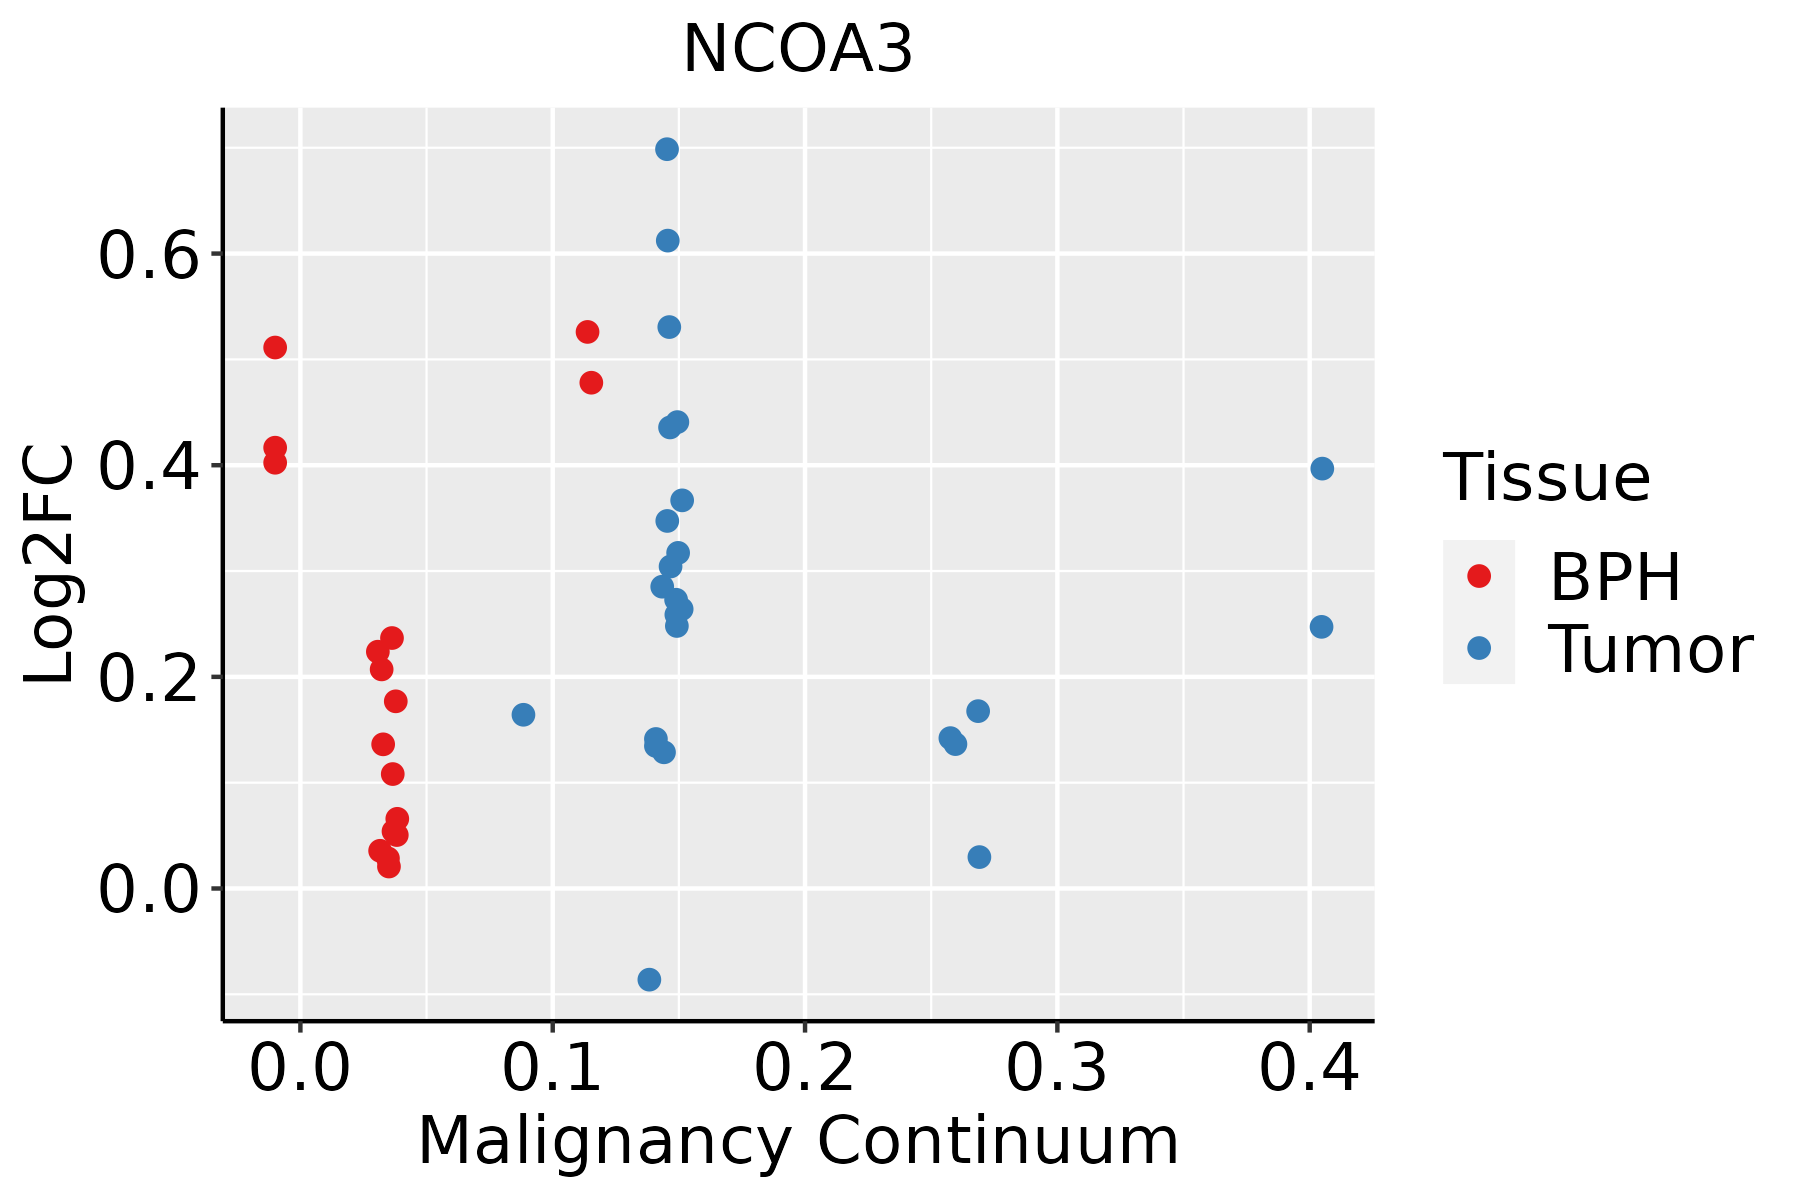 | BPH: Benign Prostatic Hyperplasia |
| Skin |  | AK: Actinic keratosis |
| cSCC: Cutaneous squamous cell carcinoma |
| SCCIS:squamous cell carcinoma in situ |
| Thyroid | 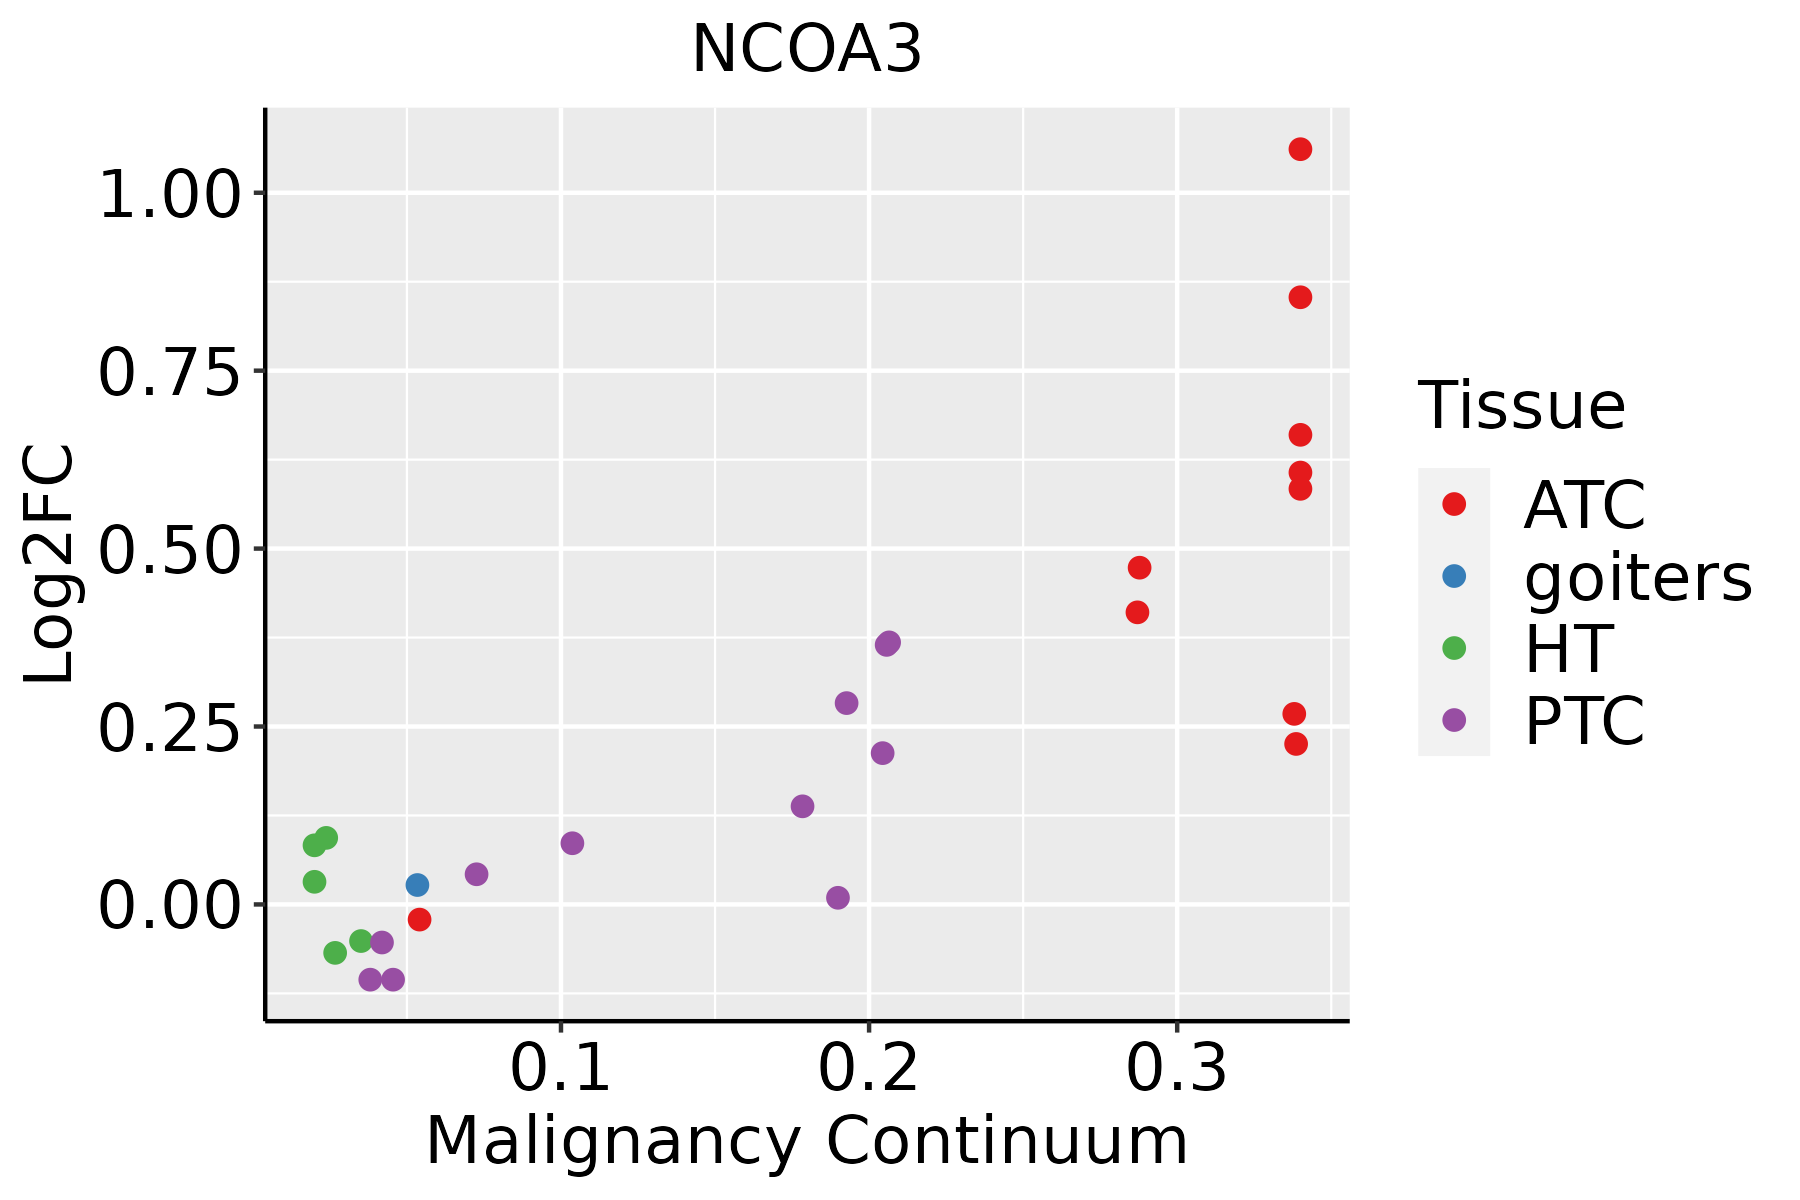 | ATC: Anaplastic thyroid cancer |
| HT: Hashimoto's thyroiditis |
| PTC: Papillary thyroid cancer |
| GO ID | Tissue | Disease Stage | Description | Gene Ratio | Bg Ratio | pvalue | p.adjust | Count |
| GO:00085446 | Cervix | CC | epidermis development | 83/2311 | 324/18723 | 3.91e-11 | 8.54e-09 | 83 |
| GO:00435884 | Cervix | CC | skin development | 71/2311 | 263/18723 | 8.04e-11 | 1.46e-08 | 71 |
| GO:00302164 | Cervix | CC | keratinocyte differentiation | 42/2311 | 139/18723 | 1.74e-08 | 1.28e-06 | 42 |
| GO:00099137 | Cervix | CC | epidermal cell differentiation | 53/2311 | 202/18723 | 5.48e-08 | 3.25e-06 | 53 |
| GO:00456822 | Cervix | CC | regulation of epidermis development | 22/2311 | 65/18723 | 5.56e-06 | 1.38e-04 | 22 |
| GO:00456042 | Cervix | CC | regulation of epidermal cell differentiation | 20/2311 | 58/18723 | 1.07e-05 | 2.33e-04 | 20 |
| GO:00456163 | Cervix | CC | regulation of keratinocyte differentiation | 14/2311 | 37/18723 | 6.97e-05 | 9.81e-04 | 14 |
| GO:00323556 | Cervix | CC | response to estradiol | 34/2311 | 141/18723 | 8.19e-05 | 1.11e-03 | 34 |
| GO:00308563 | Cervix | CC | regulation of epithelial cell differentiation | 36/2311 | 154/18723 | 1.02e-04 | 1.31e-03 | 36 |
| GO:00165705 | Cervix | CC | histone modification | 84/2311 | 463/18723 | 1.70e-04 | 2.01e-03 | 84 |
| GO:00513021 | Cervix | CC | regulation of cell division | 39/2311 | 177/18723 | 2.05e-04 | 2.33e-03 | 39 |
| GO:00987275 | Cervix | CC | maintenance of cell number | 30/2311 | 134/18723 | 7.98e-04 | 7.00e-03 | 30 |
| GO:00198274 | Cervix | CC | stem cell population maintenance | 29/2311 | 131/18723 | 1.17e-03 | 9.47e-03 | 29 |
| GO:0017145 | Cervix | CC | stem cell division | 9/2311 | 30/18723 | 8.28e-03 | 4.28e-02 | 9 |
| GO:00182054 | Cervix | CC | peptidyl-lysine modification | 62/2311 | 376/18723 | 1.04e-02 | 4.97e-02 | 62 |
| GO:0009913 | Colorectum | AD | epidermal cell differentiation | 58/3918 | 202/18723 | 5.16e-03 | 3.42e-02 | 58 |
| GO:0008544 | Colorectum | AD | epidermis development | 87/3918 | 324/18723 | 5.99e-03 | 3.76e-02 | 87 |
| GO:0016570 | Colorectum | MSS | histone modification | 113/3467 | 463/18723 | 8.37e-04 | 8.68e-03 | 113 |
| GO:00099131 | Colorectum | MSS | epidermal cell differentiation | 52/3467 | 202/18723 | 6.59e-03 | 4.38e-02 | 52 |
| GO:00165701 | Colorectum | FAP | histone modification | 94/2622 | 463/18723 | 1.06e-04 | 1.76e-03 | 94 |
| Pathway ID | Tissue | Disease Stage | Description | Gene Ratio | Bg Ratio | pvalue | p.adjust | qvalue | Count |
| hsa0491520 | Cervix | CC | Estrogen signaling pathway | 44/1267 | 138/8465 | 3.55e-07 | 3.97e-06 | 2.35e-06 | 44 |
| hsa0491918 | Cervix | CC | Thyroid hormone signaling pathway | 33/1267 | 121/8465 | 3.11e-04 | 1.65e-03 | 9.78e-04 | 33 |
| hsa015223 | Cervix | CC | Endocrine resistance | 28/1267 | 98/8465 | 3.82e-04 | 1.87e-03 | 1.11e-03 | 28 |
| hsa05224 | Cervix | CC | Breast cancer | 32/1267 | 147/8465 | 1.66e-02 | 4.88e-02 | 2.88e-02 | 32 |
| hsa04915110 | Cervix | CC | Estrogen signaling pathway | 44/1267 | 138/8465 | 3.55e-07 | 3.97e-06 | 2.35e-06 | 44 |
| hsa0491919 | Cervix | CC | Thyroid hormone signaling pathway | 33/1267 | 121/8465 | 3.11e-04 | 1.65e-03 | 9.78e-04 | 33 |
| hsa0152212 | Cervix | CC | Endocrine resistance | 28/1267 | 98/8465 | 3.82e-04 | 1.87e-03 | 1.11e-03 | 28 |
| hsa052241 | Cervix | CC | Breast cancer | 32/1267 | 147/8465 | 1.66e-02 | 4.88e-02 | 2.88e-02 | 32 |
| hsa04919 | Colorectum | AD | Thyroid hormone signaling pathway | 51/2092 | 121/8465 | 1.71e-05 | 1.73e-04 | 1.10e-04 | 51 |
| hsa049191 | Colorectum | AD | Thyroid hormone signaling pathway | 51/2092 | 121/8465 | 1.71e-05 | 1.73e-04 | 1.10e-04 | 51 |
| hsa049194 | Colorectum | MSS | Thyroid hormone signaling pathway | 46/1875 | 121/8465 | 5.04e-05 | 4.97e-04 | 3.05e-04 | 46 |
| hsa049152 | Colorectum | MSS | Estrogen signaling pathway | 48/1875 | 138/8465 | 4.23e-04 | 3.08e-03 | 1.89e-03 | 48 |
| hsa049195 | Colorectum | MSS | Thyroid hormone signaling pathway | 46/1875 | 121/8465 | 5.04e-05 | 4.97e-04 | 3.05e-04 | 46 |
| hsa049153 | Colorectum | MSS | Estrogen signaling pathway | 48/1875 | 138/8465 | 4.23e-04 | 3.08e-03 | 1.89e-03 | 48 |
| hsa049198 | Colorectum | FAP | Thyroid hormone signaling pathway | 41/1404 | 121/8465 | 2.28e-06 | 4.28e-05 | 2.60e-05 | 41 |
| hsa049199 | Colorectum | FAP | Thyroid hormone signaling pathway | 41/1404 | 121/8465 | 2.28e-06 | 4.28e-05 | 2.60e-05 | 41 |
| hsa0491910 | Colorectum | CRC | Thyroid hormone signaling pathway | 35/1091 | 121/8465 | 2.05e-06 | 6.85e-05 | 4.64e-05 | 35 |
| hsa049154 | Colorectum | CRC | Estrogen signaling pathway | 29/1091 | 138/8465 | 4.83e-03 | 2.66e-02 | 1.80e-02 | 29 |
| hsa0491911 | Colorectum | CRC | Thyroid hormone signaling pathway | 35/1091 | 121/8465 | 2.05e-06 | 6.85e-05 | 4.64e-05 | 35 |
| hsa049155 | Colorectum | CRC | Estrogen signaling pathway | 29/1091 | 138/8465 | 4.83e-03 | 2.66e-02 | 1.80e-02 | 29 |
| Hugo Symbol | Variant Class | Variant Classification | dbSNP RS | HGVSc | HGVSp | HGVSp Short | SWISSPROT | BIOTYPE | SIFT | PolyPhen | Tumor Sample Barcode | Tissue | Histology | Sex | Age | Stage | Therapy Types | Drugs | Outcome |
| NCOA3 | SNV | Missense_Mutation | | c.3178N>T | p.Leu1060Phe | p.L1060F | Q9Y6Q9 | protein_coding | tolerated(0.05) | benign(0.25) | TCGA-A7-A26H-01 | Breast | breast invasive carcinoma | Female | >=65 | I/II | Hormone Therapy | anastrozole | PD |
| NCOA3 | SNV | Missense_Mutation | | c.1643T>G | p.Leu548Trp | p.L548W | Q9Y6Q9 | protein_coding | deleterious(0.01) | possibly_damaging(0.874) | TCGA-A8-A08T-01 | Breast | breast invasive carcinoma | Female | <65 | III/IV | Unknown | Unknown | PD |
| NCOA3 | SNV | Missense_Mutation | | c.241C>A | p.Gln81Lys | p.Q81K | Q9Y6Q9 | protein_coding | deleterious(0) | possibly_damaging(0.709) | TCGA-A8-A0A7-01 | Breast | breast invasive carcinoma | Female | <65 | I/II | Unknown | Unknown | SD |
| NCOA3 | SNV | Missense_Mutation | | c.3410C>G | p.Ser1137Cys | p.S1137C | Q9Y6Q9 | protein_coding | deleterious(0.01) | possibly_damaging(0.827) | TCGA-AC-A23H-01 | Breast | breast invasive carcinoma | Female | >=65 | I/II | Unknown | Unknown | PD |
| NCOA3 | SNV | Missense_Mutation | rs374724210 | c.1715N>T | p.Gly572Val | p.G572V | Q9Y6Q9 | protein_coding | deleterious(0) | possibly_damaging(0.581) | TCGA-AC-A2QI-01 | Breast | breast invasive carcinoma | Female | >=65 | III/IV | Chemotherapy | cytoxan | CR |
| NCOA3 | SNV | Missense_Mutation | | c.1625N>T | p.Ser542Leu | p.S542L | Q9Y6Q9 | protein_coding | deleterious(0.01) | benign(0.119) | TCGA-AR-A0TQ-01 | Breast | breast invasive carcinoma | Female | <65 | III/IV | Chemotherapy | doxorubicin | SD |
| NCOA3 | SNV | Missense_Mutation | | c.1234N>G | p.Pro412Ala | p.P412A | Q9Y6Q9 | protein_coding | tolerated(0.81) | benign(0) | TCGA-BH-A0WA-01 | Breast | breast invasive carcinoma | Female | >=65 | I/II | Unknown | Unknown | SD |
| NCOA3 | SNV | Missense_Mutation | | c.526T>C | p.Ser176Pro | p.S176P | Q9Y6Q9 | protein_coding | deleterious(0.04) | benign(0.279) | TCGA-C8-A274-01 | Breast | breast invasive carcinoma | Female | <65 | I/II | Hormone Therapy | tamoxiphen | SD |
| NCOA3 | SNV | Missense_Mutation | rs148634537 | c.4010N>T | p.Ser1337Leu | p.S1337L | Q9Y6Q9 | protein_coding | deleterious(0.02) | possibly_damaging(0.621) | TCGA-D8-A140-01 | Breast | breast invasive carcinoma | Female | <65 | I/II | Chemotherapy | doxorubicin+cyclophosphamid | SD |
| NCOA3 | SNV | Missense_Mutation | | c.3934C>A | p.Gln1312Lys | p.Q1312K | Q9Y6Q9 | protein_coding | deleterious(0.02) | benign(0.038) | TCGA-D8-A1J8-01 | Breast | breast invasive carcinoma | Female | >=65 | I/II | Hormone Therapy | nolvadex | SD |
| Entrez ID | Symbol | Category | Interaction Types | Drug Claim Name | Drug Name | PMIDs |
| 8202 | NCOA3 | NUCLEAR HORMONE RECEPTOR, DRUGGABLE GENOME, ENZYME | | TAMOXIFEN | TAMOXIFEN | 12618500 |
| 8202 | NCOA3 | NUCLEAR HORMONE RECEPTOR, DRUGGABLE GENOME, ENZYME | | TCMDC-123764 | CHEMBL533226 | |
| 8202 | NCOA3 | NUCLEAR HORMONE RECEPTOR, DRUGGABLE GENOME, ENZYME | | METHYLTHIONINIUM CHLORIDE | METHYLTHIONINIUM CHLORIDE | |
| 8202 | NCOA3 | NUCLEAR HORMONE RECEPTOR, DRUGGABLE GENOME, ENZYME | | CYTARABINE | CYTARABINE | |
| 8202 | NCOA3 | NUCLEAR HORMONE RECEPTOR, DRUGGABLE GENOME, ENZYME | | TCMDC-137788 | CHEMBL587564 | |
| 8202 | NCOA3 | NUCLEAR HORMONE RECEPTOR, DRUGGABLE GENOME, ENZYME | | METHOTREXATE | METHOTREXATE | |
| 8202 | NCOA3 | NUCLEAR HORMONE RECEPTOR, DRUGGABLE GENOME, ENZYME | | ETOPOSIDE | ETOPOSIDE | |
| 8202 | NCOA3 | NUCLEAR HORMONE RECEPTOR, DRUGGABLE GENOME, ENZYME | | IRINOTECAN HYDROCHLORIDE HYDRATE | IRINOTECAN HYDROCHLORIDE HYDRATE | |
| 8202 | NCOA3 | NUCLEAR HORMONE RECEPTOR, DRUGGABLE GENOME, ENZYME | | DNDI1417478 | CHEMBL1972216 | |


