
|
|||||
|
 | |
| |
| |
| |
| |
| |
|
Gene: NCKIPSD |
Gene summary for NCKIPSD |
| Gene information | Species | Human | Gene symbol | NCKIPSD | Gene ID | 51517 |
| Gene name | NCK interacting protein with SH3 domain | |
| Gene Alias | AF3P21 | |
| Cytomap | 3p21.31 | |
| Gene Type | protein-coding | GO ID | GO:0006810 | UniProtAcc | Q9NZQ3 |
Top |
Malignant transformation analysis |
| Identification of the aberrant gene expression in precancerous and cancerous lesions by comparing the gene expression of stem-like cells in diseased tissues with normal stem cells |
| Entrez ID | Symbol | Replicates | Species | Organ | Tissue | Adj P-value | Log2FC | Malignancy |
| 51517 | NCKIPSD | P2T-E | Human | Esophagus | ESCC | 3.45e-11 | 1.23e-01 | 0.1177 |
| 51517 | NCKIPSD | P4T-E | Human | Esophagus | ESCC | 3.41e-10 | 2.44e-01 | 0.1323 |
| 51517 | NCKIPSD | P5T-E | Human | Esophagus | ESCC | 7.76e-04 | 5.74e-02 | 0.1327 |
| 51517 | NCKIPSD | P9T-E | Human | Esophagus | ESCC | 3.22e-04 | 7.85e-02 | 0.1131 |
| 51517 | NCKIPSD | P10T-E | Human | Esophagus | ESCC | 2.32e-08 | 1.60e-01 | 0.116 |
| 51517 | NCKIPSD | P11T-E | Human | Esophagus | ESCC | 1.20e-06 | 1.93e-01 | 0.1426 |
| 51517 | NCKIPSD | P12T-E | Human | Esophagus | ESCC | 2.61e-12 | 2.44e-01 | 0.1122 |
| 51517 | NCKIPSD | P15T-E | Human | Esophagus | ESCC | 1.16e-07 | 1.74e-01 | 0.1149 |
| 51517 | NCKIPSD | P16T-E | Human | Esophagus | ESCC | 3.67e-11 | 1.69e-01 | 0.1153 |
| 51517 | NCKIPSD | P20T-E | Human | Esophagus | ESCC | 8.02e-08 | 1.61e-01 | 0.1124 |
| 51517 | NCKIPSD | P21T-E | Human | Esophagus | ESCC | 1.51e-10 | 1.68e-01 | 0.1617 |
| 51517 | NCKIPSD | P22T-E | Human | Esophagus | ESCC | 8.75e-08 | 9.84e-02 | 0.1236 |
| 51517 | NCKIPSD | P23T-E | Human | Esophagus | ESCC | 4.66e-08 | 1.92e-01 | 0.108 |
| 51517 | NCKIPSD | P24T-E | Human | Esophagus | ESCC | 6.87e-08 | 1.69e-01 | 0.1287 |
| 51517 | NCKIPSD | P26T-E | Human | Esophagus | ESCC | 1.21e-16 | 2.90e-01 | 0.1276 |
| 51517 | NCKIPSD | P27T-E | Human | Esophagus | ESCC | 7.58e-12 | 1.45e-01 | 0.1055 |
| 51517 | NCKIPSD | P28T-E | Human | Esophagus | ESCC | 9.85e-08 | 1.10e-01 | 0.1149 |
| 51517 | NCKIPSD | P30T-E | Human | Esophagus | ESCC | 1.07e-07 | 3.14e-01 | 0.137 |
| 51517 | NCKIPSD | P31T-E | Human | Esophagus | ESCC | 4.91e-06 | 1.30e-01 | 0.1251 |
| 51517 | NCKIPSD | P32T-E | Human | Esophagus | ESCC | 6.91e-03 | 9.75e-02 | 0.1666 |
| Page: 1 2 3 |
| Tissue | Expression Dynamics | Abbreviation |
| Esophagus | 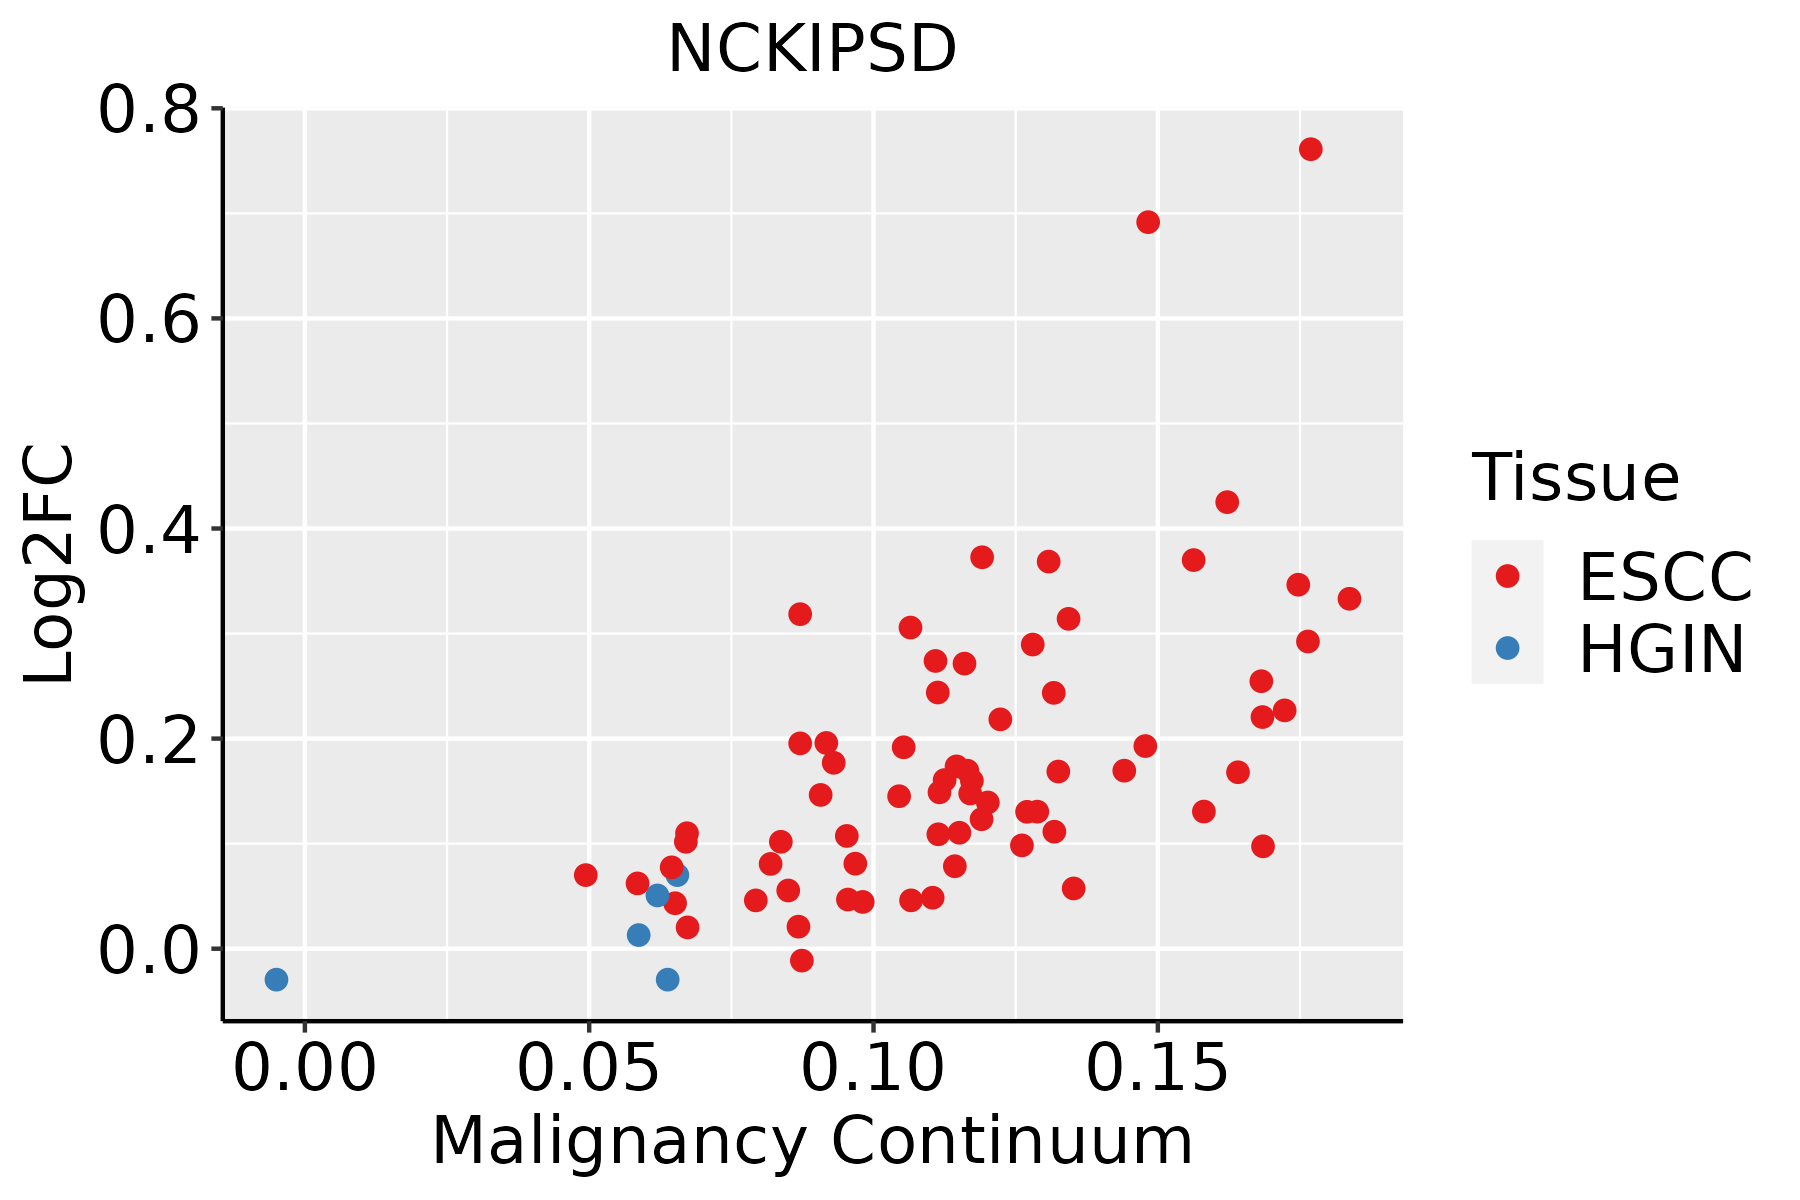 | ESCC: Esophageal squamous cell carcinoma |
| HGIN: High-grade intraepithelial neoplasias | ||
| LGIN: Low-grade intraepithelial neoplasias |
| ∗log2FC in expression of this searched gene in stem-like cells from each diseased tissue sample relative to stem-like cells in normal samples in each tissue plotted against the malignancy continuum. Samples are colored based on if they are from different disease stage. |
Top |
Malignant transformation related pathway analysis |
| Find out the enriched GO biological processes and KEGG pathways involved in transition from healthy to precancer to cancer |
| Tissue | Disease Stage | Enriched GO biological Processes |
| Colorectum | AD |  |
| Colorectum | SER |  |
| Colorectum | MSS |  |
| Colorectum | MSI-H |  |
| Colorectum | FAP |  |
| ∗Top 15 enriched GO BP terms are showed in the bar plot of each disease state in each tissue. Each row represents a significant GO biological process which is colored according to the -log10(p.adjust). |
| Page: 1 2 3 4 5 6 7 8 9 |
| GO ID | Tissue | Disease Stage | Description | Gene Ratio | Bg Ratio | pvalue | p.adjust | Count |
| GO:003134616 | Esophagus | ESCC | positive regulation of cell projection organization | 201/8552 | 353/18723 | 1.19e-05 | 1.11e-04 | 201 |
| GO:001097516 | Esophagus | ESCC | regulation of neuron projection development | 240/8552 | 445/18723 | 2.48e-04 | 1.53e-03 | 240 |
| GO:00109764 | Esophagus | ESCC | positive regulation of neuron projection development | 91/8552 | 163/18723 | 5.72e-03 | 2.13e-02 | 91 |
| Page: 1 |
| Pathway ID | Tissue | Disease Stage | Description | Gene Ratio | Bg Ratio | pvalue | p.adjust | qvalue | Count |
| Page: 1 |
Top |
Cell-cell communication analysis |
| Identification of potential cell-cell interactions between two cell types and their ligand-receptor pairs for different disease states |
| Ligand | Receptor | LRpair | Pathway | Tissue | Disease Stage |
| Page: 1 |
Top |
Single-cell gene regulatory network inference analysis |
| Find out the significant the regulons (TFs) and the target genes of each regulon across cell types for different disease states |
| TF | Cell Type | Tissue | Disease Stage | Target Gene | RSS | Regulon Activity |
| ∗The dot plots of a searched regulon are shown for all cell subpopulations in each disease state of each tissue based on the regulon specific score inferred using pySCENIC and by calculating the average expression. |
| Page: 1 |
Top |
Somatic mutation of malignant transformation related genes |
| Annotation of somatic variants for genes involved in malignant transformation |
| Hugo Symbol | Variant Class | Variant Classification | dbSNP RS | HGVSc | HGVSp | HGVSp Short | SWISSPROT | BIOTYPE | SIFT | PolyPhen | Tumor Sample Barcode | Tissue | Histology | Sex | Age | Stage | Therapy Types | Drugs | Outcome |
| NCKIPSD | SNV | Missense_Mutation | novel | c.898G>C | p.Glu300Gln | p.E300Q | Q9NZQ3 | protein_coding | tolerated(0.06) | benign(0.115) | TCGA-A2-A0EQ-01 | Breast | breast invasive carcinoma | Female | <65 | I/II | Chemotherapy | adriamycin | SD |
| NCKIPSD | SNV | Missense_Mutation | c.469N>C | p.Asp157His | p.D157H | Q9NZQ3 | protein_coding | deleterious(0.01) | possibly_damaging(0.753) | TCGA-AC-A23H-01 | Breast | breast invasive carcinoma | Female | >=65 | I/II | Unknown | Unknown | PD | |
| NCKIPSD | SNV | Missense_Mutation | novel | c.1681C>G | p.Leu561Val | p.L561V | Q9NZQ3 | protein_coding | deleterious(0.02) | possibly_damaging(0.676) | TCGA-AC-A62Y-01 | Breast | breast invasive carcinoma | Female | >=65 | I/II | Unknown | Unknown | SD |
| NCKIPSD | SNV | Missense_Mutation | novel | c.367N>A | p.Asp123Asn | p.D123N | Q9NZQ3 | protein_coding | tolerated(0.14) | possibly_damaging(0.755) | TCGA-AN-A0XW-01 | Breast | breast invasive carcinoma | Female | <65 | III/IV | Unknown | Unknown | SD |
| NCKIPSD | SNV | Missense_Mutation | rs772604825 | c.734N>T | p.Pro245Leu | p.P245L | Q9NZQ3 | protein_coding | deleterious(0) | possibly_damaging(0.769) | TCGA-Z7-A8R6-01 | Breast | breast invasive carcinoma | Female | <65 | I/II | Chemotherapy | taxol | CR |
| NCKIPSD | SNV | Missense_Mutation | novel | c.620N>A | p.Ser207Tyr | p.S207Y | Q9NZQ3 | protein_coding | tolerated(0.19) | benign(0.259) | TCGA-C5-A2M1-01 | Cervix | cervical & endocervical cancer | Female | <65 | I/II | Unknown | Unknown | SD |
| NCKIPSD | insertion | Nonsense_Mutation | novel | c.1606_1607insGATCTTG | p.Asn536ArgfsTer3 | p.N536Rfs*3 | Q9NZQ3 | protein_coding | TCGA-DS-A1OD-01 | Cervix | cervical & endocervical cancer | Female | <65 | I/II | Chemotherapy | cisplatin | SD | ||
| NCKIPSD | SNV | Missense_Mutation | c.313N>C | p.Ser105Pro | p.S105P | Q9NZQ3 | protein_coding | deleterious(0.02) | benign(0.36) | TCGA-AA-3710-01 | Colorectum | colon adenocarcinoma | Female | >=65 | I/II | Unknown | Unknown | SD | |
| NCKIPSD | SNV | Missense_Mutation | rs762789060 | c.2110C>T | p.Arg704Cys | p.R704C | Q9NZQ3 | protein_coding | deleterious(0) | benign(0.427) | TCGA-AA-3949-01 | Colorectum | colon adenocarcinoma | Female | >=65 | III/IV | Unknown | Unknown | SD |
| NCKIPSD | SNV | Missense_Mutation | c.214N>A | p.Glu72Lys | p.E72K | Q9NZQ3 | protein_coding | deleterious(0.02) | probably_damaging(0.994) | TCGA-AA-A01P-01 | Colorectum | colon adenocarcinoma | Female | >=65 | III/IV | Unknown | Unknown | PD |
| Page: 1 2 3 4 5 |
Top |
Related drugs of malignant transformation related genes |
| Identification of chemicals and drugs interact with genes involved in malignant transfromation |
| (DGIdb 4.0) |
| Entrez ID | Symbol | Category | Interaction Types | Drug Claim Name | Drug Name | PMIDs |
| Page: 1 |

Copyright 2023-Present -The University of Texas Health Science Center at Houston |