
|
|||||
|
 | |
| |
| |
| |
| |
| |
|
Gene: NCKAP5L |
Gene summary for NCKAP5L |
| Gene information | Species | Human | Gene symbol | NCKAP5L | Gene ID | 57701 |
| Gene name | NCK associated protein 5 like | |
| Gene Alias | Cep169 | |
| Cytomap | 12q13.12 | |
| Gene Type | protein-coding | GO ID | GO:0000226 | UniProtAcc | Q9HCH0 |
Top |
Malignant transformation analysis |
| Identification of the aberrant gene expression in precancerous and cancerous lesions by comparing the gene expression of stem-like cells in diseased tissues with normal stem cells |
| Entrez ID | Symbol | Replicates | Species | Organ | Tissue | Adj P-value | Log2FC | Malignancy |
| 57701 | NCKAP5L | LZE8T | Human | Esophagus | ESCC | 2.16e-02 | 2.08e-02 | 0.067 |
| 57701 | NCKAP5L | LZE24T | Human | Esophagus | ESCC | 8.32e-05 | 1.37e-01 | 0.0596 |
| 57701 | NCKAP5L | P2T-E | Human | Esophagus | ESCC | 1.43e-24 | 4.97e-01 | 0.1177 |
| 57701 | NCKAP5L | P4T-E | Human | Esophagus | ESCC | 1.97e-08 | 1.21e-01 | 0.1323 |
| 57701 | NCKAP5L | P8T-E | Human | Esophagus | ESCC | 1.02e-15 | 2.04e-01 | 0.0889 |
| 57701 | NCKAP5L | P9T-E | Human | Esophagus | ESCC | 1.02e-03 | 3.30e-02 | 0.1131 |
| 57701 | NCKAP5L | P10T-E | Human | Esophagus | ESCC | 1.60e-09 | 1.76e-01 | 0.116 |
| 57701 | NCKAP5L | P11T-E | Human | Esophagus | ESCC | 6.25e-12 | 5.85e-01 | 0.1426 |
| 57701 | NCKAP5L | P12T-E | Human | Esophagus | ESCC | 1.30e-13 | 1.05e-01 | 0.1122 |
| 57701 | NCKAP5L | P15T-E | Human | Esophagus | ESCC | 6.62e-16 | 2.47e-01 | 0.1149 |
| 57701 | NCKAP5L | P16T-E | Human | Esophagus | ESCC | 5.03e-21 | 1.27e-01 | 0.1153 |
| 57701 | NCKAP5L | P17T-E | Human | Esophagus | ESCC | 5.08e-03 | 2.26e-01 | 0.1278 |
| 57701 | NCKAP5L | P20T-E | Human | Esophagus | ESCC | 2.26e-17 | 4.14e-01 | 0.1124 |
| 57701 | NCKAP5L | P21T-E | Human | Esophagus | ESCC | 3.57e-08 | 1.11e-01 | 0.1617 |
| 57701 | NCKAP5L | P22T-E | Human | Esophagus | ESCC | 4.09e-20 | 2.25e-01 | 0.1236 |
| 57701 | NCKAP5L | P23T-E | Human | Esophagus | ESCC | 3.40e-09 | 1.04e-01 | 0.108 |
| 57701 | NCKAP5L | P24T-E | Human | Esophagus | ESCC | 1.76e-04 | 6.39e-02 | 0.1287 |
| 57701 | NCKAP5L | P26T-E | Human | Esophagus | ESCC | 2.16e-17 | 2.00e-01 | 0.1276 |
| 57701 | NCKAP5L | P27T-E | Human | Esophagus | ESCC | 5.57e-21 | 3.75e-01 | 0.1055 |
| 57701 | NCKAP5L | P28T-E | Human | Esophagus | ESCC | 7.03e-09 | 2.10e-01 | 0.1149 |
| Page: 1 2 3 4 |
| Tissue | Expression Dynamics | Abbreviation |
| Esophagus |  | ESCC: Esophageal squamous cell carcinoma |
| HGIN: High-grade intraepithelial neoplasias | ||
| LGIN: Low-grade intraepithelial neoplasias | ||
| Oral Cavity | 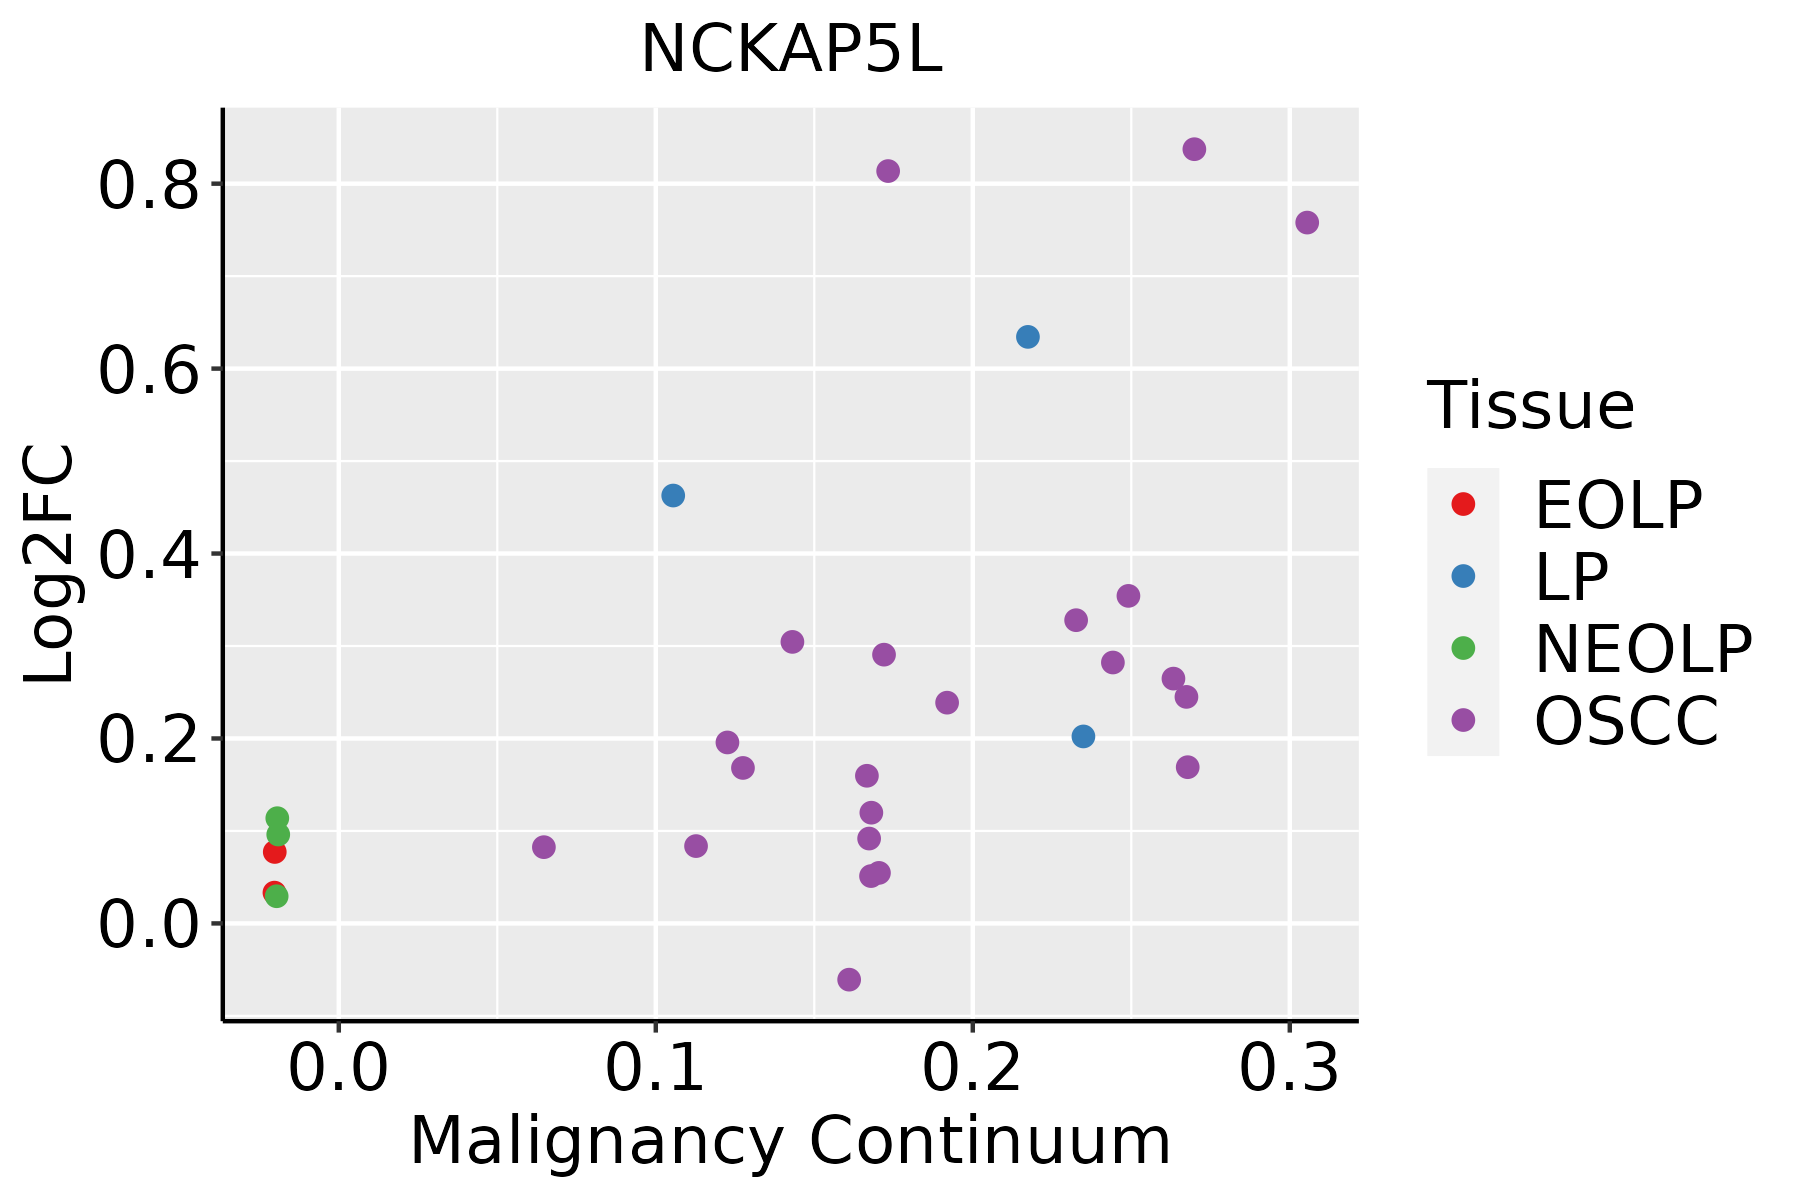 | EOLP: Erosive Oral lichen planus |
| LP: leukoplakia | ||
| NEOLP: Non-erosive oral lichen planus | ||
| OSCC: Oral squamous cell carcinoma | ||
| Thyroid |  | ATC: Anaplastic thyroid cancer |
| HT: Hashimoto's thyroiditis | ||
| PTC: Papillary thyroid cancer |
| ∗log2FC in expression of this searched gene in stem-like cells from each diseased tissue sample relative to stem-like cells in normal samples in each tissue plotted against the malignancy continuum. Samples are colored based on if they are from different disease stage. |
Top |
Malignant transformation related pathway analysis |
| Find out the enriched GO biological processes and KEGG pathways involved in transition from healthy to precancer to cancer |
| Tissue | Disease Stage | Enriched GO biological Processes |
| Colorectum | AD |  |
| Colorectum | SER |  |
| Colorectum | MSS |  |
| Colorectum | MSI-H |  |
| Colorectum | FAP |  |
| ∗Top 15 enriched GO BP terms are showed in the bar plot of each disease state in each tissue. Each row represents a significant GO biological process which is colored according to the -log10(p.adjust). |
| Page: 1 2 3 4 5 6 7 8 9 |
| GO ID | Tissue | Disease Stage | Description | Gene Ratio | Bg Ratio | pvalue | p.adjust | Count |
| GO:0022411111 | Esophagus | ESCC | cellular component disassembly | 305/8552 | 443/18723 | 1.94e-23 | 4.57e-21 | 305 |
| GO:003298416 | Esophagus | ESCC | protein-containing complex disassembly | 151/8552 | 224/18723 | 3.45e-11 | 1.15e-09 | 151 |
| GO:00311094 | Esophagus | ESCC | microtubule polymerization or depolymerization | 77/8552 | 122/18723 | 7.60e-05 | 5.68e-04 | 77 |
| GO:00436245 | Esophagus | ESCC | cellular protein complex disassembly | 78/8552 | 136/18723 | 4.00e-03 | 1.62e-02 | 78 |
| GO:002241119 | Oral cavity | OSCC | cellular component disassembly | 283/7305 | 443/18723 | 9.57e-27 | 3.37e-24 | 283 |
| GO:003298410 | Oral cavity | OSCC | protein-containing complex disassembly | 136/7305 | 224/18723 | 3.42e-11 | 1.13e-09 | 136 |
| GO:00311093 | Oral cavity | OSCC | microtubule polymerization or depolymerization | 68/7305 | 122/18723 | 1.29e-04 | 9.21e-04 | 68 |
| GO:00436244 | Oral cavity | OSCC | cellular protein complex disassembly | 68/7305 | 136/18723 | 5.84e-03 | 2.24e-02 | 68 |
| GO:0022411113 | Thyroid | PTC | cellular component disassembly | 232/5968 | 443/18723 | 1.36e-19 | 1.75e-17 | 232 |
| GO:0032984110 | Thyroid | PTC | protein-containing complex disassembly | 114/5968 | 224/18723 | 2.26e-09 | 6.33e-08 | 114 |
| GO:00436247 | Thyroid | PTC | cellular protein complex disassembly | 64/5968 | 136/18723 | 1.49e-04 | 1.15e-03 | 64 |
| GO:00512616 | Thyroid | PTC | protein depolymerization | 54/5968 | 114/18723 | 3.86e-04 | 2.59e-03 | 54 |
| GO:00311096 | Thyroid | PTC | microtubule polymerization or depolymerization | 57/5968 | 122/18723 | 4.19e-04 | 2.81e-03 | 57 |
| GO:002241124 | Thyroid | ATC | cellular component disassembly | 248/6293 | 443/18723 | 1.34e-22 | 3.69e-20 | 248 |
| GO:003298422 | Thyroid | ATC | protein-containing complex disassembly | 121/6293 | 224/18723 | 2.25e-10 | 6.59e-09 | 121 |
| GO:004362412 | Thyroid | ATC | cellular protein complex disassembly | 69/6293 | 136/18723 | 2.66e-05 | 2.28e-04 | 69 |
| GO:005126111 | Thyroid | ATC | protein depolymerization | 59/6293 | 114/18723 | 4.74e-05 | 3.80e-04 | 59 |
| GO:003110912 | Thyroid | ATC | microtubule polymerization or depolymerization | 61/6293 | 122/18723 | 1.30e-04 | 9.15e-04 | 61 |
| Page: 1 |
| Pathway ID | Tissue | Disease Stage | Description | Gene Ratio | Bg Ratio | pvalue | p.adjust | qvalue | Count |
| Page: 1 |
Top |
Cell-cell communication analysis |
| Identification of potential cell-cell interactions between two cell types and their ligand-receptor pairs for different disease states |
| Ligand | Receptor | LRpair | Pathway | Tissue | Disease Stage |
| Page: 1 |
Top |
Single-cell gene regulatory network inference analysis |
| Find out the significant the regulons (TFs) and the target genes of each regulon across cell types for different disease states |
| TF | Cell Type | Tissue | Disease Stage | Target Gene | RSS | Regulon Activity |
| ∗The dot plots of a searched regulon are shown for all cell subpopulations in each disease state of each tissue based on the regulon specific score inferred using pySCENIC and by calculating the average expression. |
| Page: 1 |
Top |
Somatic mutation of malignant transformation related genes |
| Annotation of somatic variants for genes involved in malignant transformation |
| Hugo Symbol | Variant Class | Variant Classification | dbSNP RS | HGVSc | HGVSp | HGVSp Short | SWISSPROT | BIOTYPE | SIFT | PolyPhen | Tumor Sample Barcode | Tissue | Histology | Sex | Age | Stage | Therapy Types | Drugs | Outcome |
| NCKAP5L | SNV | Missense_Mutation | rs777291064 | c.2857G>A | p.Glu953Lys | p.E953K | Q9HCH0 | protein_coding | deleterious(0.03) | probably_damaging(0.939) | TCGA-A2-A25D-01 | Breast | breast invasive carcinoma | Female | >=65 | III/IV | Hormone Therapy | tamoxiphen | SD |
| NCKAP5L | SNV | Missense_Mutation | rs776684576 | c.2026N>A | p.Glu676Lys | p.E676K | Q9HCH0 | protein_coding | deleterious(0.04) | possibly_damaging(0.49) | TCGA-AC-A5XS-01 | Breast | breast invasive carcinoma | Female | >=65 | I/II | Hormone Therapy | femara | SD |
| NCKAP5L | SNV | Missense_Mutation | c.3296N>T | p.Ser1099Leu | p.S1099L | Q9HCH0 | protein_coding | deleterious(0.03) | benign(0.024) | TCGA-AN-A046-01 | Breast | breast invasive carcinoma | Female | >=65 | I/II | Unknown | Unknown | SD | |
| NCKAP5L | SNV | Missense_Mutation | novel | c.997N>A | p.Glu333Lys | p.E333K | Q9HCH0 | protein_coding | deleterious_low_confidence(0.05) | possibly_damaging(0.724) | TCGA-C8-A3M7-01 | Breast | breast invasive carcinoma | Female | <65 | III/IV | Unknown | Unknown | PD |
| NCKAP5L | SNV | Missense_Mutation | novel | c.1202N>A | p.Gly401Glu | p.G401E | Q9HCH0 | protein_coding | tolerated_low_confidence(0.07) | benign(0.067) | TCGA-C8-A8HR-01 | Breast | breast invasive carcinoma | Female | <65 | III/IV | Chemotherapy | 5-fluorouracil | CR |
| NCKAP5L | SNV | Missense_Mutation | novel | c.3131G>T | p.Arg1044Leu | p.R1044L | Q9HCH0 | protein_coding | tolerated(0.3) | benign(0.037) | TCGA-LL-A7SZ-01 | Breast | breast invasive carcinoma | Female | <65 | I/II | Chemotherapy | adriamycin | CR |
| NCKAP5L | insertion | In_Frame_Ins | novel | c.2253_2254insACC | p.Val751_Tyr752insThr | p.V751_Y752insT | Q9HCH0 | protein_coding | TCGA-BH-A0BA-01 | Breast | breast invasive carcinoma | Female | <65 | III/IV | Chemotherapy | cytoxan | SD | ||
| NCKAP5L | SNV | Missense_Mutation | novel | c.2227N>G | p.Leu743Val | p.L743V | Q9HCH0 | protein_coding | tolerated(0.51) | benign(0.049) | TCGA-2W-A8YY-01 | Cervix | cervical & endocervical cancer | Female | <65 | I/II | Chemotherapy | cisplatin | CR |
| NCKAP5L | SNV | Missense_Mutation | rs200412489 | c.134N>T | p.Ser45Leu | p.S45L | Q9HCH0 | protein_coding | tolerated(0.08) | benign(0.019) | TCGA-2W-A8YY-01 | Cervix | cervical & endocervical cancer | Female | <65 | I/II | Chemotherapy | cisplatin | CR |
| NCKAP5L | SNV | Missense_Mutation | rs759933878 | c.3815G>A | p.Arg1272Gln | p.R1272Q | Q9HCH0 | protein_coding | tolerated(0.28) | benign(0.003) | TCGA-C5-A901-01 | Cervix | cervical & endocervical cancer | Female | <65 | I/II | Unknown | Unknown | SD |
| Page: 1 2 3 4 5 6 7 8 9 10 11 12 |
Top |
Related drugs of malignant transformation related genes |
| Identification of chemicals and drugs interact with genes involved in malignant transfromation |
| (DGIdb 4.0) |
| Entrez ID | Symbol | Category | Interaction Types | Drug Claim Name | Drug Name | PMIDs |
| Page: 1 |

Copyright 2023-Present -The University of Texas Health Science Center at Houston |