Schematic overview of the cellular and molecular mechanisms involved in the cancer progression, including the proposed cellular and molecular mechanisms in cancer cells trajectory. AT1: alveolar type 1 cells; AT2: alveolar type 2 cells; AAH: atypical adenomatous hyperplasia; AIS: adenocarcinoma in situ; MIA: minimally invasive adenocarcinoma; IA: invasive adenocarcinoma; EMT: epithelial-mesenchymal transition

Home

Download

Statistics

Help

Contact

Center for Computational Systems Medicine
leaf

Gene summary

leaf

Malignant transformation analysis

leaf

Malignant transformation related pathway analysis

leaf

Cell-cell communication analysis

leaf

Single-cell gene regulatory network inference analysis

leaf

Somatic mutation of malignant transformation related genes

leaf

Related drugs of malignant transformation related genes

Gene: NCKAP5

Gene summary for NCKAP5

check button Gene summary.

Gene informationSpeciesHuman
Gene symbol

NCKAP5

Gene ID

344148

Gene nameNCK associated protein 5
Gene AliasERIH1
Cytomap2q21.2
Gene Typeprotein-coding
GO ID

GO:0000226

UniProtAcc

O14513


Top

Malignant transformation analysis

check button Identification of the aberrant gene expression in precancerous and cancerous lesions by comparing the gene expression of stem-like cells in diseased tissues with normal stem cells
check button Malignant transformation involving gene list.
Entrez IDSymbolReplicatesSpeciesOrganTissueAdj P-valueLog2FCMalignancy
344148NCKAP5HTA11_2487_2000001011HumanColorectumSER1.46e-066.15e-01-0.1808
344148NCKAP5HTA11_1938_2000001011HumanColorectumAD2.45e-139.66e-01-0.0811
344148NCKAP5HTA11_78_2000001011HumanColorectumAD3.03e-076.59e-01-0.1088
344148NCKAP5HTA11_347_2000001011HumanColorectumAD6.44e-136.56e-01-0.1954
344148NCKAP5HTA11_3361_2000001011HumanColorectumAD4.20e-054.56e-01-0.1207
344148NCKAP5HTA11_83_2000001011HumanColorectumSER1.30e-077.09e-01-0.1526
344148NCKAP5HTA11_696_2000001011HumanColorectumAD3.11e-084.35e-01-0.1464
344148NCKAP5HTA11_866_2000001011HumanColorectumAD9.85e-073.49e-01-0.1001
344148NCKAP5HTA11_7663_2000001011HumanColorectumSER2.36e-069.60e-010.0131
344148NCKAP5HTA11_7696_3000711011HumanColorectumAD3.08e-074.35e-010.0674
344148NCKAP5HTA11_6818_2000001021HumanColorectumAD3.48e-181.14e+000.0588
344148NCKAP5HTA11_99999970781_79442HumanColorectumMSS4.17e-064.43e-010.294
344148NCKAP5HTA11_99999965062_69753HumanColorectumMSI-H1.12e-041.21e+000.3487
344148NCKAP5HTA11_99999974143_84620HumanColorectumMSS1.19e-401.20e+000.3005
344148NCKAP5A015-C-203HumanColorectumFAP3.22e-082.44e-01-0.1294
344148NCKAP5A002-C-201HumanColorectumFAP5.88e-04-1.59e-010.0324
344148NCKAP5A001-C-119HumanColorectumFAP2.02e-116.56e-01-0.1557
344148NCKAP5A001-C-108HumanColorectumFAP4.41e-032.54e-02-0.0272
344148NCKAP5A002-C-205HumanColorectumFAP1.43e-059.06e-02-0.1236
344148NCKAP5A015-C-006HumanColorectumFAP1.84e-031.09e-01-0.0994
Page: 1 2 3 4 

check button Transcriptomic changes along malignancy continuum.
TissueExpression DynamicsAbbreviation
Colorectum (GSE201348)The image shows the transcriptomic changes along malignancy continuum.log2FC in expression of this searched gene in stem-like cells from each diseased tissue sample relative to stem-like cells in normal samples in each tissue plotted against the malignancy continuum. Samples are colored based on if they are from different disease stage.FAP: Familial adenomatous polyposis
CRC: Colorectal cancer
Colorectum (HTA11)The image shows the transcriptomic changes along malignancy continuum.log2FC in expression of this searched gene in stem-like cells from each diseased tissue sample relative to stem-like cells in normal samples in each tissue plotted against the malignancy continuum. Samples are colored based on if they are from different disease stage.AD: Adenomas
SER: Sessile serrated lesions
MSI-H: Microsatellite-high colorectal cancer
MSS: Microsatellite stable colorectal cancer
EsophagusThe image shows the transcriptomic changes along malignancy continuum.log2FC in expression of this searched gene in stem-like cells from each diseased tissue sample relative to stem-like cells in normal samples in each tissue plotted against the malignancy continuum. Samples are colored based on if they are from different disease stage.
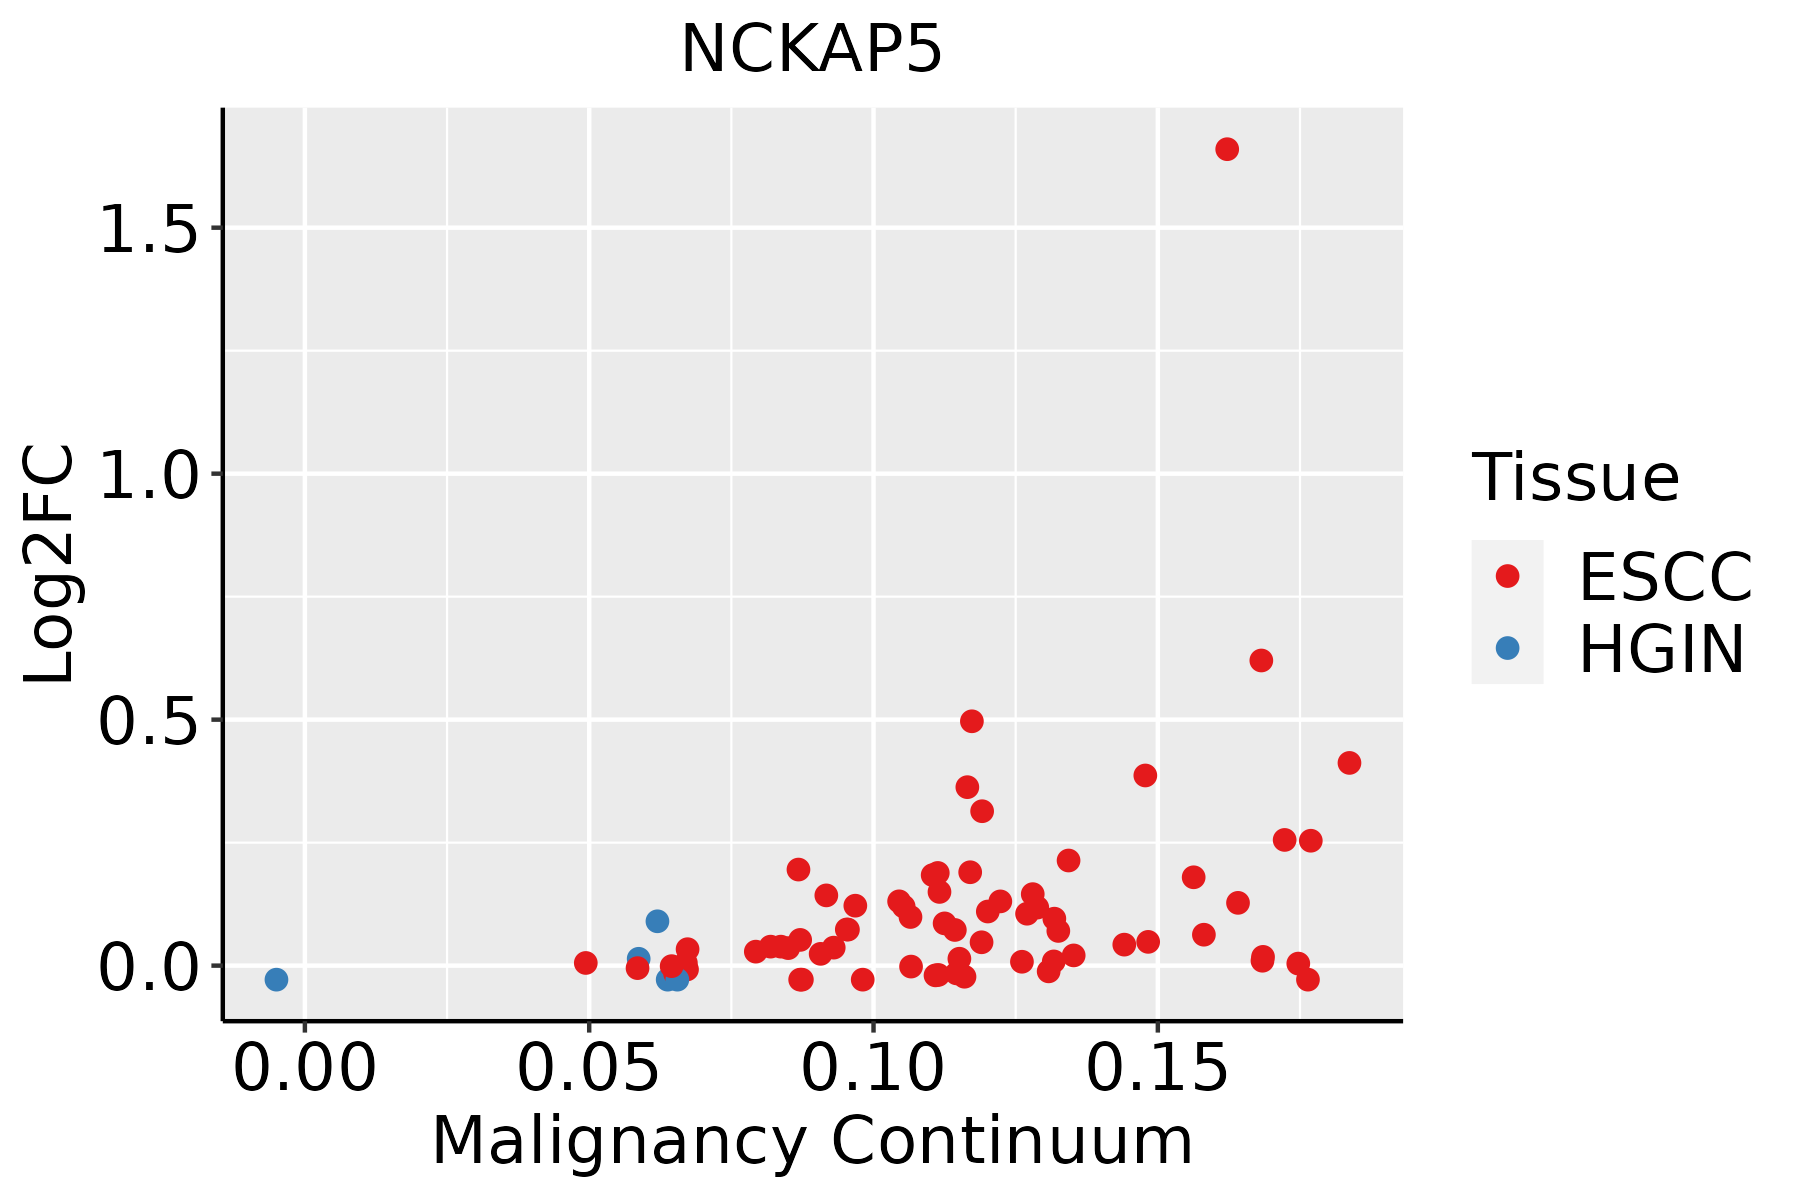
ESCC: Esophageal squamous cell carcinoma
HGIN: High-grade intraepithelial neoplasias
LGIN: Low-grade intraepithelial neoplasias
GCThe image shows the transcriptomic changes along malignancy continuum.log2FC in expression of this searched gene in stem-like cells from each diseased tissue sample relative to stem-like cells in normal samples in each tissue plotted against the malignancy continuum. Samples are colored based on if they are from different disease stage.
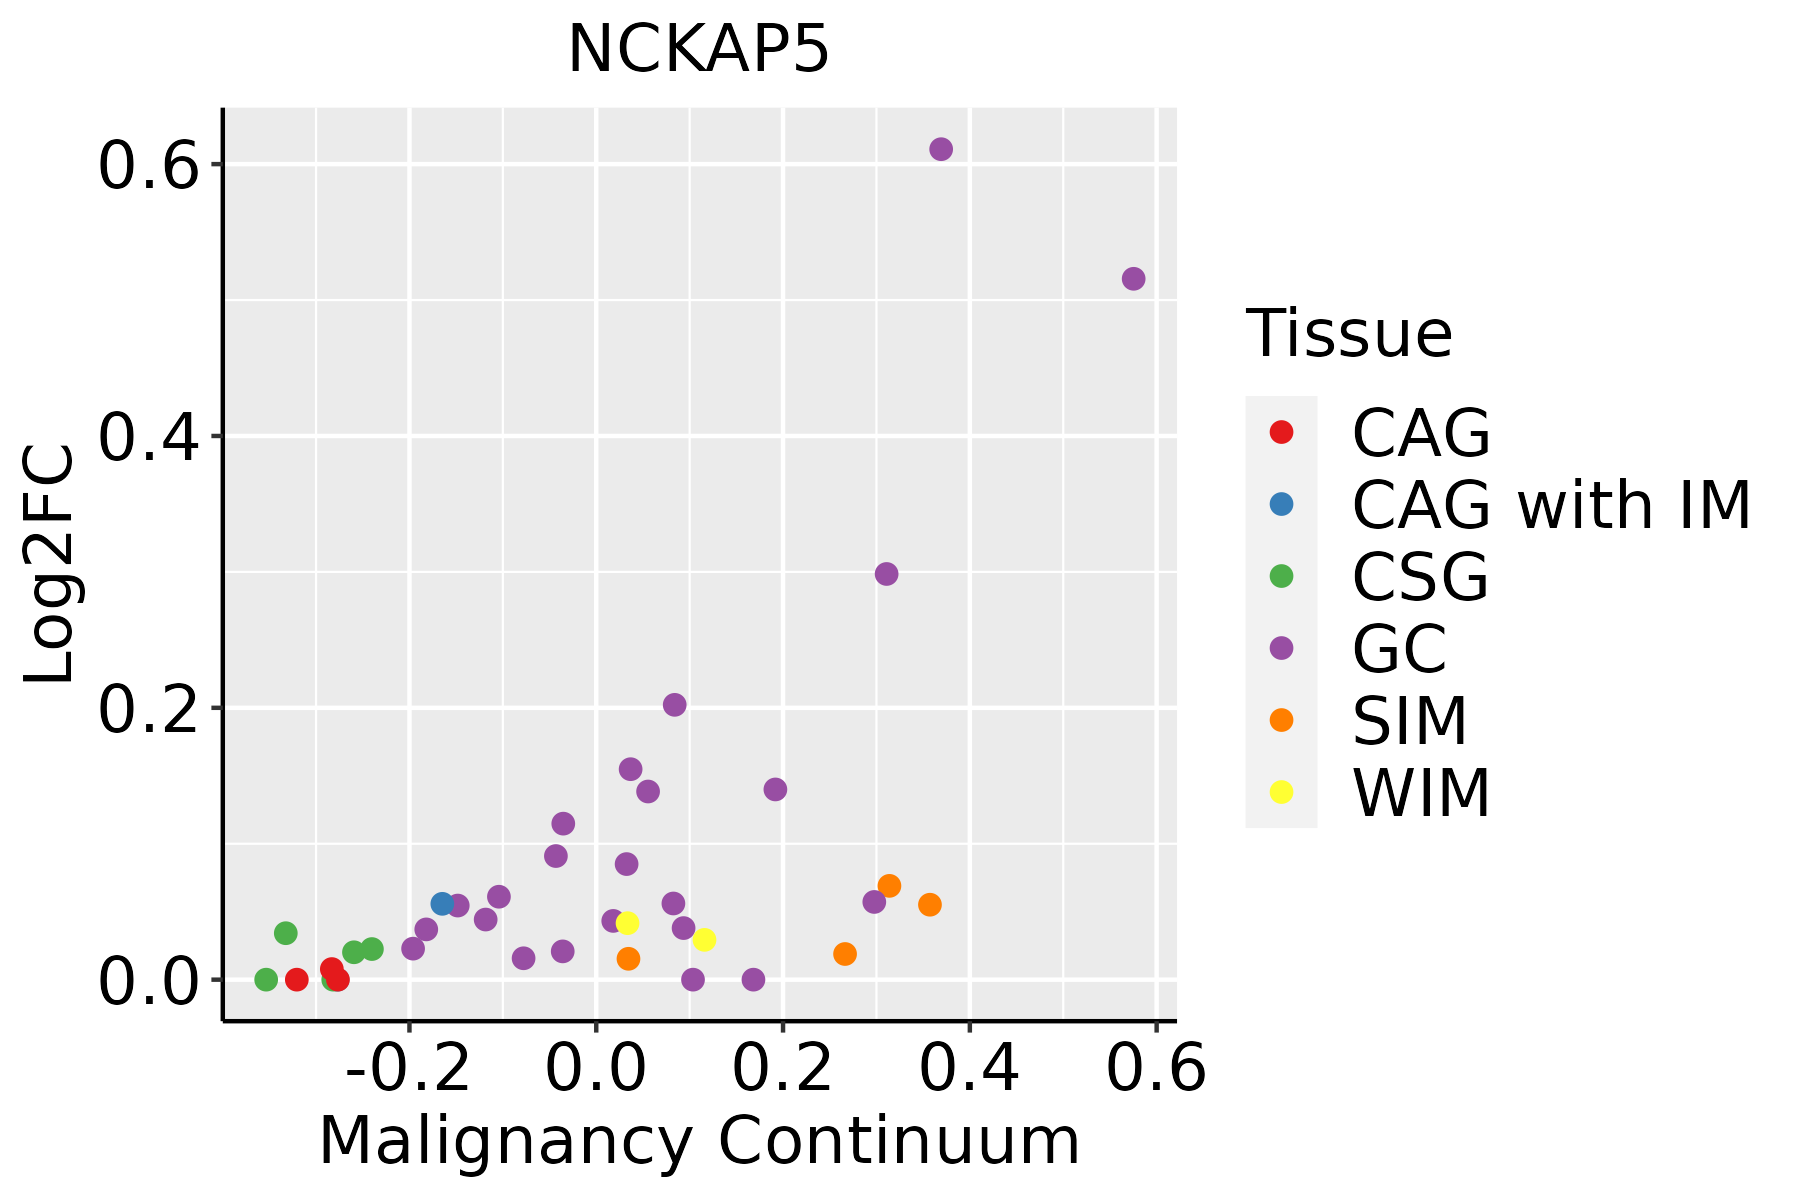
CAG: Chronic atrophic gastritis
CAG with IM: Chronic atrophic gastritis with intestinal metaplasia
CSG: Chronic superficial gastritis
GC: Gastric cancer
SIM: Severe intestinal metaplasia
WIM: Wild intestinal metaplasia
Oral CavityThe image shows the transcriptomic changes along malignancy continuum.log2FC in expression of this searched gene in stem-like cells from each diseased tissue sample relative to stem-like cells in normal samples in each tissue plotted against the malignancy continuum. Samples are colored based on if they are from different disease stage.
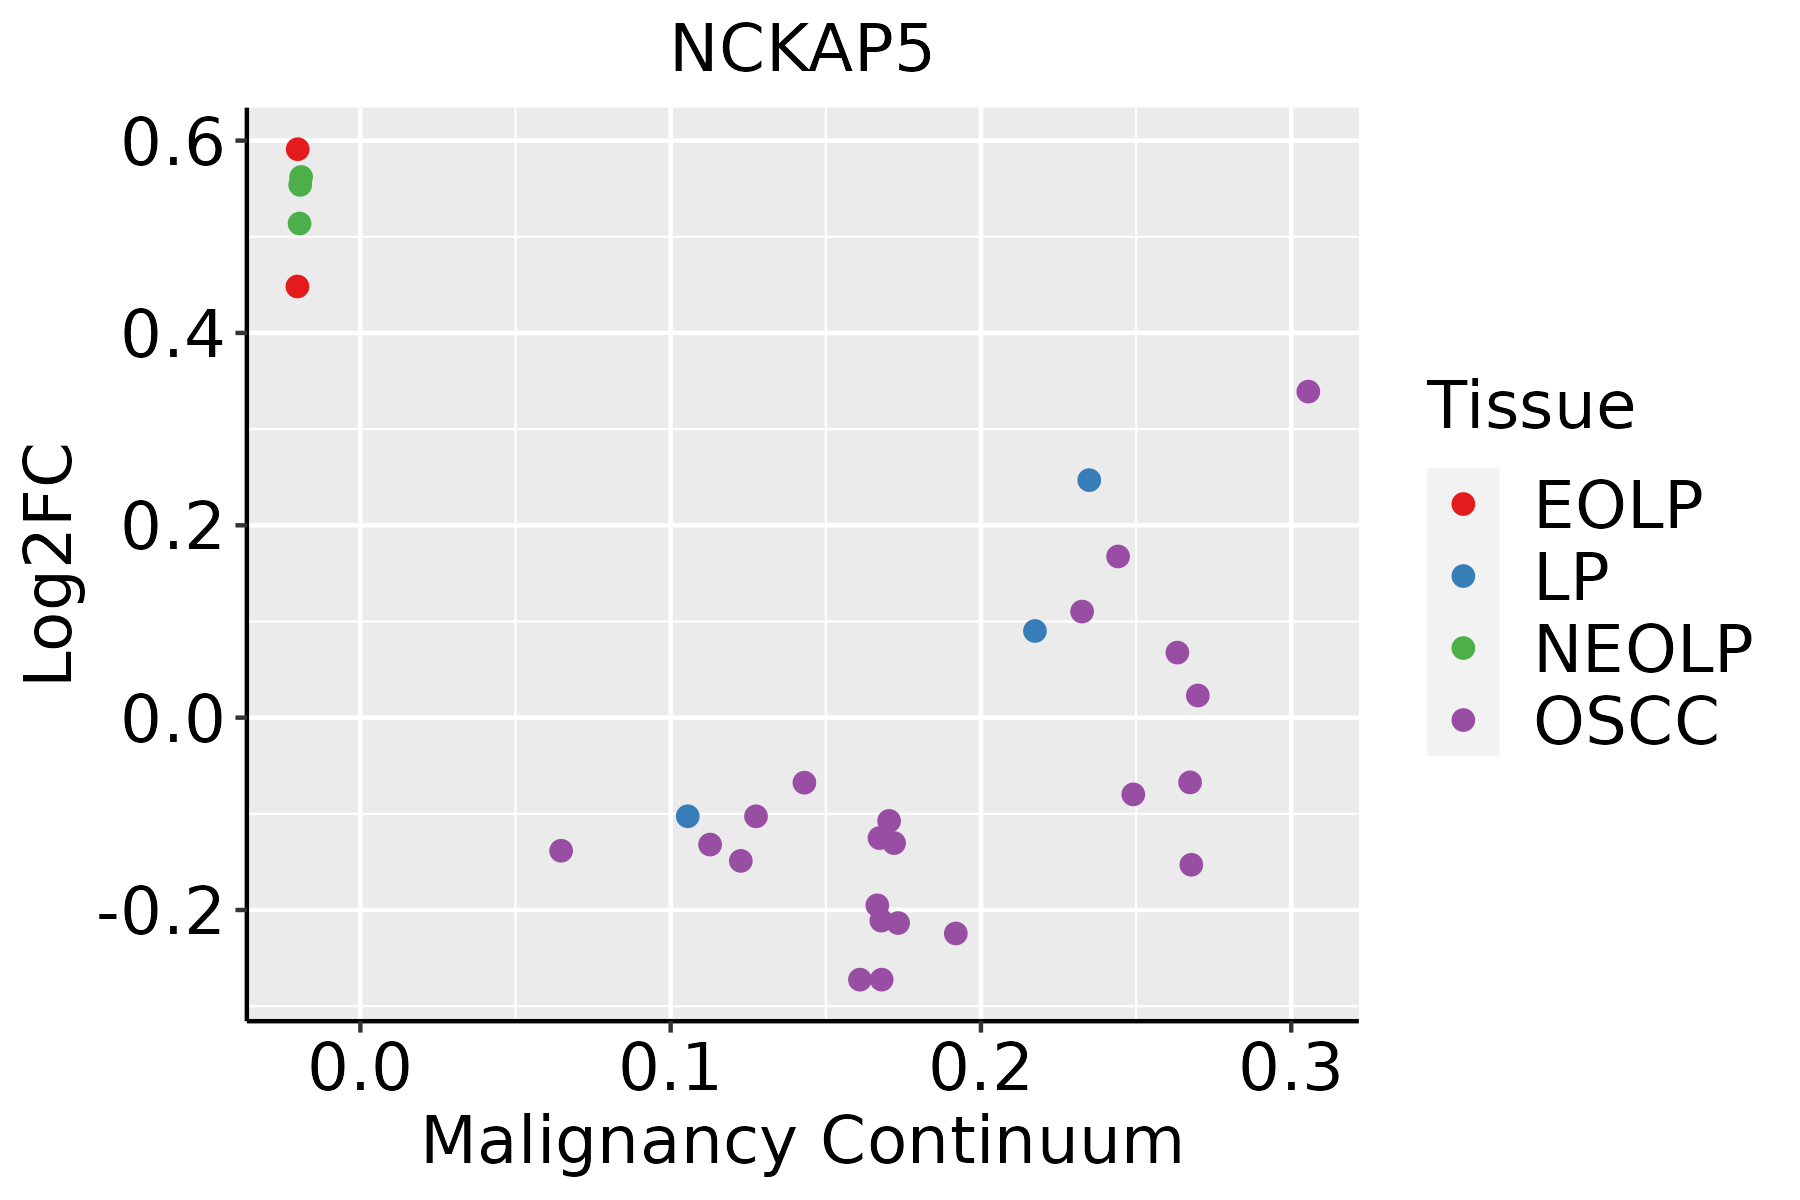
EOLP: Erosive Oral lichen planus
LP: leukoplakia
NEOLP: Non-erosive oral lichen planus
OSCC: Oral squamous cell carcinoma
SkinThe image shows the transcriptomic changes along malignancy continuum.log2FC in expression of this searched gene in stem-like cells from each diseased tissue sample relative to stem-like cells in normal samples in each tissue plotted against the malignancy continuum. Samples are colored based on if they are from different disease stage.AK: Actinic keratosis
cSCC: Cutaneous squamous cell carcinoma
SCCIS:squamous cell carcinoma in situ
∗log2FC in expression of this searched gene in stem-like cells from each diseased tissue sample relative to stem-like cells in normal samples in each tissue plotted against the malignancy continuum. Samples are colored based on if they are from different disease stage.

Top

Malignant transformation related pathway analysis

check buttonFind out the enriched GO biological processes and KEGG pathways involved in transition from healthy to precancer to cancer
check button Figure of enriched GO biological processes.
TissueDisease StageEnriched GO biological Processes
ColorectumADGO analysis - Figure of enriched GO biological processes: Top 15 enriched GO BP terms are showed in the bar plot of each disease state in each tissue. Each row represents a significant GO biological process which is colored according to the -log10(p.adjust).
ColorectumSERGO analysis - Figure of enriched GO biological processes: Top 15 enriched GO BP terms are showed in the bar plot of each disease state in each tissue. Each row represents a significant GO biological process which is colored according to the -log10(p.adjust).
ColorectumMSSGO analysis - Figure of enriched GO biological processes: Top 15 enriched GO BP terms are showed in the bar plot of each disease state in each tissue. Each row represents a significant GO biological process which is colored according to the -log10(p.adjust).
ColorectumMSI-HGO analysis - Figure of enriched GO biological processes: Top 15 enriched GO BP terms are showed in the bar plot of each disease state in each tissue. Each row represents a significant GO biological process which is colored according to the -log10(p.adjust).
ColorectumFAPGO analysis - Figure of enriched GO biological processes: Top 15 enriched GO BP terms are showed in the bar plot of each disease state in each tissue. Each row represents a significant GO biological process which is colored according to the -log10(p.adjust).
∗Top 15 enriched GO BP terms are showed in the bar plot of each disease state in each tissue. Each row represents a significant GO biological process which is colored according to the -log10(p.adjust).
Page: 1 2 3 4 5 6 7 8 9 

check button Enriched GO biological processes.
GO IDTissueDisease StageDescriptionGene RatioBg Ratiopvaluep.adjustCount
GO:0022411ColorectumADcellular component disassembly147/3918443/187238.53e-106.76e-08147
GO:0032984ColorectumADprotein-containing complex disassembly81/3918224/187239.41e-084.65e-0681
GO:0043624ColorectumADcellular protein complex disassembly45/3918136/187236.24e-046.48e-0345
GO:0051261ColorectumADprotein depolymerization39/3918114/187236.74e-046.91e-0339
GO:00224111ColorectumSERcellular component disassembly114/2897443/187231.17e-089.59e-07114
GO:00329841ColorectumSERprotein-containing complex disassembly61/2897224/187234.17e-061.60e-0461
GO:00436241ColorectumSERcellular protein complex disassembly37/2897136/187233.08e-045.00e-0337
GO:00512611ColorectumSERprotein depolymerization31/2897114/187239.18e-041.11e-0231
GO:00224112ColorectumMSScellular component disassembly130/3467443/187231.44e-088.46e-07130
GO:00329842ColorectumMSSprotein-containing complex disassembly69/3467224/187235.61e-061.50e-0469
GO:00329843ColorectumMSI-Hprotein-containing complex disassembly28/1319224/187232.24e-033.01e-0228
GO:00224113ColorectumMSI-Hcellular component disassembly47/1319443/187233.26e-033.99e-0247
GO:00224114ColorectumFAPcellular component disassembly97/2622443/187233.44e-061.23e-0497
GO:00329844ColorectumFAPprotein-containing complex disassembly54/2622224/187233.37e-057.48e-0454
GO:00512612ColorectumFAPprotein depolymerization26/2622114/187237.36e-034.40e-0226
GO:00329845ColorectumCRCprotein-containing complex disassembly46/2078224/187232.61e-057.18e-0446
GO:00224115ColorectumCRCcellular component disassembly75/2078443/187231.26e-042.42e-0375
GO:00512613ColorectumCRCprotein depolymerization22/2078114/187236.73e-034.77e-0222
GO:0022411111EsophagusESCCcellular component disassembly305/8552443/187231.94e-234.57e-21305
GO:003298416EsophagusESCCprotein-containing complex disassembly151/8552224/187233.45e-111.15e-09151
Page: 1 2 3 

check button Enriched KEGG pathways.
Pathway IDTissueDisease StageDescriptionGene RatioBg Ratiopvaluep.adjustqvalueCount
Page: 1 

Top

Cell-cell communication analysis

check buttonIdentification of potential cell-cell interactions between two cell types and their ligand-receptor pairs for different disease states
LigandReceptorLRpairPathwayTissueDisease Stage
Page: 1 

Top

Single-cell gene regulatory network inference analysis

check buttonFind out the significant the regulons (TFs) and the target genes of each regulon across cell types for different disease states
TFCell TypeTissueDisease StageTarget GeneRSSRegulon Activity
∗The dot plots of a searched regulon are shown for all cell subpopulations in each disease state of each tissue based on the regulon specific score inferred using pySCENIC and by calculating the average expression.
Page: 1 

Top

Somatic mutation of malignant transformation related genes

check buttonAnnotation of somatic variants for genes involved in malignant transformation
Hugo SymbolVariant ClassVariant ClassificationdbSNP RSHGVScHGVSpHGVSp ShortSWISSPROTBIOTYPESIFTPolyPhenTumor Sample BarcodeTissueHistologySexAgeStageTherapy TypesDrugsOutcome
NCKAP5SNVMissense_Mutationc.4900G>Ap.Glu1634Lysp.E1634KO14513protein_codingdeleterious(0.03)benign(0.058)TCGA-A2-A0EQ-01Breastbreast invasive carcinomaFemale<65I/IIChemotherapyadriamycinSD
NCKAP5SNVMissense_Mutationnovelc.278N>Gp.Glu93Glyp.E93GO14513protein_codingdeleterious(0)possibly_damaging(0.852)TCGA-A2-A0SW-01Breastbreast invasive carcinomaFemale>=65III/IVHormone TherapyarimidexPD
NCKAP5SNVMissense_Mutationnovelc.3826N>Gp.His1276Aspp.H1276DO14513protein_codingdeleterious(0)benign(0.009)TCGA-A7-A6VY-01Breastbreast invasive carcinomaFemale<65I/IIChemotherapycyclophosphamideCR
NCKAP5SNVMissense_Mutationc.3716N>Tp.Gly1239Valp.G1239VO14513protein_codingtolerated(0.36)benign(0.146)TCGA-AN-A0AK-01Breastbreast invasive carcinomaFemale>=65I/IIUnknownUnknownSD
NCKAP5SNVMissense_Mutationc.1820C>Tp.Ala607Valp.A607VO14513protein_codingdeleterious(0.01)benign(0.035)TCGA-AO-A0J4-01Breastbreast invasive carcinomaFemale<65I/IIChemotherapydoxorubicinSD
NCKAP5SNVMissense_Mutationnovelc.139N>Cp.Trp47Argp.W47RO14513protein_codingtolerated(0.4)probably_damaging(0.999)TCGA-AO-A128-01Breastbreast invasive carcinomaFemale<65I/IIChemotherapydoxorubicinSD
NCKAP5SNVMissense_Mutationnovelc.2005G>Tp.Val669Leup.V669LO14513protein_codingdeleterious(0.02)probably_damaging(0.944)TCGA-AR-A0U0-01Breastbreast invasive carcinomaFemale>=65I/IIUnknownUnknownSD
NCKAP5SNVMissense_Mutationc.251N>Cp.Arg84Prop.R84PO14513protein_codingdeleterious(0)probably_damaging(0.984)TCGA-B6-A0IJ-01Breastbreast invasive carcinomaFemale<65I/IIUnknownUnknownSD
NCKAP5SNVMissense_Mutationc.5612N>Ap.Ala1871Aspp.A1871DO14513protein_codingdeleterious(0)possibly_damaging(0.847)TCGA-E9-A1RF-01Breastbreast invasive carcinomaFemale>=65III/IVHormone TherapytamoxiphenSD
NCKAP5SNVMissense_Mutationrs367809146c.3374N>Tp.Ala1125Valp.A1125VO14513protein_codingtolerated(0.49)benign(0)TCGA-E9-A1RH-01Breastbreast invasive carcinomaFemale<65I/IIChemotherapy5-fluorouracilSD
Page: 1 2 3 4 5 6 7 8 9 10 11 12 13 14 15 16 17 18 19 20 21 22 23 24 25 26 27 28 29 30 31 32 33 

Top

Related drugs of malignant transformation related genes

check buttonIdentification of chemicals and drugs interact with genes involved in malignant transfromation
(DGIdb 4.0)
Entrez IDSymbolCategoryInteraction TypesDrug Claim NameDrug NamePMIDs
Page: 1