| Tissue | Expression Dynamics | Abbreviation |
| Cervix | 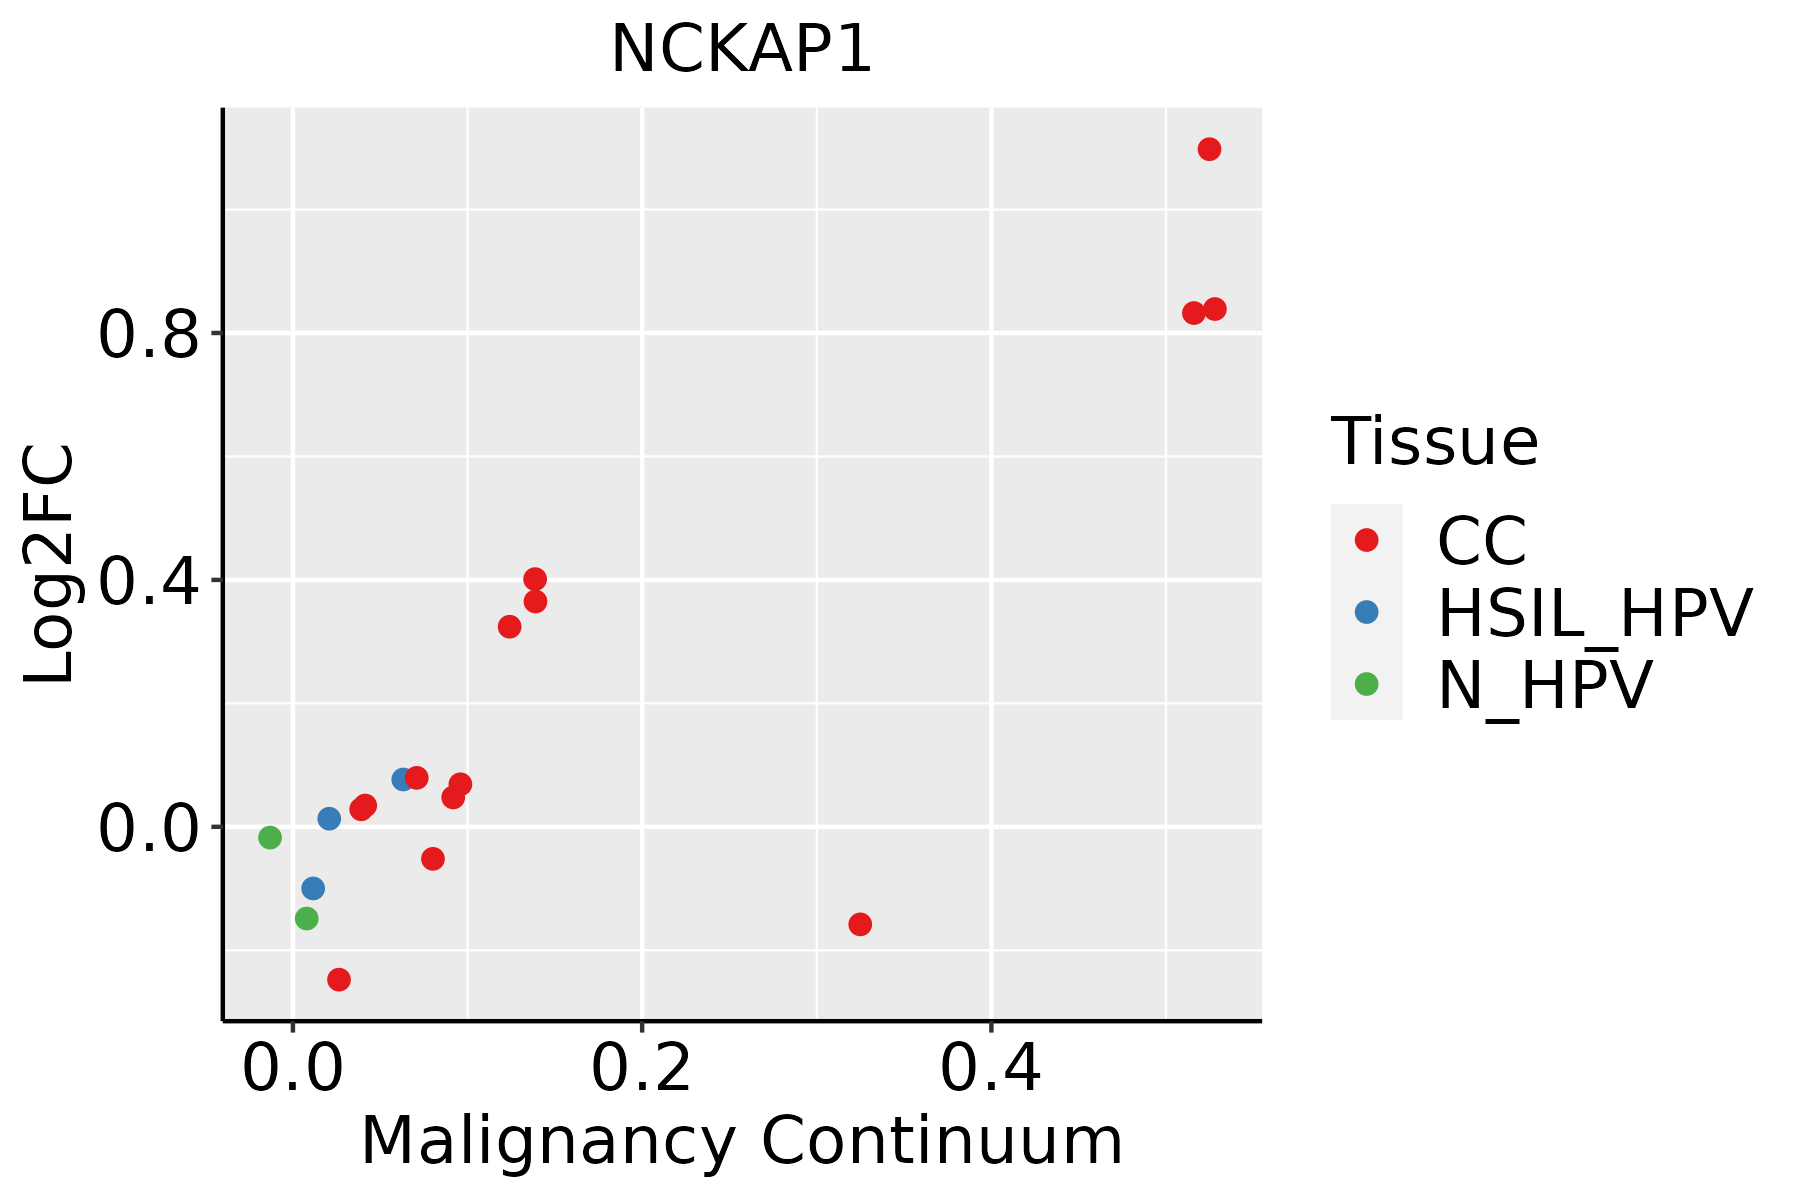 | CC: Cervix cancer |
| HSIL_HPV: HPV-infected high-grade squamous intraepithelial lesions |
| N_HPV: HPV-infected normal cervix |
| Colorectum (GSE201348) |  | FAP: Familial adenomatous polyposis |
| CRC: Colorectal cancer |
| Colorectum (HTA11) |  | AD: Adenomas |
| SER: Sessile serrated lesions |
| MSI-H: Microsatellite-high colorectal cancer |
| MSS: Microsatellite stable colorectal cancer |
| Esophagus | 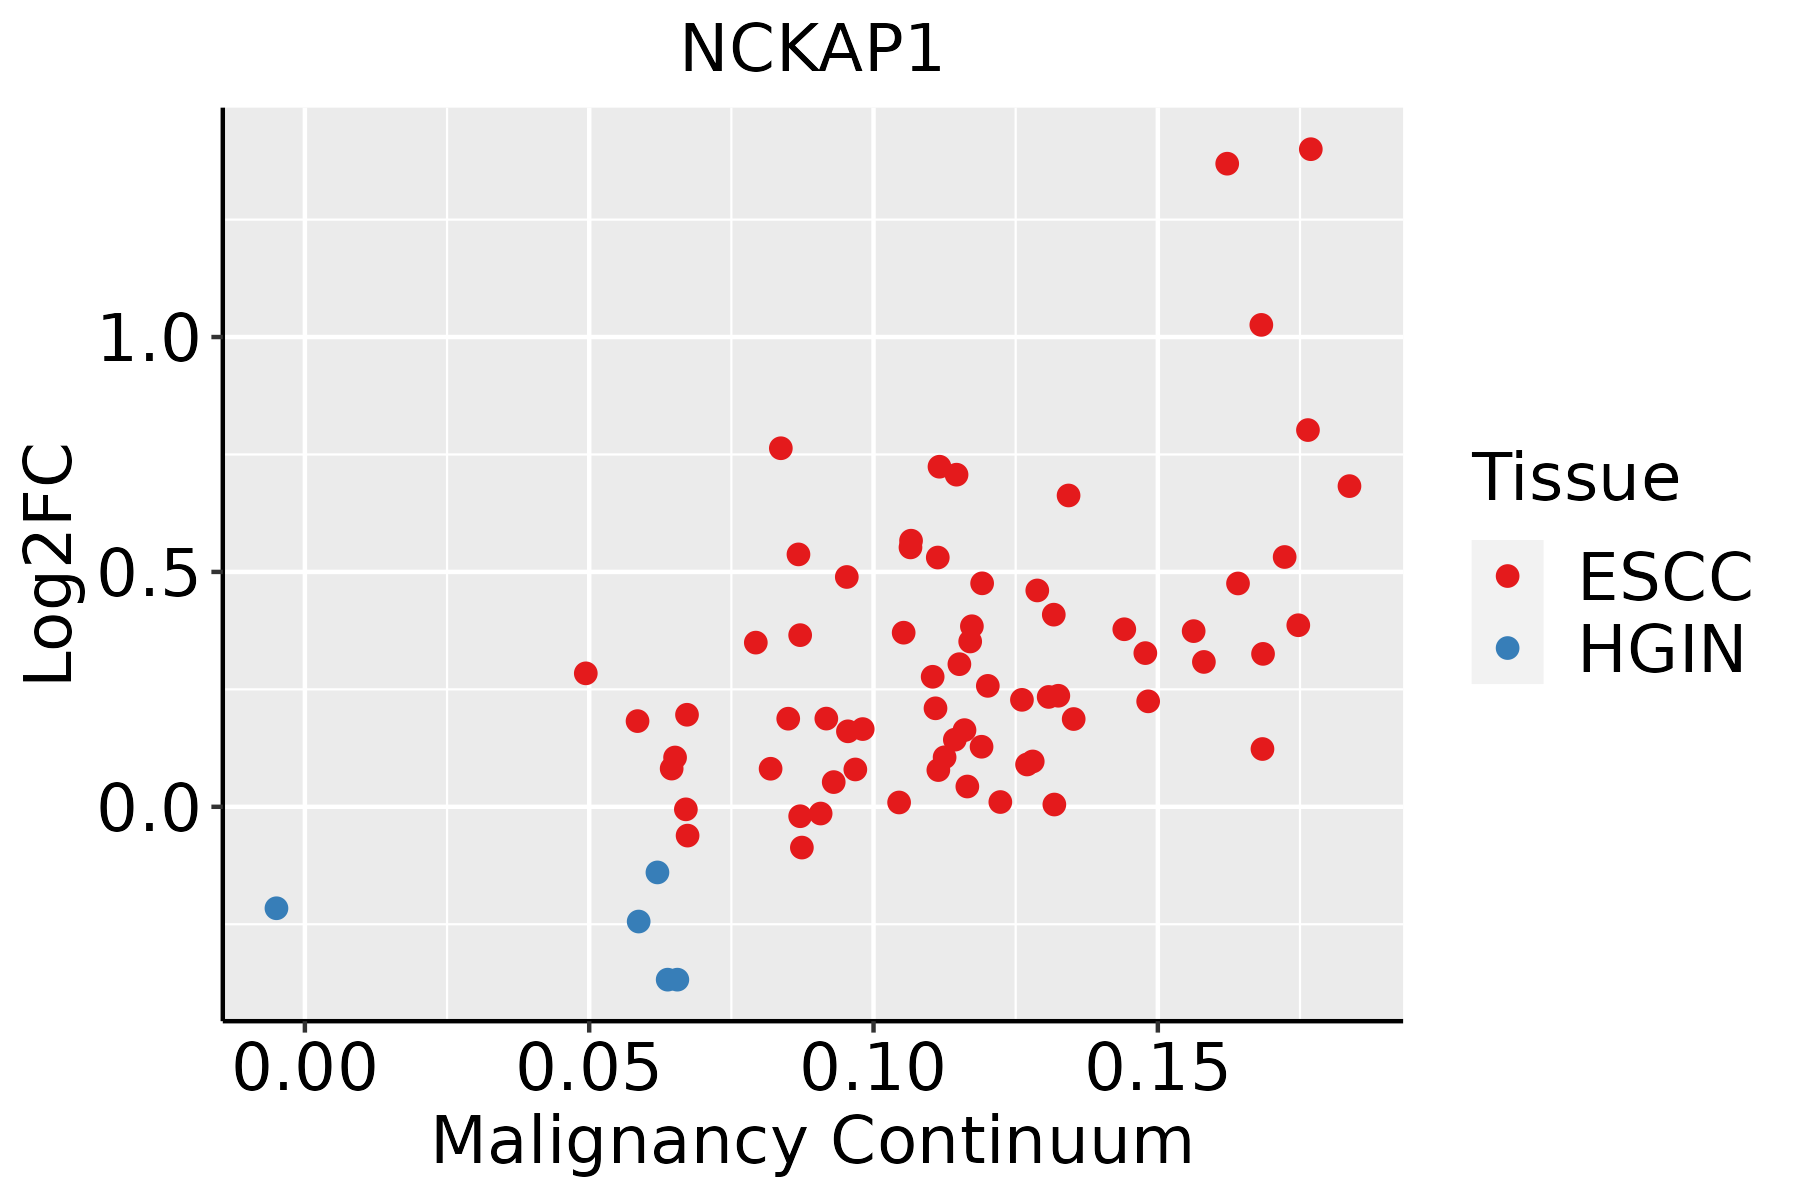 | ESCC: Esophageal squamous cell carcinoma |
| HGIN: High-grade intraepithelial neoplasias |
| LGIN: Low-grade intraepithelial neoplasias |
| Liver | 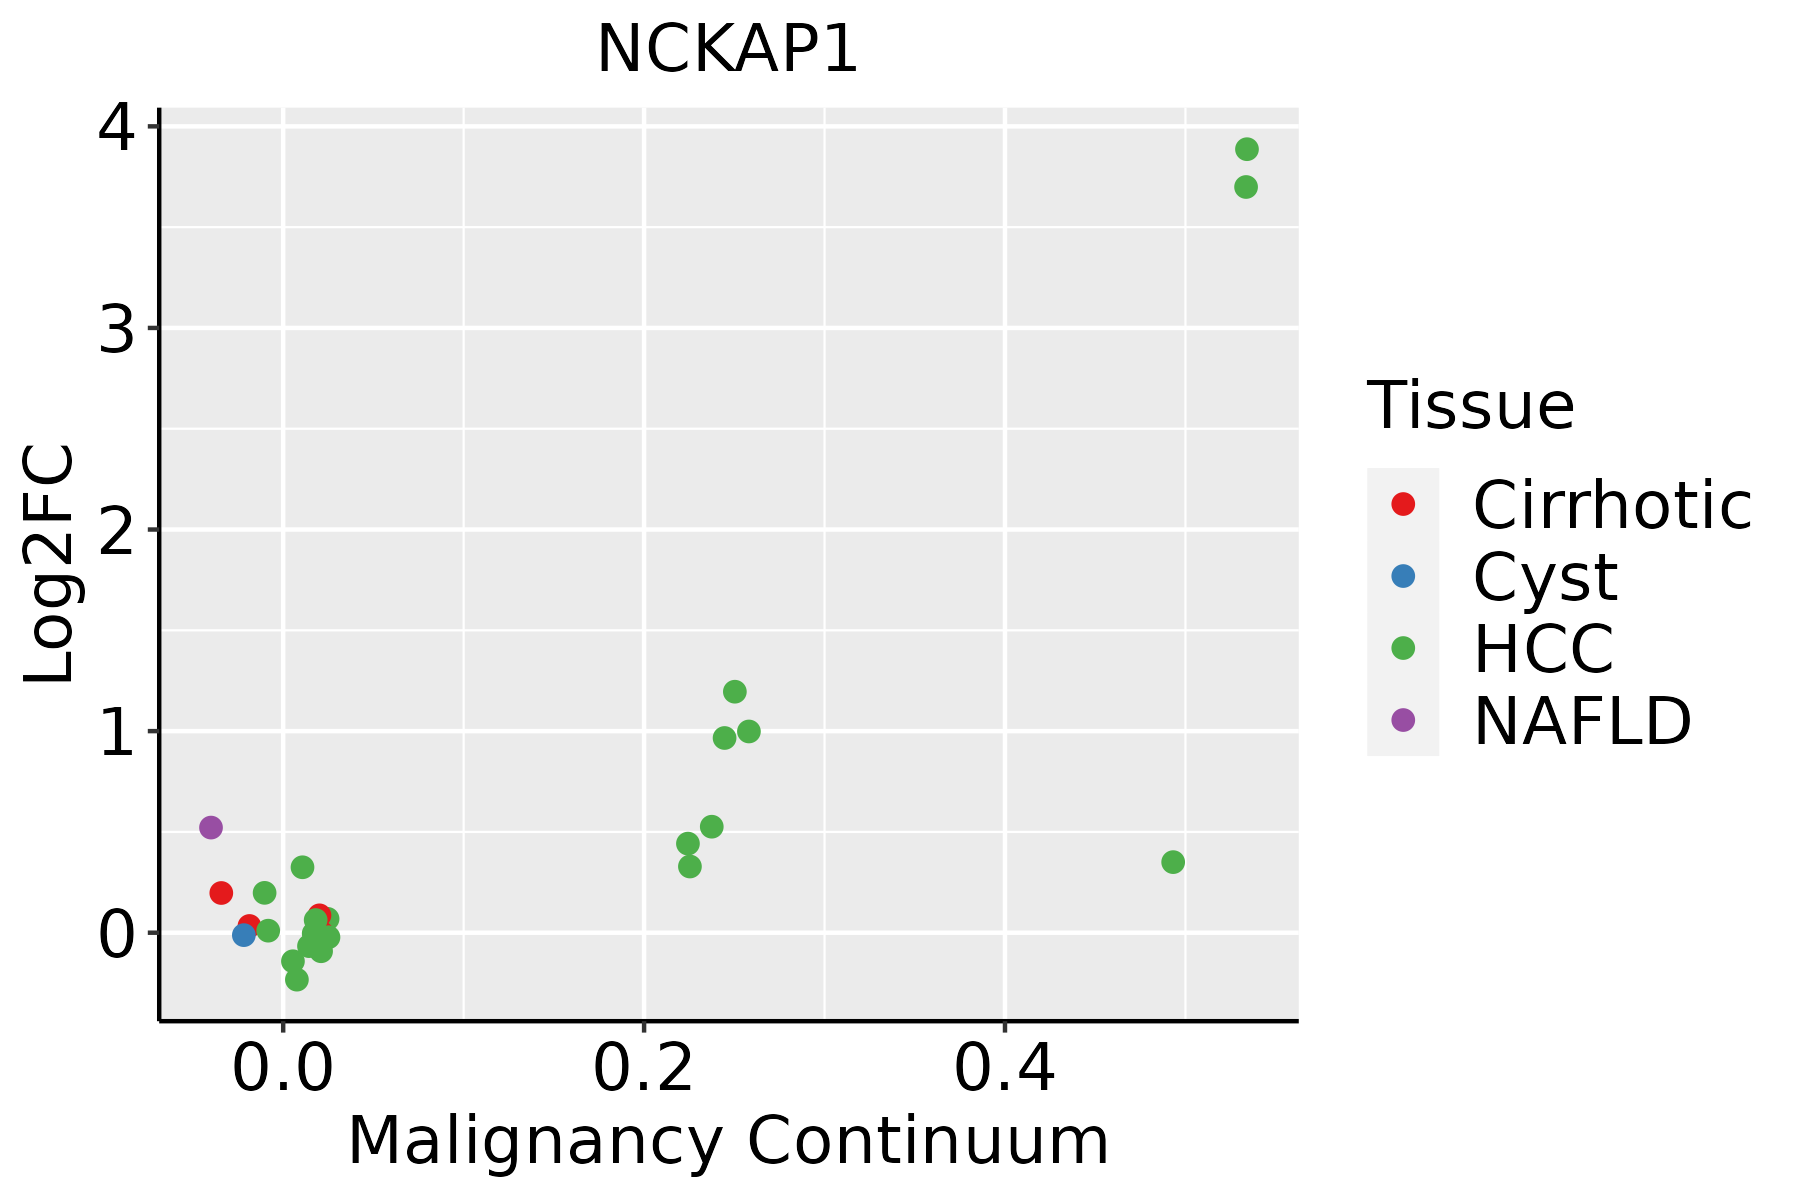 | HCC: Hepatocellular carcinoma |
| NAFLD: Non-alcoholic fatty liver disease |
| Oral Cavity | 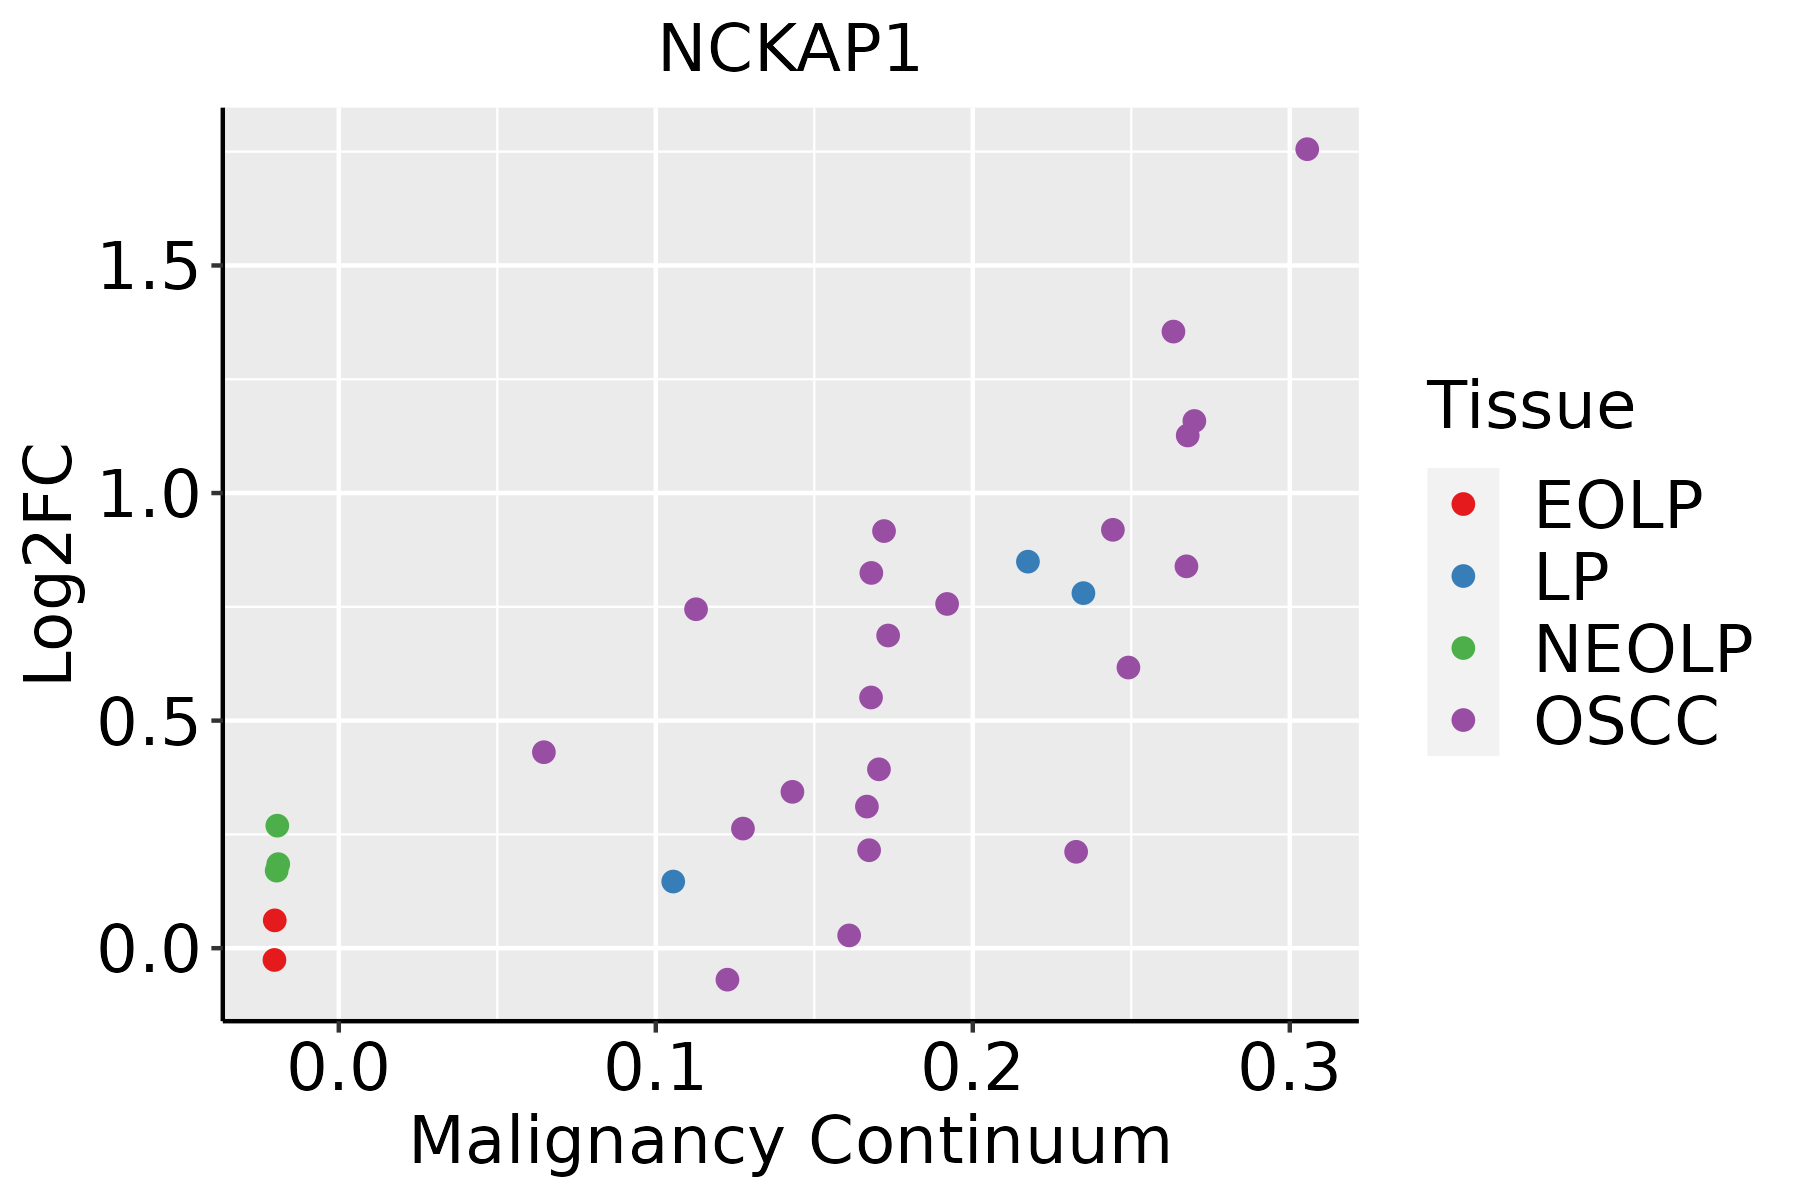 | EOLP: Erosive Oral lichen planus |
| LP: leukoplakia |
| NEOLP: Non-erosive oral lichen planus |
| OSCC: Oral squamous cell carcinoma |
| Prostate |  | BPH: Benign Prostatic Hyperplasia |
| Skin | 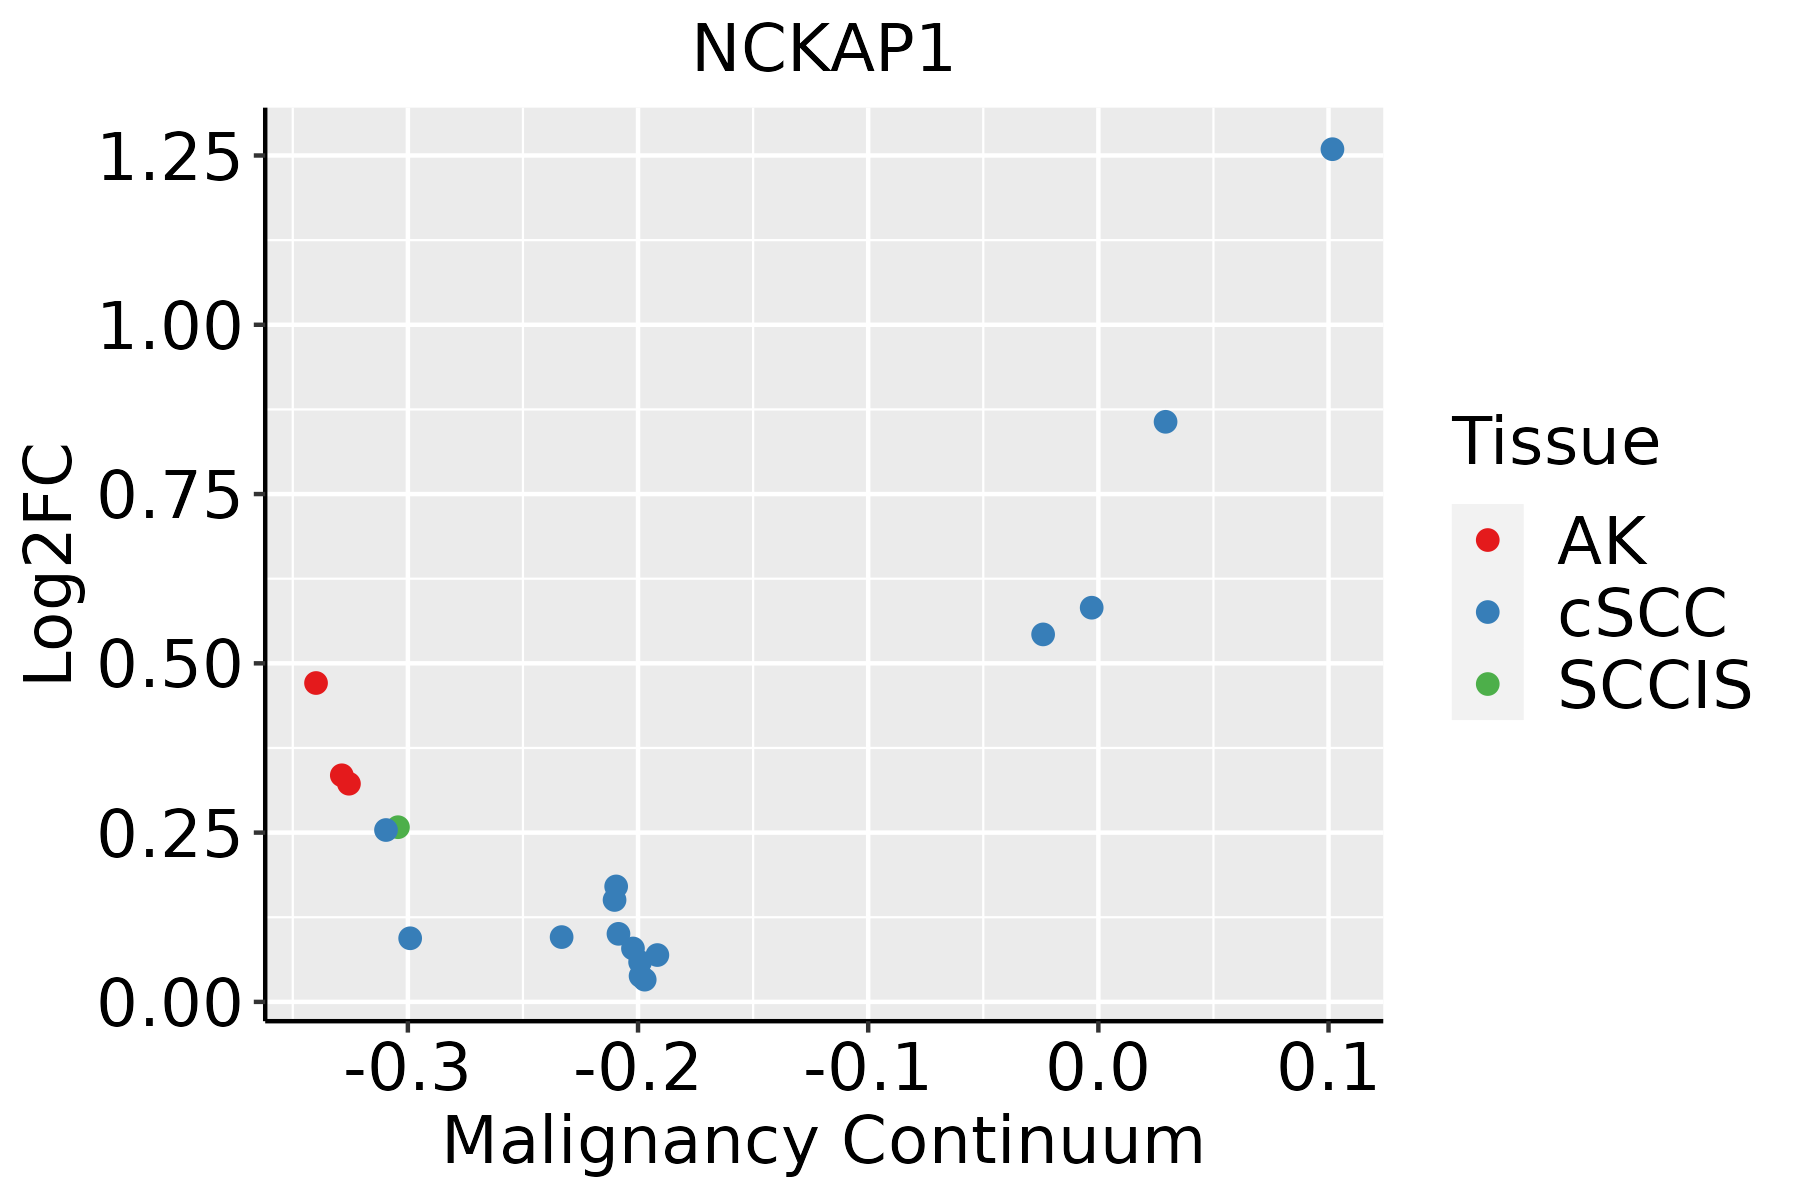 | AK: Actinic keratosis |
| cSCC: Cutaneous squamous cell carcinoma |
| SCCIS:squamous cell carcinoma in situ |
| Thyroid | 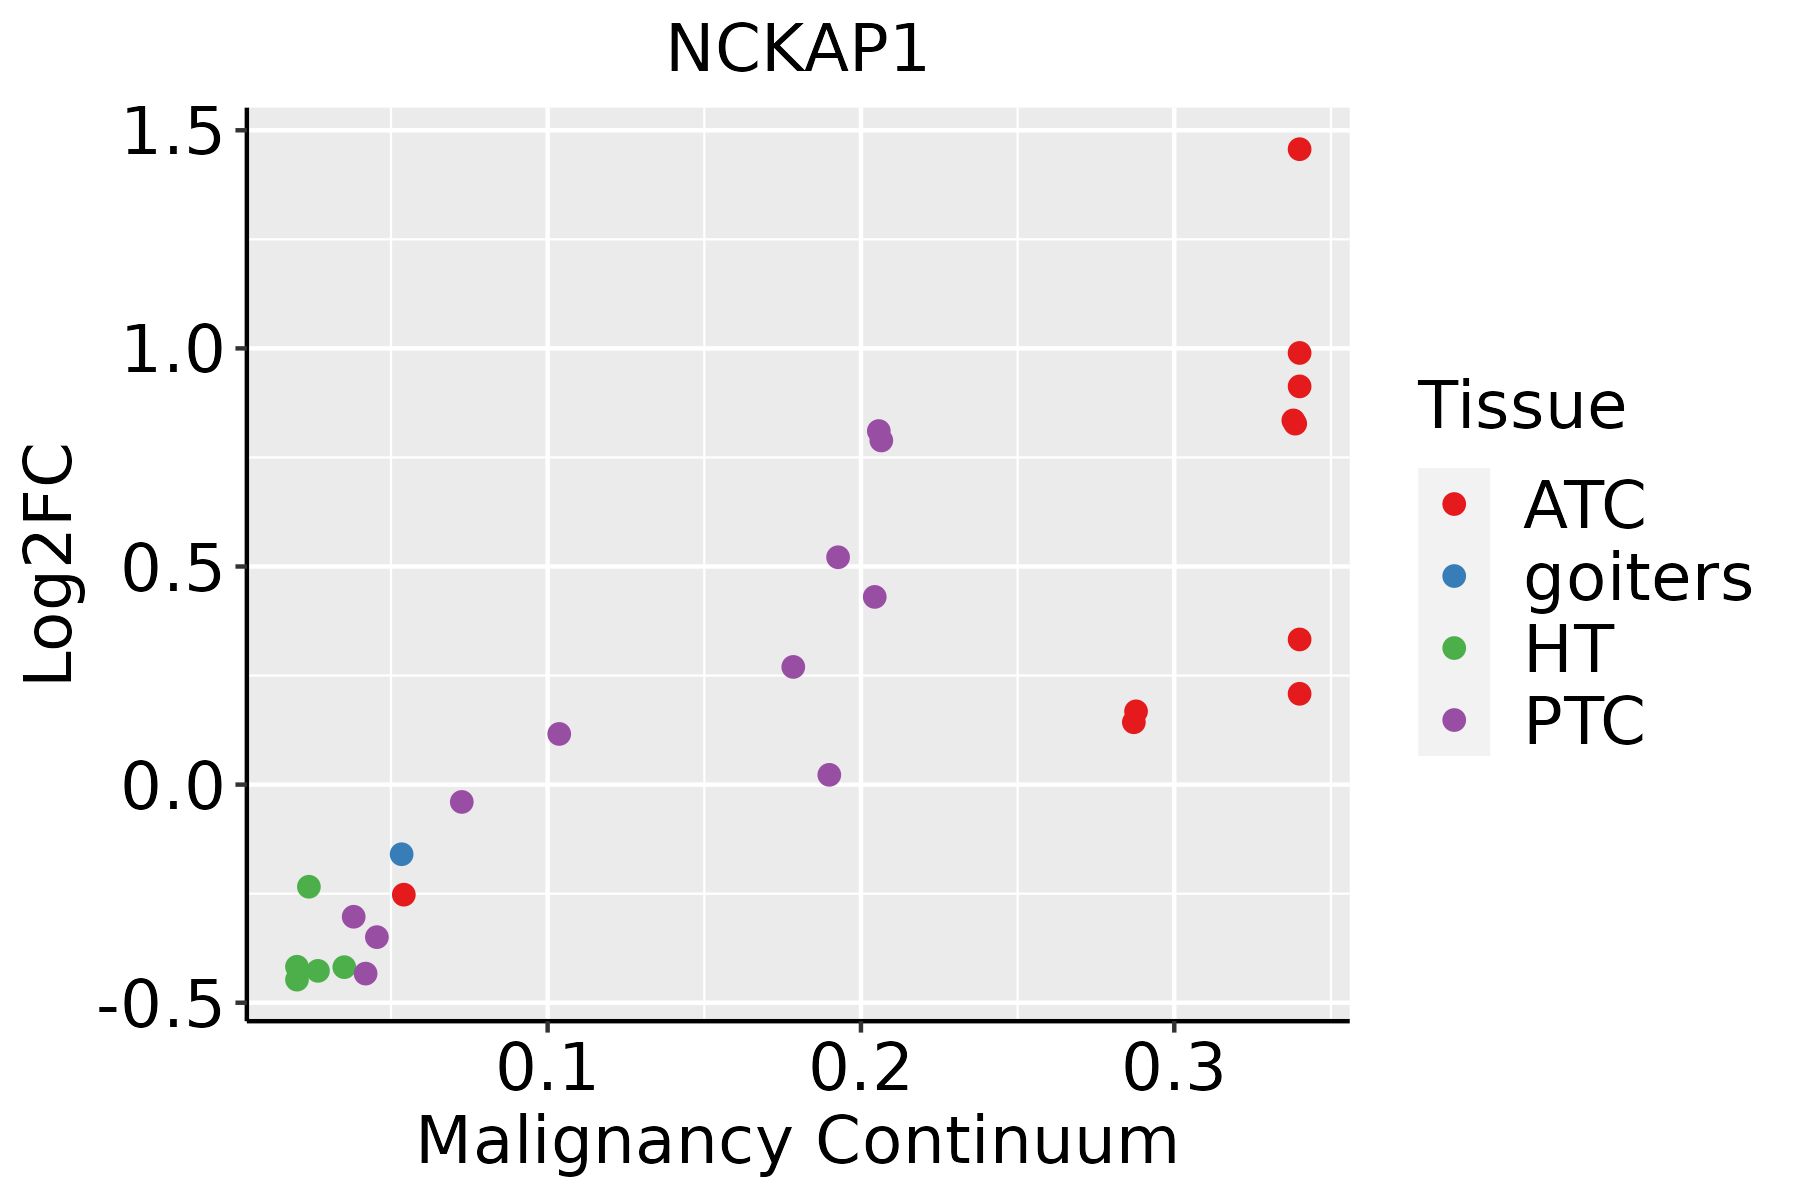 | ATC: Anaplastic thyroid cancer |
| HT: Hashimoto's thyroiditis |
| PTC: Papillary thyroid cancer |
| GO ID | Tissue | Disease Stage | Description | Gene Ratio | Bg Ratio | pvalue | p.adjust | Count |
| GO:000701510 | Cervix | CC | actin filament organization | 109/2311 | 442/18723 | 4.92e-13 | 2.45e-10 | 109 |
| GO:003297010 | Cervix | CC | regulation of actin filament-based process | 96/2311 | 397/18723 | 4.00e-11 | 8.54e-09 | 96 |
| GO:190290310 | Cervix | CC | regulation of supramolecular fiber organization | 92/2311 | 383/18723 | 1.49e-10 | 2.48e-08 | 92 |
| GO:003295610 | Cervix | CC | regulation of actin cytoskeleton organization | 86/2311 | 358/18723 | 5.90e-10 | 7.51e-08 | 86 |
| GO:004325410 | Cervix | CC | regulation of protein-containing complex assembly | 96/2311 | 428/18723 | 2.91e-09 | 3.05e-07 | 96 |
| GO:00072656 | Cervix | CC | Ras protein signal transduction | 79/2311 | 337/18723 | 9.49e-09 | 7.77e-07 | 79 |
| GO:011005310 | Cervix | CC | regulation of actin filament organization | 67/2311 | 278/18723 | 4.01e-08 | 2.54e-06 | 67 |
| GO:00975817 | Cervix | CC | lamellipodium organization | 31/2311 | 90/18723 | 4.57e-08 | 2.76e-06 | 31 |
| GO:005125810 | Cervix | CC | protein polymerization | 70/2311 | 297/18723 | 5.20e-08 | 3.11e-06 | 70 |
| GO:00300325 | Cervix | CC | lamellipodium assembly | 26/2311 | 72/18723 | 1.87e-07 | 8.48e-06 | 26 |
| GO:003227110 | Cervix | CC | regulation of protein polymerization | 57/2311 | 233/18723 | 2.37e-07 | 1.03e-05 | 57 |
| GO:003133410 | Cervix | CC | positive regulation of protein-containing complex assembly | 55/2311 | 237/18723 | 2.25e-06 | 6.73e-05 | 55 |
| GO:190290510 | Cervix | CC | positive regulation of supramolecular fiber organization | 50/2311 | 209/18723 | 2.55e-06 | 7.54e-05 | 50 |
| GO:00081549 | Cervix | CC | actin polymerization or depolymerization | 51/2311 | 218/18723 | 4.05e-06 | 1.05e-04 | 51 |
| GO:00313467 | Cervix | CC | positive regulation of cell projection organization | 72/2311 | 353/18723 | 1.04e-05 | 2.32e-04 | 72 |
| GO:00300419 | Cervix | CC | actin filament polymerization | 45/2311 | 191/18723 | 1.20e-05 | 2.54e-04 | 45 |
| GO:19027437 | Cervix | CC | regulation of lamellipodium organization | 19/2311 | 54/18723 | 1.27e-05 | 2.60e-04 | 19 |
| GO:00325359 | Cervix | CC | regulation of cellular component size | 76/2311 | 383/18723 | 1.66e-05 | 3.21e-04 | 76 |
| GO:005149510 | Cervix | CC | positive regulation of cytoskeleton organization | 50/2311 | 226/18723 | 2.53e-05 | 4.29e-04 | 50 |
| GO:00308339 | Cervix | CC | regulation of actin filament polymerization | 40/2311 | 172/18723 | 4.90e-05 | 7.40e-04 | 40 |
| Pathway ID | Tissue | Disease Stage | Description | Gene Ratio | Bg Ratio | pvalue | p.adjust | qvalue | Count |
| hsa0513020 | Cervix | CC | Pathogenic Escherichia coli infection | 63/1267 | 197/8465 | 9.28e-10 | 2.00e-08 | 1.19e-08 | 63 |
| hsa0513220 | Cervix | CC | Salmonella infection | 74/1267 | 249/8465 | 1.33e-09 | 2.54e-08 | 1.50e-08 | 74 |
| hsa0481016 | Cervix | CC | Regulation of actin cytoskeleton | 64/1267 | 229/8465 | 2.24e-07 | 2.59e-06 | 1.53e-06 | 64 |
| hsa05130110 | Cervix | CC | Pathogenic Escherichia coli infection | 63/1267 | 197/8465 | 9.28e-10 | 2.00e-08 | 1.19e-08 | 63 |
| hsa05132110 | Cervix | CC | Salmonella infection | 74/1267 | 249/8465 | 1.33e-09 | 2.54e-08 | 1.50e-08 | 74 |
| hsa0481017 | Cervix | CC | Regulation of actin cytoskeleton | 64/1267 | 229/8465 | 2.24e-07 | 2.59e-06 | 1.53e-06 | 64 |
| hsa05132 | Colorectum | AD | Salmonella infection | 102/2092 | 249/8465 | 7.65e-09 | 1.28e-07 | 8.17e-08 | 102 |
| hsa05130 | Colorectum | AD | Pathogenic Escherichia coli infection | 79/2092 | 197/8465 | 1.05e-06 | 1.36e-05 | 8.65e-06 | 79 |
| hsa04810 | Colorectum | AD | Regulation of actin cytoskeleton | 75/2092 | 229/8465 | 3.36e-03 | 1.76e-02 | 1.12e-02 | 75 |
| hsa051321 | Colorectum | AD | Salmonella infection | 102/2092 | 249/8465 | 7.65e-09 | 1.28e-07 | 8.17e-08 | 102 |
| hsa051301 | Colorectum | AD | Pathogenic Escherichia coli infection | 79/2092 | 197/8465 | 1.05e-06 | 1.36e-05 | 8.65e-06 | 79 |
| hsa048101 | Colorectum | AD | Regulation of actin cytoskeleton | 75/2092 | 229/8465 | 3.36e-03 | 1.76e-02 | 1.12e-02 | 75 |
| hsa051324 | Colorectum | MSS | Salmonella infection | 92/1875 | 249/8465 | 5.23e-08 | 9.74e-07 | 5.97e-07 | 92 |
| hsa051304 | Colorectum | MSS | Pathogenic Escherichia coli infection | 73/1875 | 197/8465 | 1.10e-06 | 1.48e-05 | 9.06e-06 | 73 |
| hsa048104 | Colorectum | MSS | Regulation of actin cytoskeleton | 68/1875 | 229/8465 | 4.27e-03 | 1.86e-02 | 1.14e-02 | 68 |
| hsa051325 | Colorectum | MSS | Salmonella infection | 92/1875 | 249/8465 | 5.23e-08 | 9.74e-07 | 5.97e-07 | 92 |
| hsa051305 | Colorectum | MSS | Pathogenic Escherichia coli infection | 73/1875 | 197/8465 | 1.10e-06 | 1.48e-05 | 9.06e-06 | 73 |
| hsa048105 | Colorectum | MSS | Regulation of actin cytoskeleton | 68/1875 | 229/8465 | 4.27e-03 | 1.86e-02 | 1.14e-02 | 68 |
| hsa051308 | Colorectum | FAP | Pathogenic Escherichia coli infection | 62/1404 | 197/8465 | 1.37e-07 | 3.08e-06 | 1.87e-06 | 62 |
| hsa048106 | Colorectum | FAP | Regulation of actin cytoskeleton | 65/1404 | 229/8465 | 4.07e-06 | 5.91e-05 | 3.59e-05 | 65 |
| Hugo Symbol | Variant Class | Variant Classification | dbSNP RS | HGVSc | HGVSp | HGVSp Short | SWISSPROT | BIOTYPE | SIFT | PolyPhen | Tumor Sample Barcode | Tissue | Histology | Sex | Age | Stage | Therapy Types | Drugs | Outcome |
| NCKAP1 | SNV | Missense_Mutation | | c.2730G>C | p.Leu910Phe | p.L910F | Q9Y2A7 | protein_coding | deleterious(0) | possibly_damaging(0.548) | TCGA-5L-AAT1-01 | Breast | breast invasive carcinoma | Female | <65 | III/IV | Hormone Therapy | letrozol | SD |
| NCKAP1 | SNV | Missense_Mutation | | c.1118N>G | p.Lys373Arg | p.K373R | Q9Y2A7 | protein_coding | deleterious(0.01) | benign(0.315) | TCGA-A2-A0ER-01 | Breast | breast invasive carcinoma | Female | <65 | I/II | Chemotherapy | cytoxan | SD |
| NCKAP1 | SNV | Missense_Mutation | | c.1186N>T | p.Asp396Tyr | p.D396Y | Q9Y2A7 | protein_coding | deleterious(0.02) | probably_damaging(0.918) | TCGA-A2-A1FW-01 | Breast | breast invasive carcinoma | Female | <65 | III/IV | Chemotherapy | cytoxan | SD |
| NCKAP1 | SNV | Missense_Mutation | novel | c.2348N>G | p.Asp783Gly | p.D783G | Q9Y2A7 | protein_coding | deleterious(0) | probably_damaging(0.981) | TCGA-AC-A5EH-01 | Breast | breast invasive carcinoma | Female | >=65 | I/II | Unknown | Unknown | SD |
| NCKAP1 | SNV | Missense_Mutation | | c.1372N>A | p.Cys458Ser | p.C458S | Q9Y2A7 | protein_coding | deleterious(0) | benign(0.348) | TCGA-AN-A03X-01 | Breast | breast invasive carcinoma | Female | >=65 | I/II | Unknown | Unknown | SD |
| NCKAP1 | SNV | Missense_Mutation | | c.3332N>A | p.Ser1111Tyr | p.S1111Y | Q9Y2A7 | protein_coding | deleterious(0) | probably_damaging(0.916) | TCGA-AN-A046-01 | Breast | breast invasive carcinoma | Female | >=65 | I/II | Unknown | Unknown | SD |
| NCKAP1 | SNV | Missense_Mutation | | c.464N>A | p.Arg155Gln | p.R155Q | Q9Y2A7 | protein_coding | deleterious(0.05) | benign(0.232) | TCGA-AN-A046-01 | Breast | breast invasive carcinoma | Female | >=65 | I/II | Unknown | Unknown | SD |
| NCKAP1 | SNV | Missense_Mutation | | c.1582C>T | p.His528Tyr | p.H528Y | Q9Y2A7 | protein_coding | deleterious(0) | possibly_damaging(0.87) | TCGA-AN-A04A-01 | Breast | breast invasive carcinoma | Female | <65 | III/IV | Unknown | Unknown | SD |
| NCKAP1 | SNV | Missense_Mutation | | c.2776N>A | p.Ala926Thr | p.A926T | Q9Y2A7 | protein_coding | tolerated(0.16) | benign(0.112) | TCGA-C8-A135-01 | Breast | breast invasive carcinoma | Female | <65 | I/II | Chemotherapy | 5-fluorouracil | CR |
| NCKAP1 | SNV | Missense_Mutation | novel | c.1937N>T | p.Ala646Val | p.A646V | Q9Y2A7 | protein_coding | tolerated(0.23) | possibly_damaging(0.793) | TCGA-D8-A27W-01 | Breast | breast invasive carcinoma | Female | <65 | III/IV | Chemotherapy | doxorubicine+cyclophosphamide | SD |


