
|
|||||
|
 | |
| |
| |
| |
| |
| |
|
Gene: NCK2 |
Gene summary for NCK2 |
| Gene information | Species | Human | Gene symbol | NCK2 | Gene ID | 8440 |
| Gene name | NCK adaptor protein 2 | |
| Gene Alias | GRB4 | |
| Cytomap | 2q12.2 | |
| Gene Type | protein-coding | GO ID | GO:0000122 | UniProtAcc | A0A0S2Z4M6 |
Top |
Malignant transformation analysis |
| Identification of the aberrant gene expression in precancerous and cancerous lesions by comparing the gene expression of stem-like cells in diseased tissues with normal stem cells |
| Entrez ID | Symbol | Replicates | Species | Organ | Tissue | Adj P-value | Log2FC | Malignancy |
| 8440 | NCK2 | CCI_1 | Human | Cervix | CC | 1.34e-04 | 6.41e-01 | 0.528 |
| 8440 | NCK2 | CCI_3 | Human | Cervix | CC | 5.98e-08 | 8.91e-01 | 0.516 |
| 8440 | NCK2 | C04 | Human | Oral cavity | OSCC | 6.53e-07 | 5.94e-01 | 0.2633 |
| 8440 | NCK2 | C21 | Human | Oral cavity | OSCC | 1.33e-05 | 4.28e-01 | 0.2678 |
| 8440 | NCK2 | C30 | Human | Oral cavity | OSCC | 1.48e-24 | 1.15e+00 | 0.3055 |
| 8440 | NCK2 | C38 | Human | Oral cavity | OSCC | 2.40e-05 | 8.24e-01 | 0.172 |
| 8440 | NCK2 | C43 | Human | Oral cavity | OSCC | 9.54e-10 | 2.48e-01 | 0.1704 |
| 8440 | NCK2 | C46 | Human | Oral cavity | OSCC | 1.93e-09 | 3.27e-01 | 0.1673 |
| 8440 | NCK2 | C51 | Human | Oral cavity | OSCC | 9.64e-07 | 6.24e-01 | 0.2674 |
| 8440 | NCK2 | C57 | Human | Oral cavity | OSCC | 1.41e-05 | 3.71e-01 | 0.1679 |
| 8440 | NCK2 | C08 | Human | Oral cavity | OSCC | 8.04e-11 | 2.14e-01 | 0.1919 |
| 8440 | NCK2 | LN38 | Human | Oral cavity | OSCC | 2.21e-02 | 7.23e-01 | 0.168 |
| 8440 | NCK2 | EOLP-1 | Human | Oral cavity | EOLP | 1.55e-02 | 1.59e-01 | -0.0202 |
| 8440 | NCK2 | NEOLP-3 | Human | Oral cavity | NEOLP | 6.99e-04 | 2.25e-01 | -0.0191 |
| 8440 | NCK2 | SYSMH1 | Human | Oral cavity | OSCC | 1.71e-12 | 3.15e-01 | 0.1127 |
| 8440 | NCK2 | SYSMH2 | Human | Oral cavity | OSCC | 2.11e-14 | 3.97e-01 | 0.2326 |
| 8440 | NCK2 | SYSMH3 | Human | Oral cavity | OSCC | 4.80e-17 | 4.65e-01 | 0.2442 |
| 8440 | NCK2 | SYSMH5 | Human | Oral cavity | OSCC | 1.58e-04 | 1.17e-01 | 0.0647 |
| 8440 | NCK2 | SYSMH6 | Human | Oral cavity | OSCC | 2.39e-07 | 2.47e-01 | 0.1275 |
| 8440 | NCK2 | P1_S1_AK | Human | Skin | AK | 8.08e-08 | 3.48e-01 | -0.3399 |
| Page: 1 2 |
| Tissue | Expression Dynamics | Abbreviation |
| Cervix | 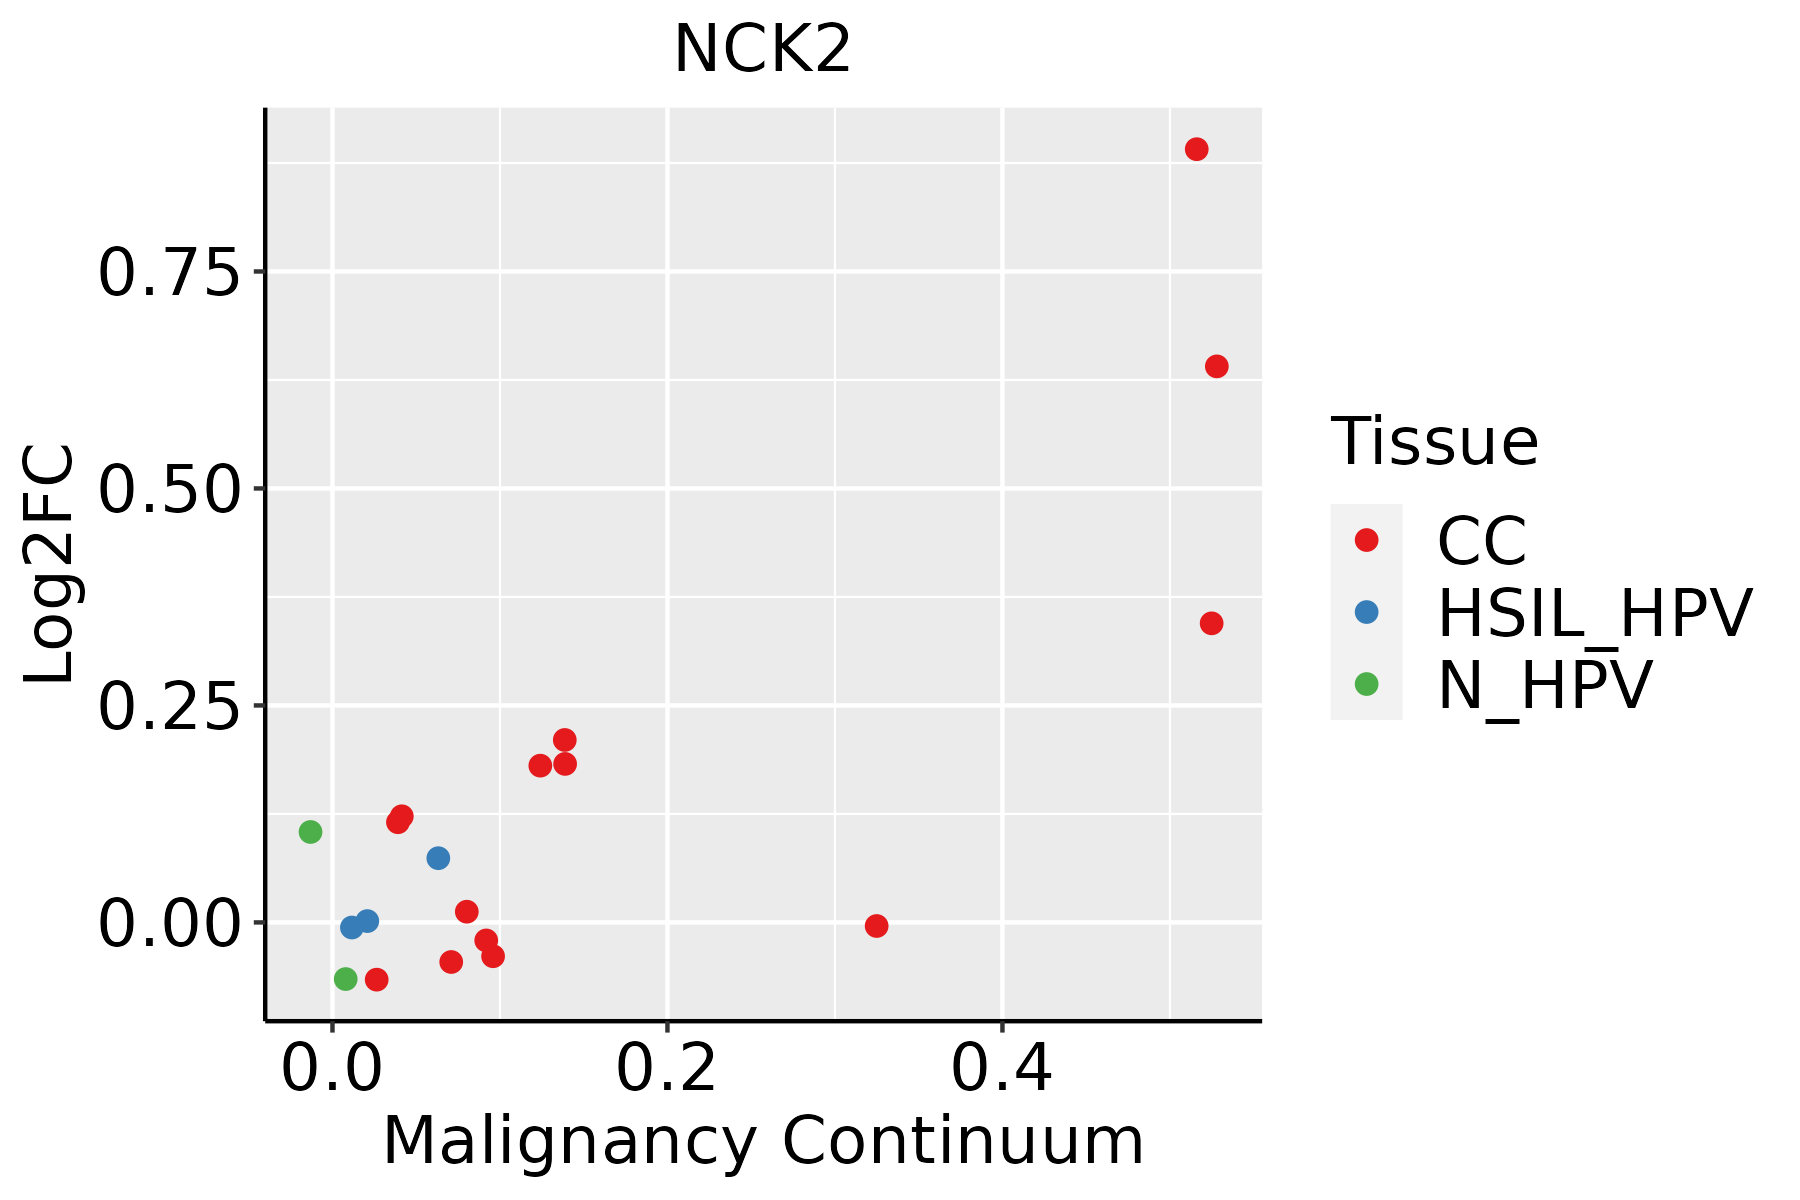 | CC: Cervix cancer |
| HSIL_HPV: HPV-infected high-grade squamous intraepithelial lesions | ||
| N_HPV: HPV-infected normal cervix | ||
| Oral Cavity | 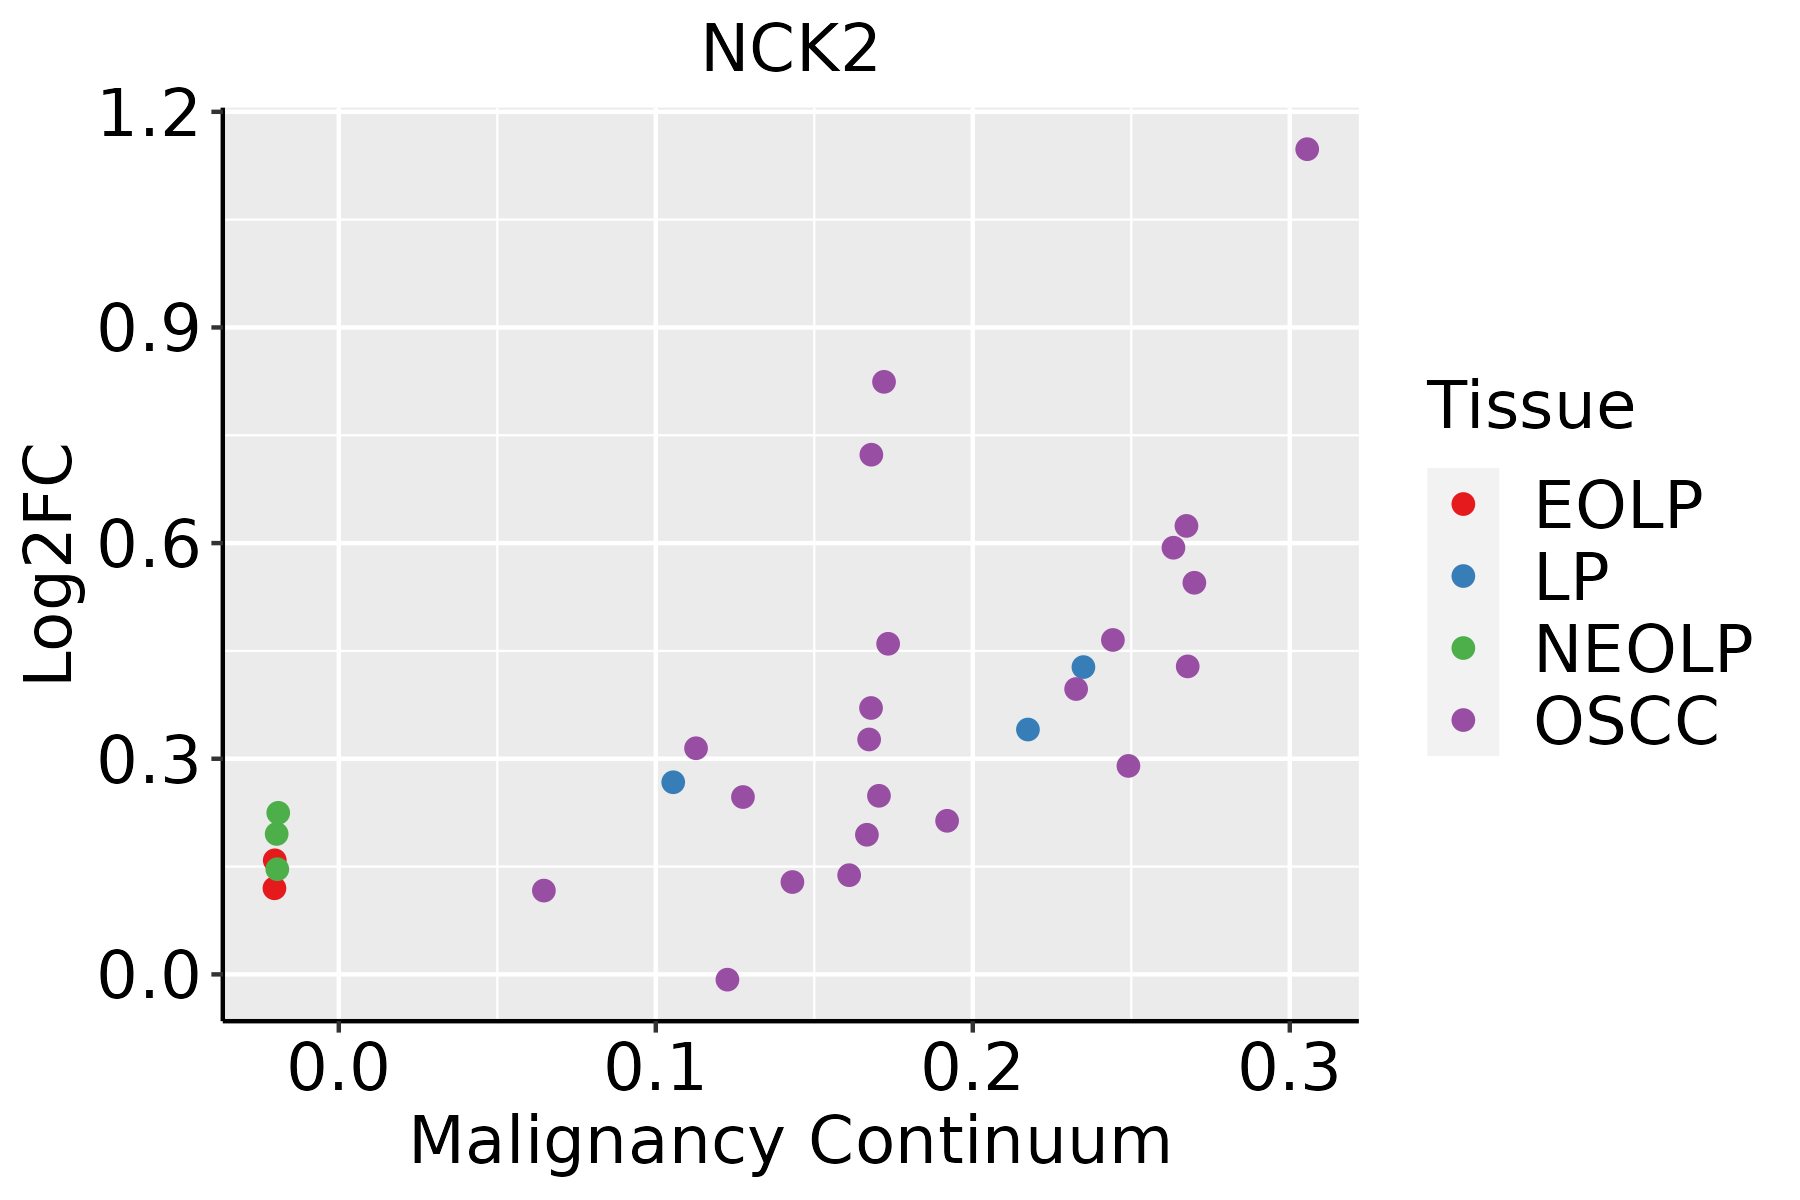 | EOLP: Erosive Oral lichen planus |
| LP: leukoplakia | ||
| NEOLP: Non-erosive oral lichen planus | ||
| OSCC: Oral squamous cell carcinoma | ||
| Skin |  | AK: Actinic keratosis |
| cSCC: Cutaneous squamous cell carcinoma | ||
| SCCIS:squamous cell carcinoma in situ | ||
| Thyroid | 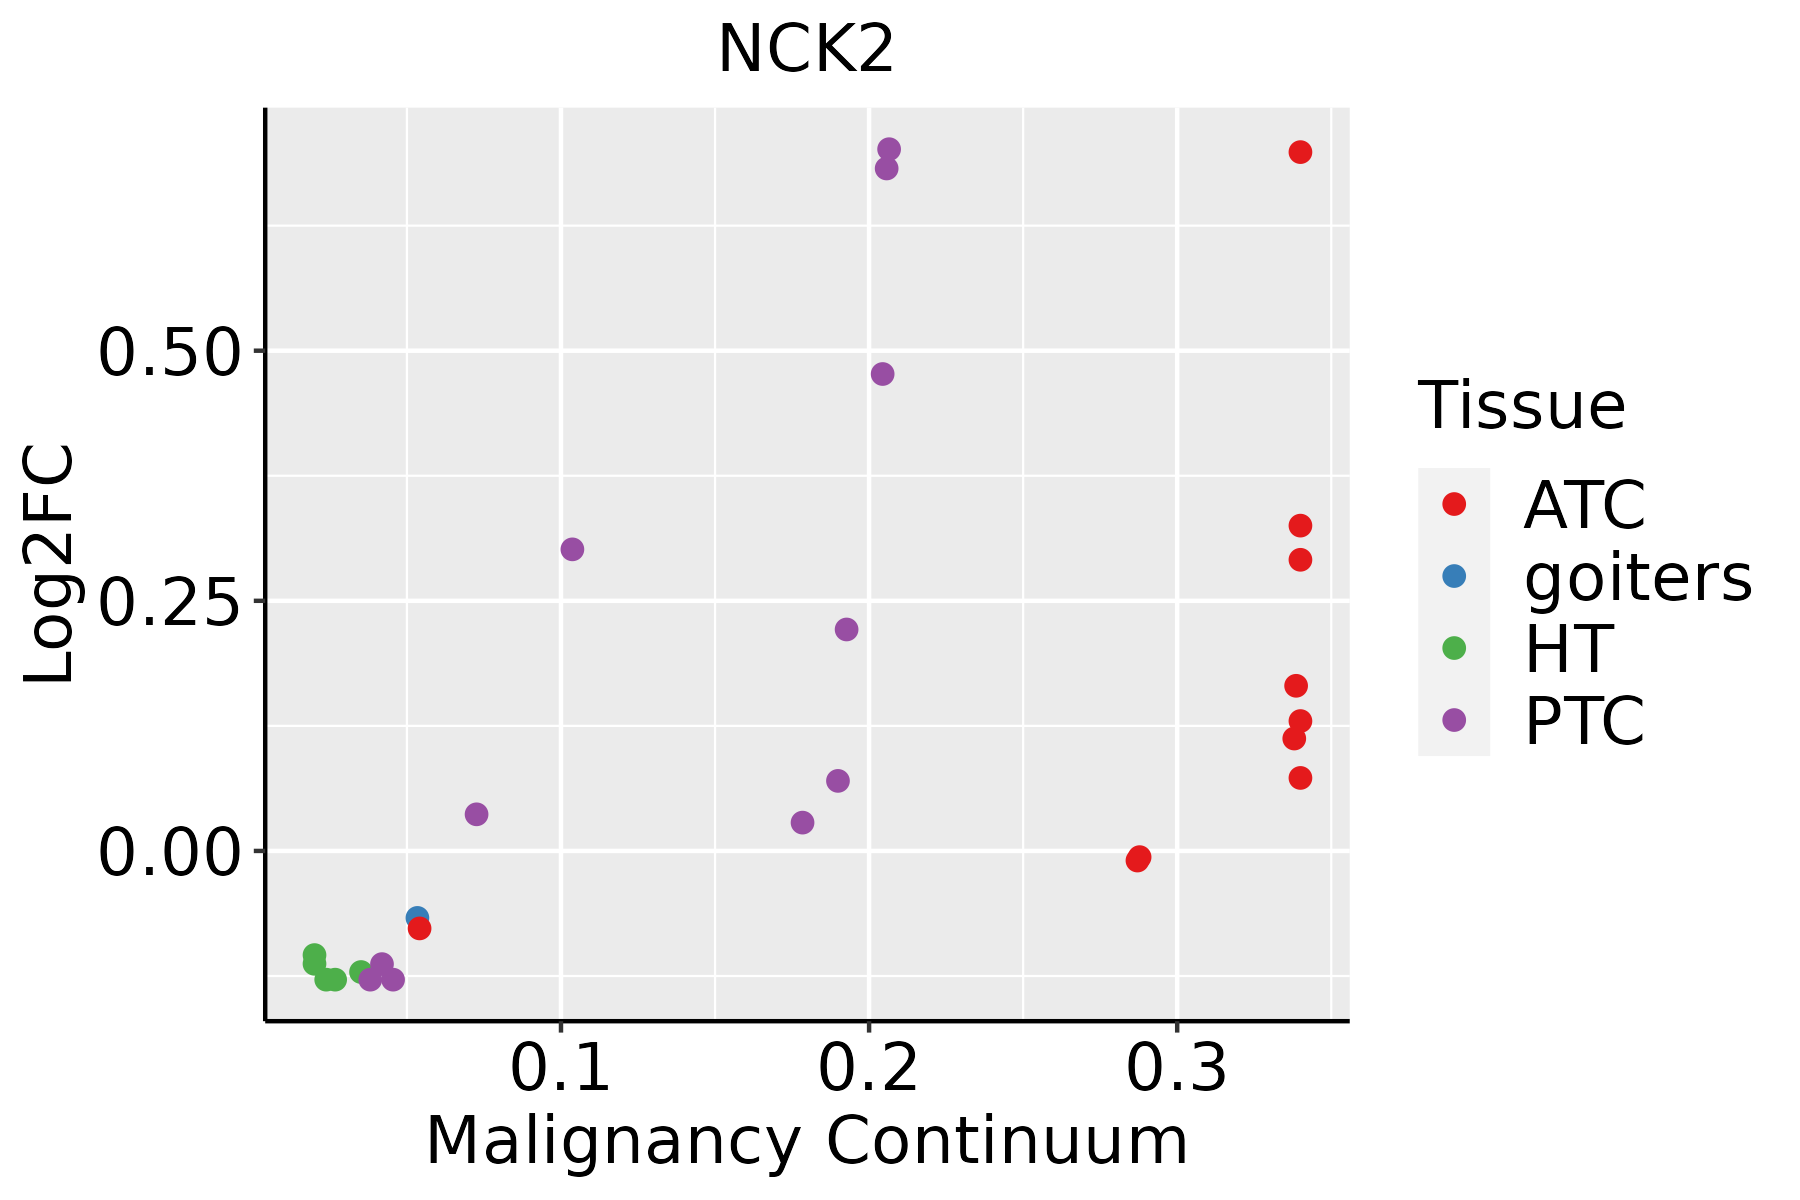 | ATC: Anaplastic thyroid cancer |
| HT: Hashimoto's thyroiditis | ||
| PTC: Papillary thyroid cancer |
| ∗log2FC in expression of this searched gene in stem-like cells from each diseased tissue sample relative to stem-like cells in normal samples in each tissue plotted against the malignancy continuum. Samples are colored based on if they are from different disease stage. |
Top |
Malignant transformation related pathway analysis |
| Find out the enriched GO biological processes and KEGG pathways involved in transition from healthy to precancer to cancer |
| Tissue | Disease Stage | Enriched GO biological Processes |
| Colorectum | AD |  |
| Colorectum | SER |  |
| Colorectum | MSS |  |
| Colorectum | MSI-H |  |
| Colorectum | FAP |  |
| ∗Top 15 enriched GO BP terms are showed in the bar plot of each disease state in each tissue. Each row represents a significant GO biological process which is colored according to the -log10(p.adjust). |
| Page: 1 2 3 4 5 6 7 8 9 |
| GO ID | Tissue | Disease Stage | Description | Gene Ratio | Bg Ratio | pvalue | p.adjust | Count |
| GO:009719310 | Cervix | CC | intrinsic apoptotic signaling pathway | 85/2311 | 288/18723 | 4.56e-15 | 6.46e-12 | 85 |
| GO:200123310 | Cervix | CC | regulation of apoptotic signaling pathway | 96/2311 | 356/18723 | 4.08e-14 | 3.05e-11 | 96 |
| GO:000701510 | Cervix | CC | actin filament organization | 109/2311 | 442/18723 | 4.92e-13 | 2.45e-10 | 109 |
| GO:003297010 | Cervix | CC | regulation of actin filament-based process | 96/2311 | 397/18723 | 4.00e-11 | 8.54e-09 | 96 |
| GO:200124210 | Cervix | CC | regulation of intrinsic apoptotic signaling pathway | 52/2311 | 164/18723 | 5.06e-11 | 1.01e-08 | 52 |
| GO:190290310 | Cervix | CC | regulation of supramolecular fiber organization | 92/2311 | 383/18723 | 1.49e-10 | 2.48e-08 | 92 |
| GO:002240710 | Cervix | CC | regulation of cell-cell adhesion | 103/2311 | 448/18723 | 1.78e-10 | 2.87e-08 | 103 |
| GO:004578510 | Cervix | CC | positive regulation of cell adhesion | 101/2311 | 437/18723 | 1.96e-10 | 3.08e-08 | 101 |
| GO:003295610 | Cervix | CC | regulation of actin cytoskeleton organization | 86/2311 | 358/18723 | 5.90e-10 | 7.51e-08 | 86 |
| GO:00421108 | Cervix | CC | T cell activation | 107/2311 | 487/18723 | 1.24e-09 | 1.46e-07 | 107 |
| GO:00508638 | Cervix | CC | regulation of T cell activation | 80/2311 | 329/18723 | 1.28e-09 | 1.47e-07 | 80 |
| GO:004325410 | Cervix | CC | regulation of protein-containing complex assembly | 96/2311 | 428/18723 | 2.91e-09 | 3.05e-07 | 96 |
| GO:00071598 | Cervix | CC | leukocyte cell-cell adhesion | 85/2311 | 371/18723 | 8.27e-09 | 7.07e-07 | 85 |
| GO:00071738 | Cervix | CC | epidermal growth factor receptor signaling pathway | 36/2311 | 108/18723 | 1.04e-08 | 8.44e-07 | 36 |
| GO:004361810 | Cervix | CC | regulation of transcription from RNA polymerase II promoter in response to stress | 21/2311 | 47/18723 | 3.85e-08 | 2.53e-06 | 21 |
| GO:011005310 | Cervix | CC | regulation of actin filament organization | 67/2311 | 278/18723 | 4.01e-08 | 2.54e-06 | 67 |
| GO:19030378 | Cervix | CC | regulation of leukocyte cell-cell adhesion | 77/2311 | 336/18723 | 4.08e-08 | 2.54e-06 | 77 |
| GO:00975817 | Cervix | CC | lamellipodium organization | 31/2311 | 90/18723 | 4.57e-08 | 2.76e-06 | 31 |
| GO:005125810 | Cervix | CC | protein polymerization | 70/2311 | 297/18723 | 5.20e-08 | 3.11e-06 | 70 |
| GO:00381278 | Cervix | CC | ERBB signaling pathway | 37/2311 | 121/18723 | 8.57e-08 | 4.88e-06 | 37 |
| Page: 1 2 3 4 5 6 7 8 9 10 11 12 13 14 15 16 17 18 19 20 21 22 23 24 25 26 27 28 29 30 31 32 |
| Pathway ID | Tissue | Disease Stage | Description | Gene Ratio | Bg Ratio | pvalue | p.adjust | qvalue | Count |
| hsa0513020 | Cervix | CC | Pathogenic Escherichia coli infection | 63/1267 | 197/8465 | 9.28e-10 | 2.00e-08 | 1.19e-08 | 63 |
| hsa0401210 | Cervix | CC | ErbB signaling pathway | 28/1267 | 85/8465 | 2.40e-05 | 1.82e-04 | 1.08e-04 | 28 |
| hsa043609 | Cervix | CC | Axon guidance | 47/1267 | 182/8465 | 8.13e-05 | 5.38e-04 | 3.18e-04 | 47 |
| hsa046604 | Cervix | CC | T cell receptor signaling pathway | 25/1267 | 104/8465 | 9.52e-03 | 2.94e-02 | 1.74e-02 | 25 |
| hsa05130110 | Cervix | CC | Pathogenic Escherichia coli infection | 63/1267 | 197/8465 | 9.28e-10 | 2.00e-08 | 1.19e-08 | 63 |
| hsa0401213 | Cervix | CC | ErbB signaling pathway | 28/1267 | 85/8465 | 2.40e-05 | 1.82e-04 | 1.08e-04 | 28 |
| hsa0436012 | Cervix | CC | Axon guidance | 47/1267 | 182/8465 | 8.13e-05 | 5.38e-04 | 3.18e-04 | 47 |
| hsa0466011 | Cervix | CC | T cell receptor signaling pathway | 25/1267 | 104/8465 | 9.52e-03 | 2.94e-02 | 1.74e-02 | 25 |
| hsa0513030 | Oral cavity | OSCC | Pathogenic Escherichia coli infection | 129/3704 | 197/8465 | 4.32e-10 | 5.17e-09 | 2.63e-09 | 129 |
| hsa046606 | Oral cavity | OSCC | T cell receptor signaling pathway | 67/3704 | 104/8465 | 1.57e-05 | 6.75e-05 | 3.44e-05 | 67 |
| hsa0401216 | Oral cavity | OSCC | ErbB signaling pathway | 55/3704 | 85/8465 | 7.46e-05 | 2.81e-04 | 1.43e-04 | 55 |
| hsa0436014 | Oral cavity | OSCC | Axon guidance | 97/3704 | 182/8465 | 5.59e-03 | 1.33e-02 | 6.76e-03 | 97 |
| hsa05130114 | Oral cavity | OSCC | Pathogenic Escherichia coli infection | 129/3704 | 197/8465 | 4.32e-10 | 5.17e-09 | 2.63e-09 | 129 |
| hsa0466012 | Oral cavity | OSCC | T cell receptor signaling pathway | 67/3704 | 104/8465 | 1.57e-05 | 6.75e-05 | 3.44e-05 | 67 |
| hsa0401217 | Oral cavity | OSCC | ErbB signaling pathway | 55/3704 | 85/8465 | 7.46e-05 | 2.81e-04 | 1.43e-04 | 55 |
| hsa0436015 | Oral cavity | OSCC | Axon guidance | 97/3704 | 182/8465 | 5.59e-03 | 1.33e-02 | 6.76e-03 | 97 |
| hsa0513045 | Oral cavity | EOLP | Pathogenic Escherichia coli infection | 54/1218 | 197/8465 | 1.10e-06 | 9.96e-06 | 5.87e-06 | 54 |
| hsa0466021 | Oral cavity | EOLP | T cell receptor signaling pathway | 34/1218 | 104/8465 | 1.63e-06 | 1.39e-05 | 8.18e-06 | 34 |
| hsa0401223 | Oral cavity | EOLP | ErbB signaling pathway | 27/1218 | 85/8465 | 3.39e-05 | 1.69e-04 | 9.94e-05 | 27 |
| hsa0436023 | Oral cavity | EOLP | Axon guidance | 38/1218 | 182/8465 | 1.02e-02 | 2.80e-02 | 1.65e-02 | 38 |
| Page: 1 2 |
Top |
Cell-cell communication analysis |
| Identification of potential cell-cell interactions between two cell types and their ligand-receptor pairs for different disease states |
| Ligand | Receptor | LRpair | Pathway | Tissue | Disease Stage |
| Page: 1 |
Top |
Single-cell gene regulatory network inference analysis |
| Find out the significant the regulons (TFs) and the target genes of each regulon across cell types for different disease states |
| TF | Cell Type | Tissue | Disease Stage | Target Gene | RSS | Regulon Activity |
| ∗The dot plots of a searched regulon are shown for all cell subpopulations in each disease state of each tissue based on the regulon specific score inferred using pySCENIC and by calculating the average expression. |
| Page: 1 |
Top |
Somatic mutation of malignant transformation related genes |
| Annotation of somatic variants for genes involved in malignant transformation |
| Hugo Symbol | Variant Class | Variant Classification | dbSNP RS | HGVSc | HGVSp | HGVSp Short | SWISSPROT | BIOTYPE | SIFT | PolyPhen | Tumor Sample Barcode | Tissue | Histology | Sex | Age | Stage | Therapy Types | Drugs | Outcome |
| NCK2 | SNV | Missense_Mutation | novel | c.122N>G | p.Val41Gly | p.V41G | O43639 | protein_coding | deleterious(0) | probably_damaging(1) | TCGA-A2-A1G6-01 | Breast | breast invasive carcinoma | Female | <65 | III/IV | Chemotherapy | adriamycin | SD |
| NCK2 | SNV | Missense_Mutation | novel | c.568N>G | p.Asn190Asp | p.N190D | O43639 | protein_coding | tolerated(0.25) | benign(0.062) | TCGA-A7-A6VY-01 | Breast | breast invasive carcinoma | Female | <65 | I/II | Chemotherapy | cyclophosphamide | CR |
| NCK2 | SNV | Missense_Mutation | novel | c.547C>T | p.Arg183Cys | p.R183C | O43639 | protein_coding | deleterious(0.04) | possibly_damaging(0.513) | TCGA-2W-A8YY-01 | Cervix | cervical & endocervical cancer | Female | <65 | I/II | Chemotherapy | cisplatin | CR |
| NCK2 | SNV | Missense_Mutation | novel | c.60N>T | p.Glu20Asp | p.E20D | O43639 | protein_coding | deleterious(0) | probably_damaging(1) | TCGA-FU-A40J-01 | Cervix | cervical & endocervical cancer | Female | <65 | III/IV | Chemotherapy | carboplatin | CR |
| NCK2 | SNV | Missense_Mutation | rs370241867 | c.872N>T | p.Thr291Met | p.T291M | O43639 | protein_coding | deleterious(0) | probably_damaging(0.996) | TCGA-VS-A94Z-01 | Cervix | cervical & endocervical cancer | Female | <65 | I/II | Chemotherapy | cisplatin | CR |
| NCK2 | SNV | Missense_Mutation | rs754330998 | c.548N>A | p.Arg183His | p.R183H | O43639 | protein_coding | tolerated(0.33) | benign(0.255) | TCGA-VS-A9UJ-01 | Cervix | cervical & endocervical cancer | Female | <65 | I/II | Unknown | Unknown | PD |
| NCK2 | SNV | Missense_Mutation | c.1028N>A | p.Cys343Tyr | p.C343Y | O43639 | protein_coding | tolerated(0.06) | possibly_damaging(0.9) | TCGA-AA-3811-01 | Colorectum | colon adenocarcinoma | Female | >=65 | III/IV | Unknown | Unknown | PD | |
| NCK2 | SNV | Missense_Mutation | rs766993432 | c.592C>T | p.His198Tyr | p.H198Y | O43639 | protein_coding | deleterious(0.02) | benign(0.209) | TCGA-AA-3815-01 | Colorectum | colon adenocarcinoma | Female | >=65 | I/II | Unknown | Unknown | SD |
| NCK2 | SNV | Missense_Mutation | novel | c.826T>C | p.Ser276Pro | p.S276P | O43639 | protein_coding | tolerated(0.28) | benign(0) | TCGA-AA-3947-01 | Colorectum | colon adenocarcinoma | Female | <65 | I/II | Unknown | Unknown | SD |
| NCK2 | SNV | Missense_Mutation | rs780151498 | c.836G>A | p.Arg279His | p.R279H | O43639 | protein_coding | tolerated(0.28) | benign(0.003) | TCGA-AD-6895-01 | Colorectum | colon adenocarcinoma | Male | >=65 | III/IV | Unknown | Unknown | SD |
| Page: 1 2 3 4 5 6 7 |
Top |
Related drugs of malignant transformation related genes |
| Identification of chemicals and drugs interact with genes involved in malignant transfromation |
| (DGIdb 4.0) |
| Entrez ID | Symbol | Category | Interaction Types | Drug Claim Name | Drug Name | PMIDs |
| Page: 1 |

Copyright 2023-Present -The University of Texas Health Science Center at Houston |