
|
|||||
|
 | |
| |
| |
| |
| |
| |
|
Gene: NCF2 |
Gene summary for NCF2 |
| Gene information | Species | Human | Gene symbol | NCF2 | Gene ID | 4688 |
| Gene name | neutrophil cytosolic factor 2 | |
| Gene Alias | NCF-2 | |
| Cytomap | 1q25.3 | |
| Gene Type | protein-coding | GO ID | GO:0002376 | UniProtAcc | A0A0S2Z457 |
Top |
Malignant transformation analysis |
| Identification of the aberrant gene expression in precancerous and cancerous lesions by comparing the gene expression of stem-like cells in diseased tissues with normal stem cells |
| Entrez ID | Symbol | Replicates | Species | Organ | Tissue | Adj P-value | Log2FC | Malignancy |
| 4688 | NCF2 | LZE5T | Human | Esophagus | ESCC | 3.54e-05 | 3.24e-01 | 0.0514 |
| 4688 | NCF2 | LZE22T | Human | Esophagus | ESCC | 3.65e-02 | 2.40e-01 | 0.068 |
| 4688 | NCF2 | LZE24T | Human | Esophagus | ESCC | 5.55e-04 | 2.74e-01 | 0.0596 |
| 4688 | NCF2 | P8T-E | Human | Esophagus | ESCC | 4.88e-12 | 3.61e-01 | 0.0889 |
| 4688 | NCF2 | P10T-E | Human | Esophagus | ESCC | 1.88e-04 | 1.33e-01 | 0.116 |
| 4688 | NCF2 | P11T-E | Human | Esophagus | ESCC | 2.19e-04 | 2.40e-01 | 0.1426 |
| 4688 | NCF2 | P19T-E | Human | Esophagus | ESCC | 4.28e-05 | 7.10e-01 | 0.1662 |
| 4688 | NCF2 | P28T-E | Human | Esophagus | ESCC | 6.96e-16 | 3.26e-01 | 0.1149 |
| 4688 | NCF2 | P37T-E | Human | Esophagus | ESCC | 1.72e-03 | 1.33e-01 | 0.1371 |
| 4688 | NCF2 | P61T-E | Human | Esophagus | ESCC | 1.82e-08 | 3.70e-01 | 0.099 |
| 4688 | NCF2 | P75T-E | Human | Esophagus | ESCC | 2.82e-13 | 4.27e-01 | 0.1125 |
| 4688 | NCF2 | P107T-E | Human | Esophagus | ESCC | 3.97e-41 | 1.35e+00 | 0.171 |
| 4688 | NCF2 | P130T-E | Human | Esophagus | ESCC | 5.14e-61 | 1.51e+00 | 0.1676 |
| 4688 | NCF2 | S027 | Human | Liver | HCC | 1.09e-12 | 9.22e-01 | 0.2446 |
| 4688 | NCF2 | S028 | Human | Liver | HCC | 5.38e-24 | 7.72e-01 | 0.2503 |
| 4688 | NCF2 | S029 | Human | Liver | HCC | 4.99e-26 | 1.21e+00 | 0.2581 |
| Page: 1 |
| Tissue | Expression Dynamics | Abbreviation |
| Esophagus | 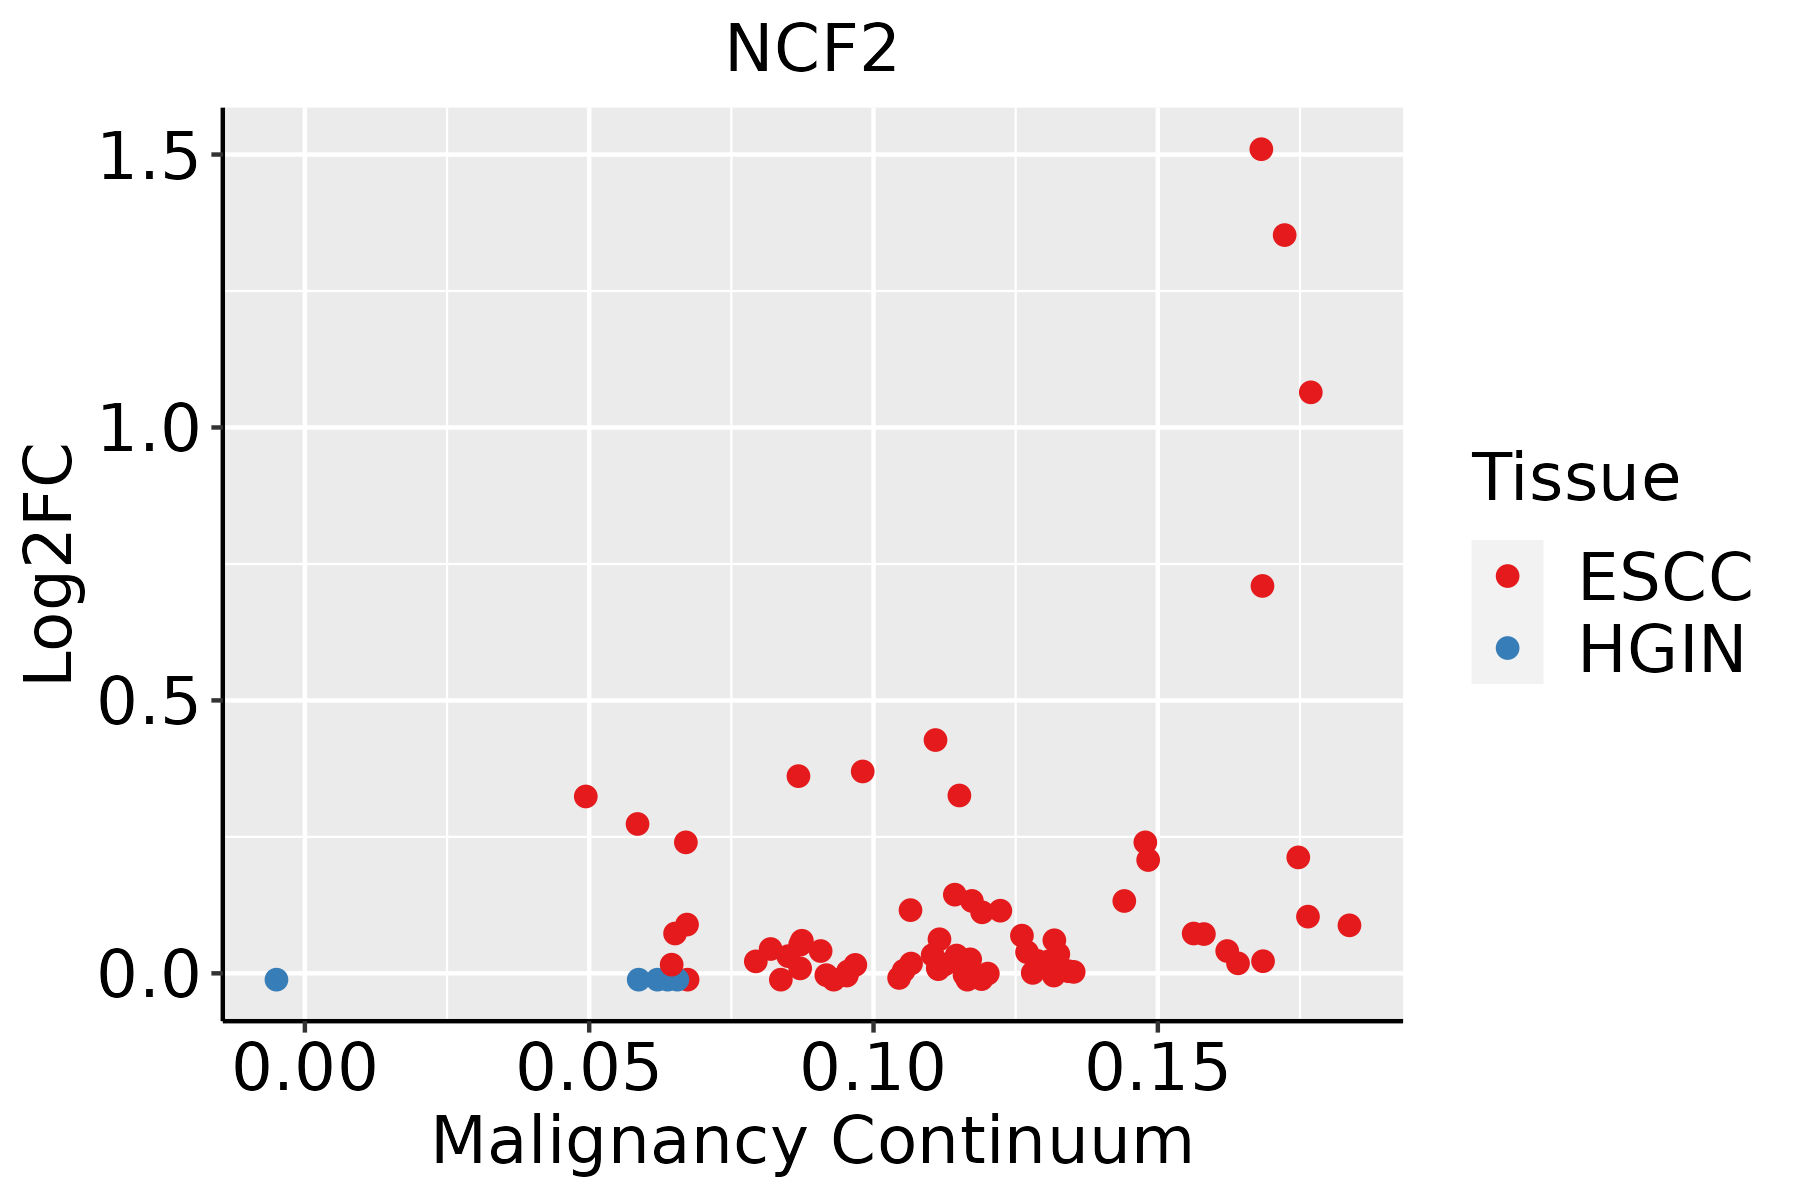 | ESCC: Esophageal squamous cell carcinoma |
| HGIN: High-grade intraepithelial neoplasias | ||
| LGIN: Low-grade intraepithelial neoplasias | ||
| Liver |  | HCC: Hepatocellular carcinoma |
| NAFLD: Non-alcoholic fatty liver disease |
| ∗log2FC in expression of this searched gene in stem-like cells from each diseased tissue sample relative to stem-like cells in normal samples in each tissue plotted against the malignancy continuum. Samples are colored based on if they are from different disease stage. |
Top |
Malignant transformation related pathway analysis |
| Find out the enriched GO biological processes and KEGG pathways involved in transition from healthy to precancer to cancer |
| Tissue | Disease Stage | Enriched GO biological Processes |
| Colorectum | AD |  |
| Colorectum | SER |  |
| Colorectum | MSS |  |
| Colorectum | MSI-H |  |
| Colorectum | FAP |  |
| ∗Top 15 enriched GO BP terms are showed in the bar plot of each disease state in each tissue. Each row represents a significant GO biological process which is colored according to the -log10(p.adjust). |
| Page: 1 2 3 4 5 6 7 8 9 |
| GO ID | Tissue | Disease Stage | Description | Gene Ratio | Bg Ratio | pvalue | p.adjust | Count |
| GO:0006091110 | Esophagus | ESCC | generation of precursor metabolites and energy | 331/8552 | 490/18723 | 3.86e-23 | 8.45e-21 | 331 |
| GO:0022900110 | Esophagus | ESCC | electron transport chain | 133/8552 | 175/18723 | 2.18e-16 | 1.67e-14 | 133 |
| GO:007259318 | Esophagus | ESCC | reactive oxygen species metabolic process | 137/8552 | 239/18723 | 1.82e-04 | 1.16e-03 | 137 |
| GO:000609122 | Liver | HCC | generation of precursor metabolites and energy | 340/7958 | 490/18723 | 4.04e-34 | 2.85e-31 | 340 |
| GO:002290022 | Liver | HCC | electron transport chain | 134/7958 | 175/18723 | 3.32e-20 | 4.68e-18 | 134 |
| GO:007259312 | Liver | HCC | reactive oxygen species metabolic process | 124/7958 | 239/18723 | 2.05e-03 | 1.04e-02 | 124 |
| Page: 1 |
| Pathway ID | Tissue | Disease Stage | Description | Gene Ratio | Bg Ratio | pvalue | p.adjust | qvalue | Count |
| hsa05208211 | Esophagus | ESCC | Chemical carcinogenesis - reactive oxygen species | 168/4205 | 223/8465 | 1.83e-15 | 6.81e-14 | 3.49e-14 | 168 |
| hsa05020210 | Esophagus | ESCC | Prion disease | 193/4205 | 273/8465 | 6.42e-13 | 1.34e-11 | 6.89e-12 | 193 |
| hsa05418211 | Esophagus | ESCC | Fluid shear stress and atherosclerosis | 109/4205 | 139/8465 | 2.00e-12 | 3.72e-11 | 1.90e-11 | 109 |
| hsa05415211 | Esophagus | ESCC | Diabetic cardiomyopathy | 146/4205 | 203/8465 | 5.81e-11 | 7.78e-10 | 3.99e-10 | 146 |
| hsa05417211 | Esophagus | ESCC | Lipid and atherosclerosis | 143/4205 | 215/8465 | 3.30e-07 | 2.45e-06 | 1.26e-06 | 143 |
| hsa0414530 | Esophagus | ESCC | Phagosome | 100/4205 | 152/8465 | 3.81e-05 | 1.72e-04 | 8.82e-05 | 100 |
| hsa05208310 | Esophagus | ESCC | Chemical carcinogenesis - reactive oxygen species | 168/4205 | 223/8465 | 1.83e-15 | 6.81e-14 | 3.49e-14 | 168 |
| hsa0502038 | Esophagus | ESCC | Prion disease | 193/4205 | 273/8465 | 6.42e-13 | 1.34e-11 | 6.89e-12 | 193 |
| hsa05418310 | Esophagus | ESCC | Fluid shear stress and atherosclerosis | 109/4205 | 139/8465 | 2.00e-12 | 3.72e-11 | 1.90e-11 | 109 |
| hsa0541538 | Esophagus | ESCC | Diabetic cardiomyopathy | 146/4205 | 203/8465 | 5.81e-11 | 7.78e-10 | 3.99e-10 | 146 |
| hsa05417310 | Esophagus | ESCC | Lipid and atherosclerosis | 143/4205 | 215/8465 | 3.30e-07 | 2.45e-06 | 1.26e-06 | 143 |
| hsa04145114 | Esophagus | ESCC | Phagosome | 100/4205 | 152/8465 | 3.81e-05 | 1.72e-04 | 8.82e-05 | 100 |
| Page: 1 |
Top |
Cell-cell communication analysis |
| Identification of potential cell-cell interactions between two cell types and their ligand-receptor pairs for different disease states |
| Ligand | Receptor | LRpair | Pathway | Tissue | Disease Stage |
| Page: 1 |
Top |
Single-cell gene regulatory network inference analysis |
| Find out the significant the regulons (TFs) and the target genes of each regulon across cell types for different disease states |
| TF | Cell Type | Tissue | Disease Stage | Target Gene | RSS | Regulon Activity |
| ∗The dot plots of a searched regulon are shown for all cell subpopulations in each disease state of each tissue based on the regulon specific score inferred using pySCENIC and by calculating the average expression. |
| Page: 1 |
Top |
Somatic mutation of malignant transformation related genes |
| Annotation of somatic variants for genes involved in malignant transformation |
| Hugo Symbol | Variant Class | Variant Classification | dbSNP RS | HGVSc | HGVSp | HGVSp Short | SWISSPROT | BIOTYPE | SIFT | PolyPhen | Tumor Sample Barcode | Tissue | Histology | Sex | Age | Stage | Therapy Types | Drugs | Outcome |
| NCF2 | SNV | Missense_Mutation | c.517G>A | p.Glu173Lys | p.E173K | P19878 | protein_coding | tolerated(0.33) | benign(0.011) | TCGA-A2-A0SY-01 | Breast | breast invasive carcinoma | Female | <65 | III/IV | Hormone Therapy | arimidex | SD | |
| NCF2 | SNV | Missense_Mutation | rs755689355 | c.1018N>A | p.Glu340Lys | p.E340K | P19878 | protein_coding | tolerated(0.22) | benign(0) | TCGA-A8-A07R-01 | Breast | breast invasive carcinoma | Female | >=65 | III/IV | Ancillary | zoledronic | SD |
| NCF2 | SNV | Missense_Mutation | c.823G>C | p.Asp275His | p.D275H | P19878 | protein_coding | deleterious(0) | probably_damaging(1) | TCGA-AC-A23H-01 | Breast | breast invasive carcinoma | Female | >=65 | I/II | Unknown | Unknown | PD | |
| NCF2 | SNV | Missense_Mutation | c.223N>G | p.Phe75Val | p.F75V | P19878 | protein_coding | deleterious(0) | probably_damaging(0.999) | TCGA-AN-A0AL-01 | Breast | breast invasive carcinoma | Female | <65 | III/IV | Unknown | Unknown | SD | |
| NCF2 | SNV | Missense_Mutation | novel | c.916C>A | p.Gln306Lys | p.Q306K | P19878 | protein_coding | tolerated(0.32) | benign(0.003) | TCGA-EW-A3U0-01 | Breast | breast invasive carcinoma | Female | <65 | III/IV | Chemotherapy | cisplatin | CR |
| NCF2 | insertion | In_Frame_Ins | novel | c.194_195insTTCTCT | p.Asn65_Arg66insSerLeu | p.N65_R66insSL | P19878 | protein_coding | TCGA-A8-A06P-01 | Breast | breast invasive carcinoma | Female | <65 | III/IV | Unspecific | SD | |||
| NCF2 | SNV | Missense_Mutation | c.790G>A | p.Gly264Arg | p.G264R | P19878 | protein_coding | deleterious(0) | possibly_damaging(0.838) | TCGA-FU-A5XV-01 | Cervix | cervical & endocervical cancer | Female | <65 | III/IV | Unknown | Unknown | SD | |
| NCF2 | SNV | Missense_Mutation | c.556N>T | p.Asn186Tyr | p.N186Y | P19878 | protein_coding | deleterious(0) | possibly_damaging(0.856) | TCGA-JW-A5VG-01 | Cervix | cervical & endocervical cancer | Female | <65 | I/II | Chemotherapy | cisplatin | SD | |
| NCF2 | SNV | Missense_Mutation | rs778521448 | c.946G>A | p.Asp316Asn | p.D316N | P19878 | protein_coding | tolerated(0.24) | benign(0.059) | TCGA-A6-2686-01 | Colorectum | colon adenocarcinoma | Female | >=65 | I/II | Unknown | Unknown | SD |
| NCF2 | SNV | Missense_Mutation | novel | c.844N>C | p.Phe282Leu | p.F282L | P19878 | protein_coding | deleterious(0) | probably_damaging(1) | TCGA-CA-6717-01 | Colorectum | colon adenocarcinoma | Male | <65 | I/II | Chemotherapy | oxaliplatin | CR |
| Page: 1 2 3 4 5 6 |
Top |
Related drugs of malignant transformation related genes |
| Identification of chemicals and drugs interact with genes involved in malignant transfromation |
| (DGIdb 4.0) |
| Entrez ID | Symbol | Category | Interaction Types | Drug Claim Name | Drug Name | PMIDs |
| 4688 | NCF2 | NA | PMA | 9794433 |
| Page: 1 |

Copyright 2023-Present -The University of Texas Health Science Center at Houston |