
|
|||||
|
 | |
| |
| |
| |
| |
| |
|
Gene: NCEH1 |
Gene summary for NCEH1 |
| Gene information | Species | Human | Gene symbol | NCEH1 | Gene ID | 57552 |
| Gene name | neutral cholesterol ester hydrolase 1 | |
| Gene Alias | AADACL1 | |
| Cytomap | 3q26.31 | |
| Gene Type | protein-coding | GO ID | GO:0006464 | UniProtAcc | A0A0A0MTJ9 |
Top |
Malignant transformation analysis |
| Identification of the aberrant gene expression in precancerous and cancerous lesions by comparing the gene expression of stem-like cells in diseased tissues with normal stem cells |
| Entrez ID | Symbol | Replicates | Species | Organ | Tissue | Adj P-value | Log2FC | Malignancy |
| 57552 | NCEH1 | CA_HPV_2 | Human | Cervix | CC | 1.53e-05 | 3.09e-01 | 0.0391 |
| 57552 | NCEH1 | CCI_2 | Human | Cervix | CC | 3.25e-20 | 1.65e+00 | 0.5249 |
| 57552 | NCEH1 | CCI_3 | Human | Cervix | CC | 2.16e-08 | 7.34e-01 | 0.516 |
| 57552 | NCEH1 | T1 | Human | Cervix | CC | 7.27e-03 | 2.60e-01 | 0.0918 |
| 57552 | NCEH1 | HTA11_347_2000001011 | Human | Colorectum | AD | 1.73e-05 | 4.86e-01 | -0.1954 |
| 57552 | NCEH1 | A015-C-203 | Human | Colorectum | FAP | 1.55e-12 | -1.17e-01 | -0.1294 |
| 57552 | NCEH1 | A001-C-108 | Human | Colorectum | FAP | 6.81e-05 | 2.16e-01 | -0.0272 |
| 57552 | NCEH1 | A002-C-205 | Human | Colorectum | FAP | 1.21e-05 | -5.22e-02 | -0.1236 |
| 57552 | NCEH1 | A015-C-006 | Human | Colorectum | FAP | 2.41e-04 | 9.14e-03 | -0.0994 |
| 57552 | NCEH1 | A015-C-106 | Human | Colorectum | FAP | 6.53e-03 | 7.67e-02 | -0.0511 |
| 57552 | NCEH1 | A002-C-114 | Human | Colorectum | FAP | 1.04e-03 | -1.48e-01 | -0.1561 |
| 57552 | NCEH1 | A015-C-104 | Human | Colorectum | FAP | 1.45e-09 | -6.74e-02 | -0.1899 |
| 57552 | NCEH1 | A002-C-016 | Human | Colorectum | FAP | 7.69e-06 | -6.69e-02 | 0.0521 |
| 57552 | NCEH1 | A001-C-203 | Human | Colorectum | FAP | 3.76e-02 | 7.56e-02 | -0.0481 |
| 57552 | NCEH1 | A002-C-116 | Human | Colorectum | FAP | 1.30e-11 | -1.24e-01 | -0.0452 |
| 57552 | NCEH1 | A014-C-008 | Human | Colorectum | FAP | 1.75e-02 | -1.52e-01 | -0.191 |
| 57552 | NCEH1 | A018-E-020 | Human | Colorectum | FAP | 1.47e-05 | -4.07e-02 | -0.2034 |
| 57552 | NCEH1 | F034 | Human | Colorectum | FAP | 8.73e-09 | 4.48e-02 | -0.0665 |
| 57552 | NCEH1 | CRC-1-8810 | Human | Colorectum | CRC | 3.48e-02 | -2.55e-01 | 0.6257 |
| 57552 | NCEH1 | CRC-3-11773 | Human | Colorectum | CRC | 7.26e-14 | 5.72e-01 | 0.2564 |
| Page: 1 2 3 4 5 6 7 |
| Tissue | Expression Dynamics | Abbreviation |
| Cervix | 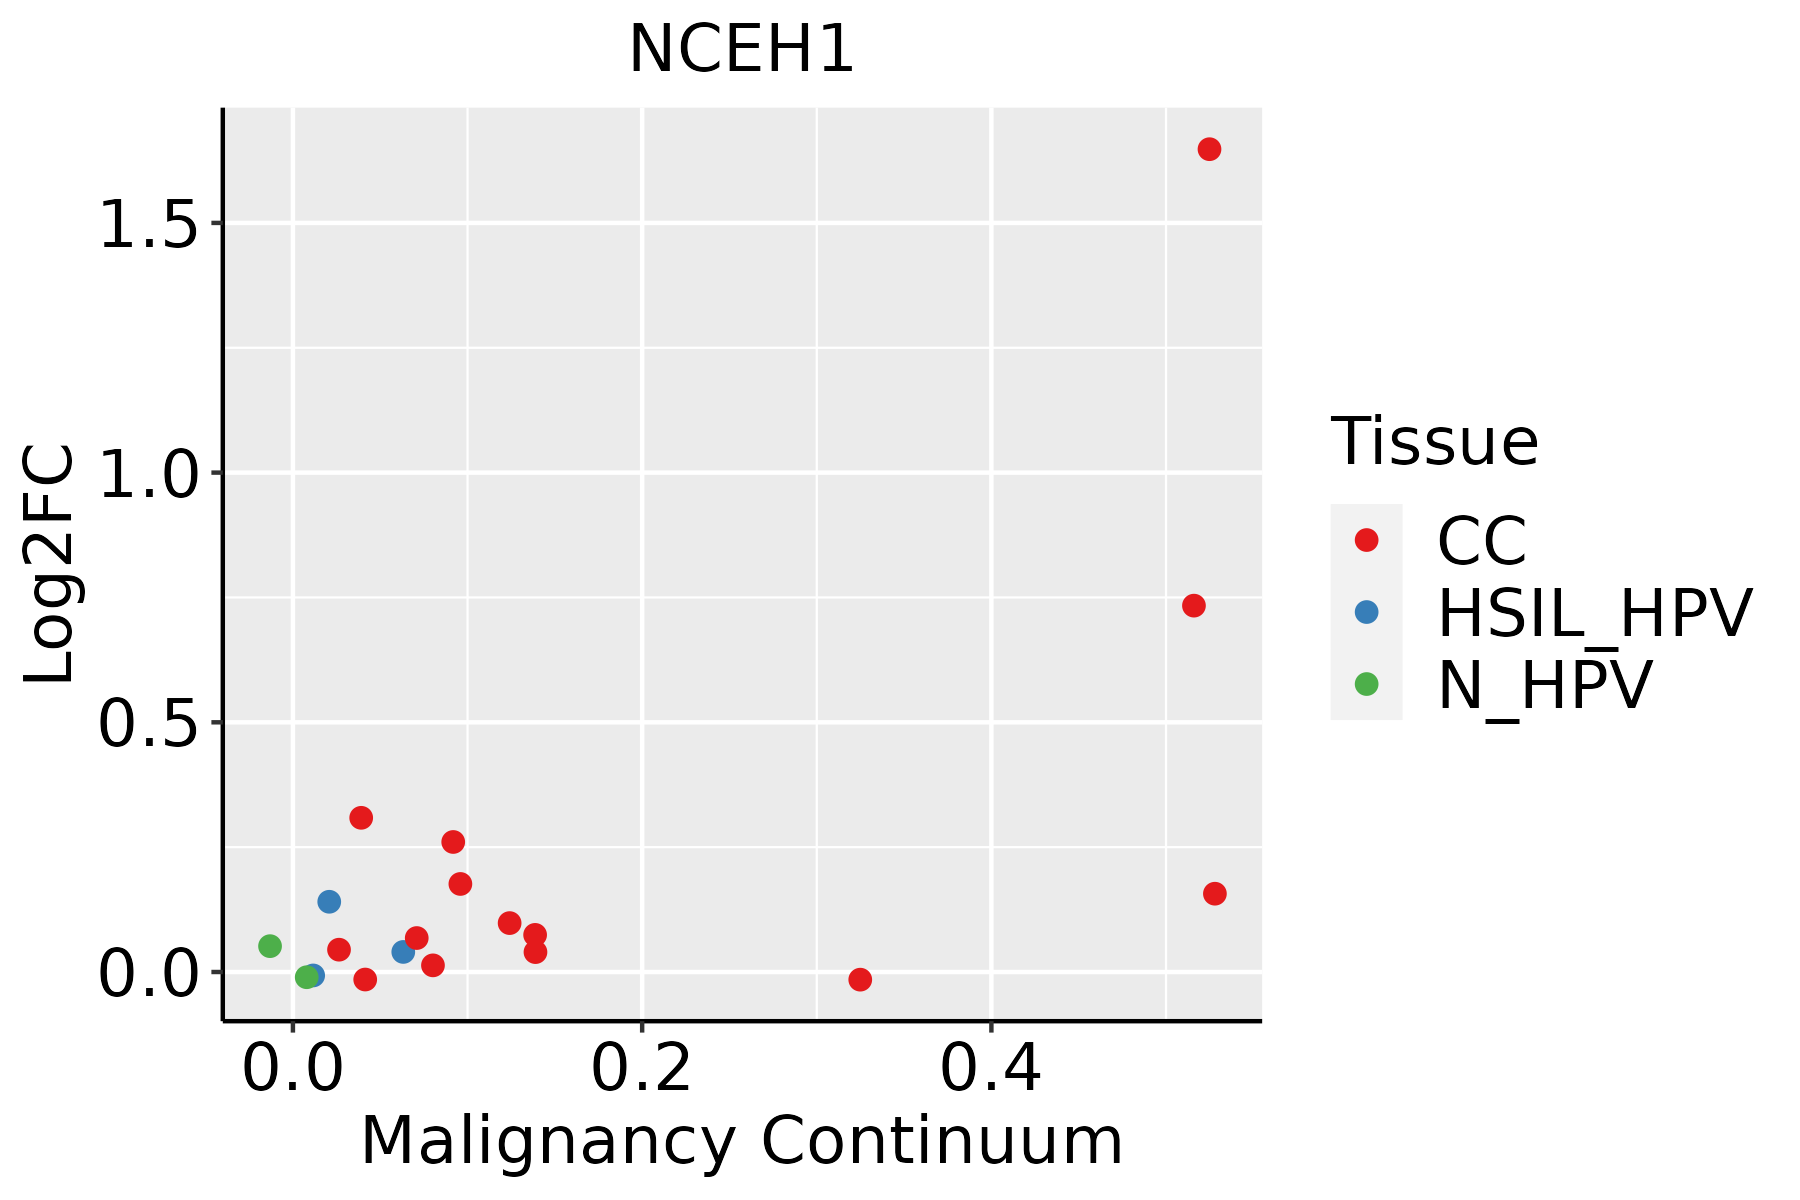 | CC: Cervix cancer |
| HSIL_HPV: HPV-infected high-grade squamous intraepithelial lesions | ||
| N_HPV: HPV-infected normal cervix | ||
| Colorectum (GSE201348) |  | FAP: Familial adenomatous polyposis |
| CRC: Colorectal cancer | ||
| Colorectum (HTA11) |  | AD: Adenomas |
| SER: Sessile serrated lesions | ||
| MSI-H: Microsatellite-high colorectal cancer | ||
| MSS: Microsatellite stable colorectal cancer | ||
| Endometrium | 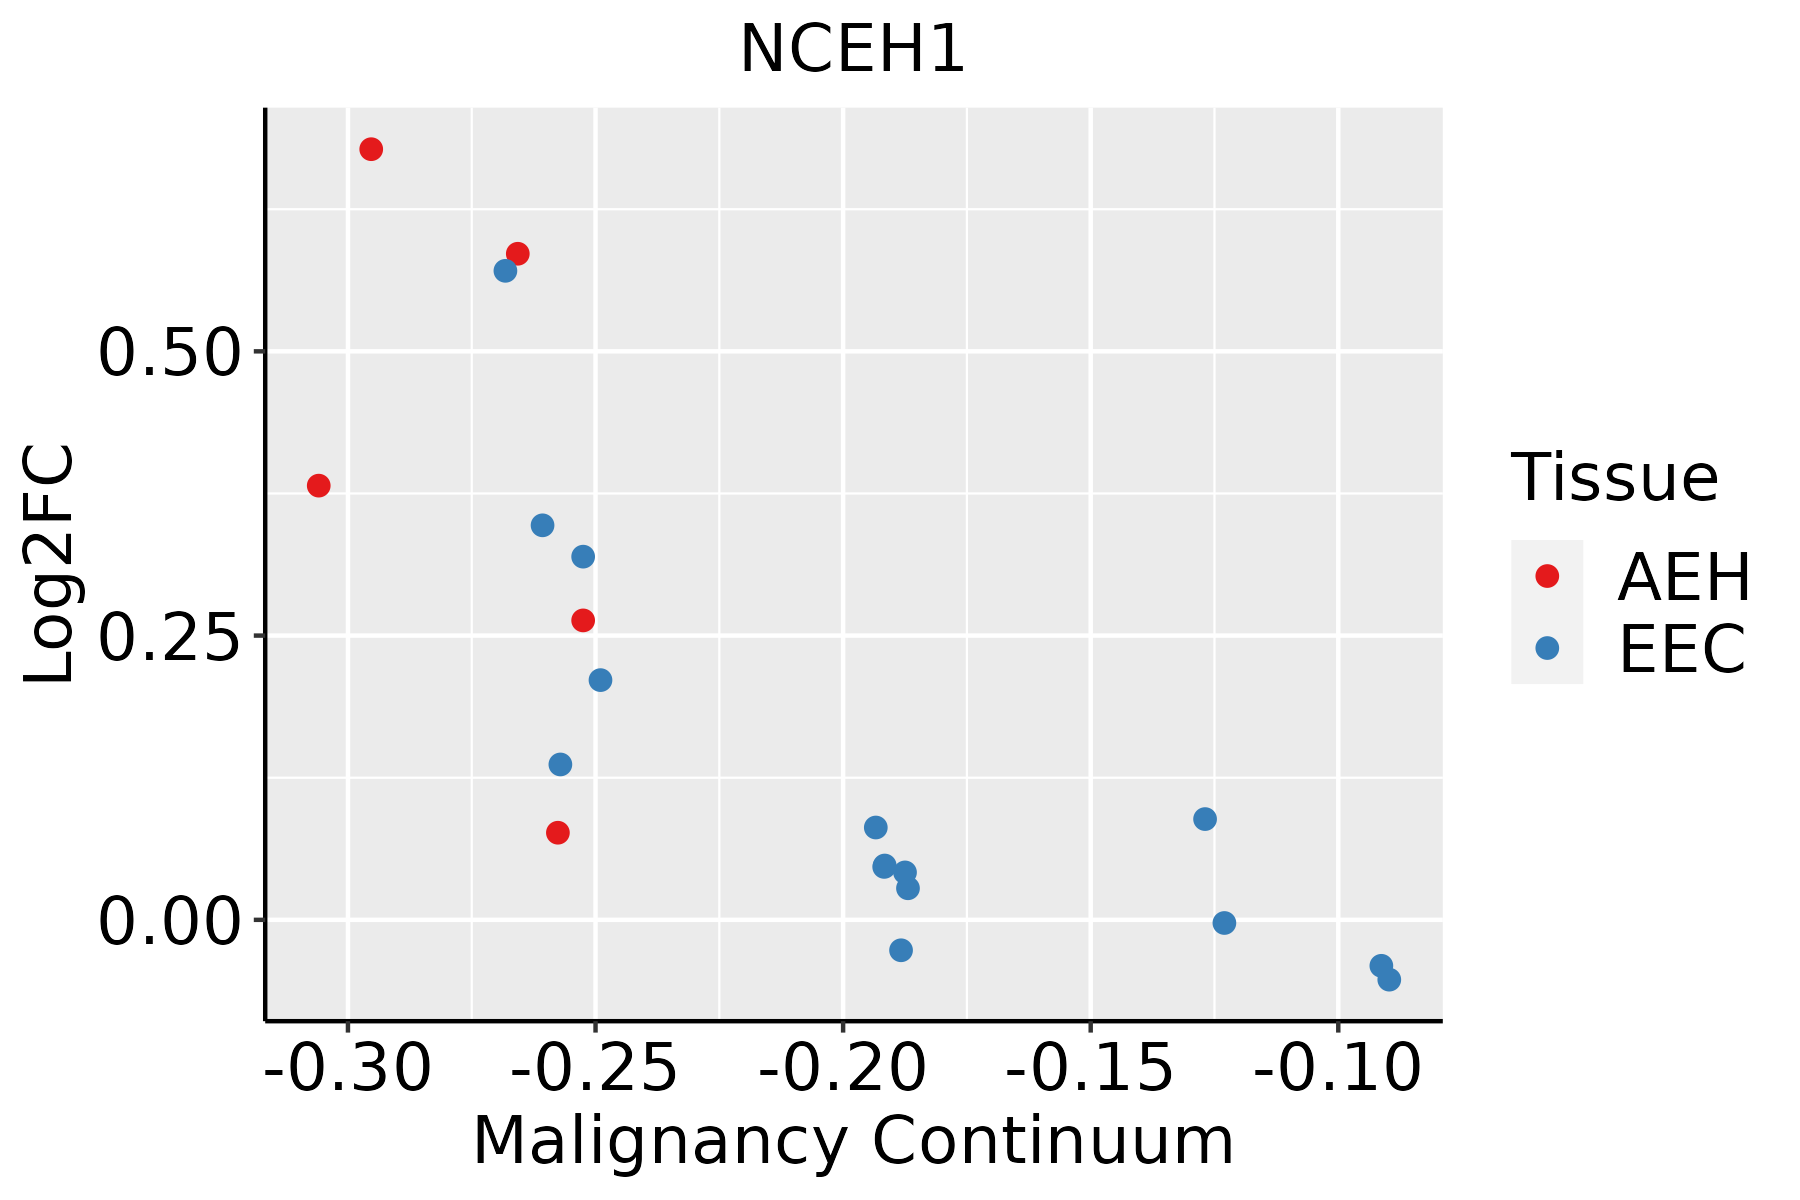 | AEH: Atypical endometrial hyperplasia |
| EEC: Endometrioid Cancer | ||
| Esophagus | 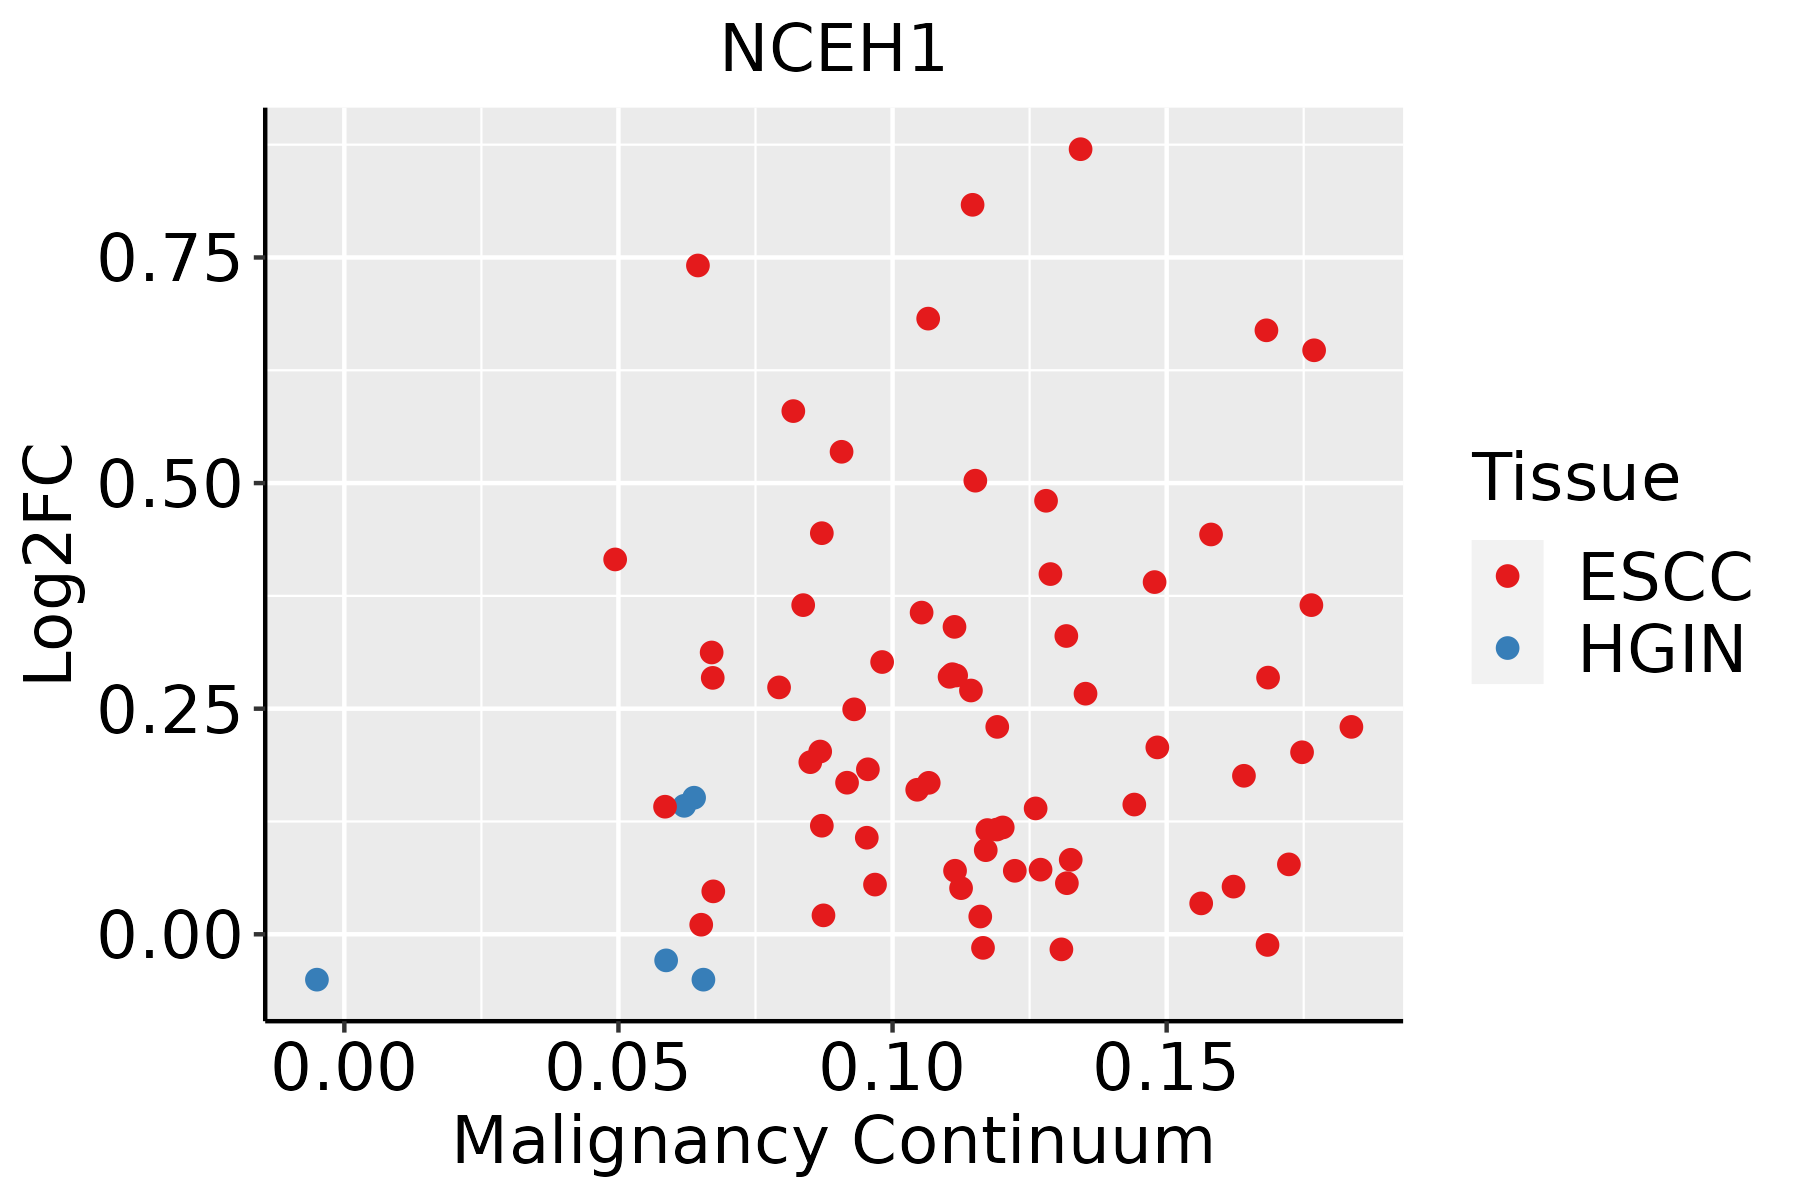 | ESCC: Esophageal squamous cell carcinoma |
| HGIN: High-grade intraepithelial neoplasias | ||
| LGIN: Low-grade intraepithelial neoplasias | ||
| Liver | 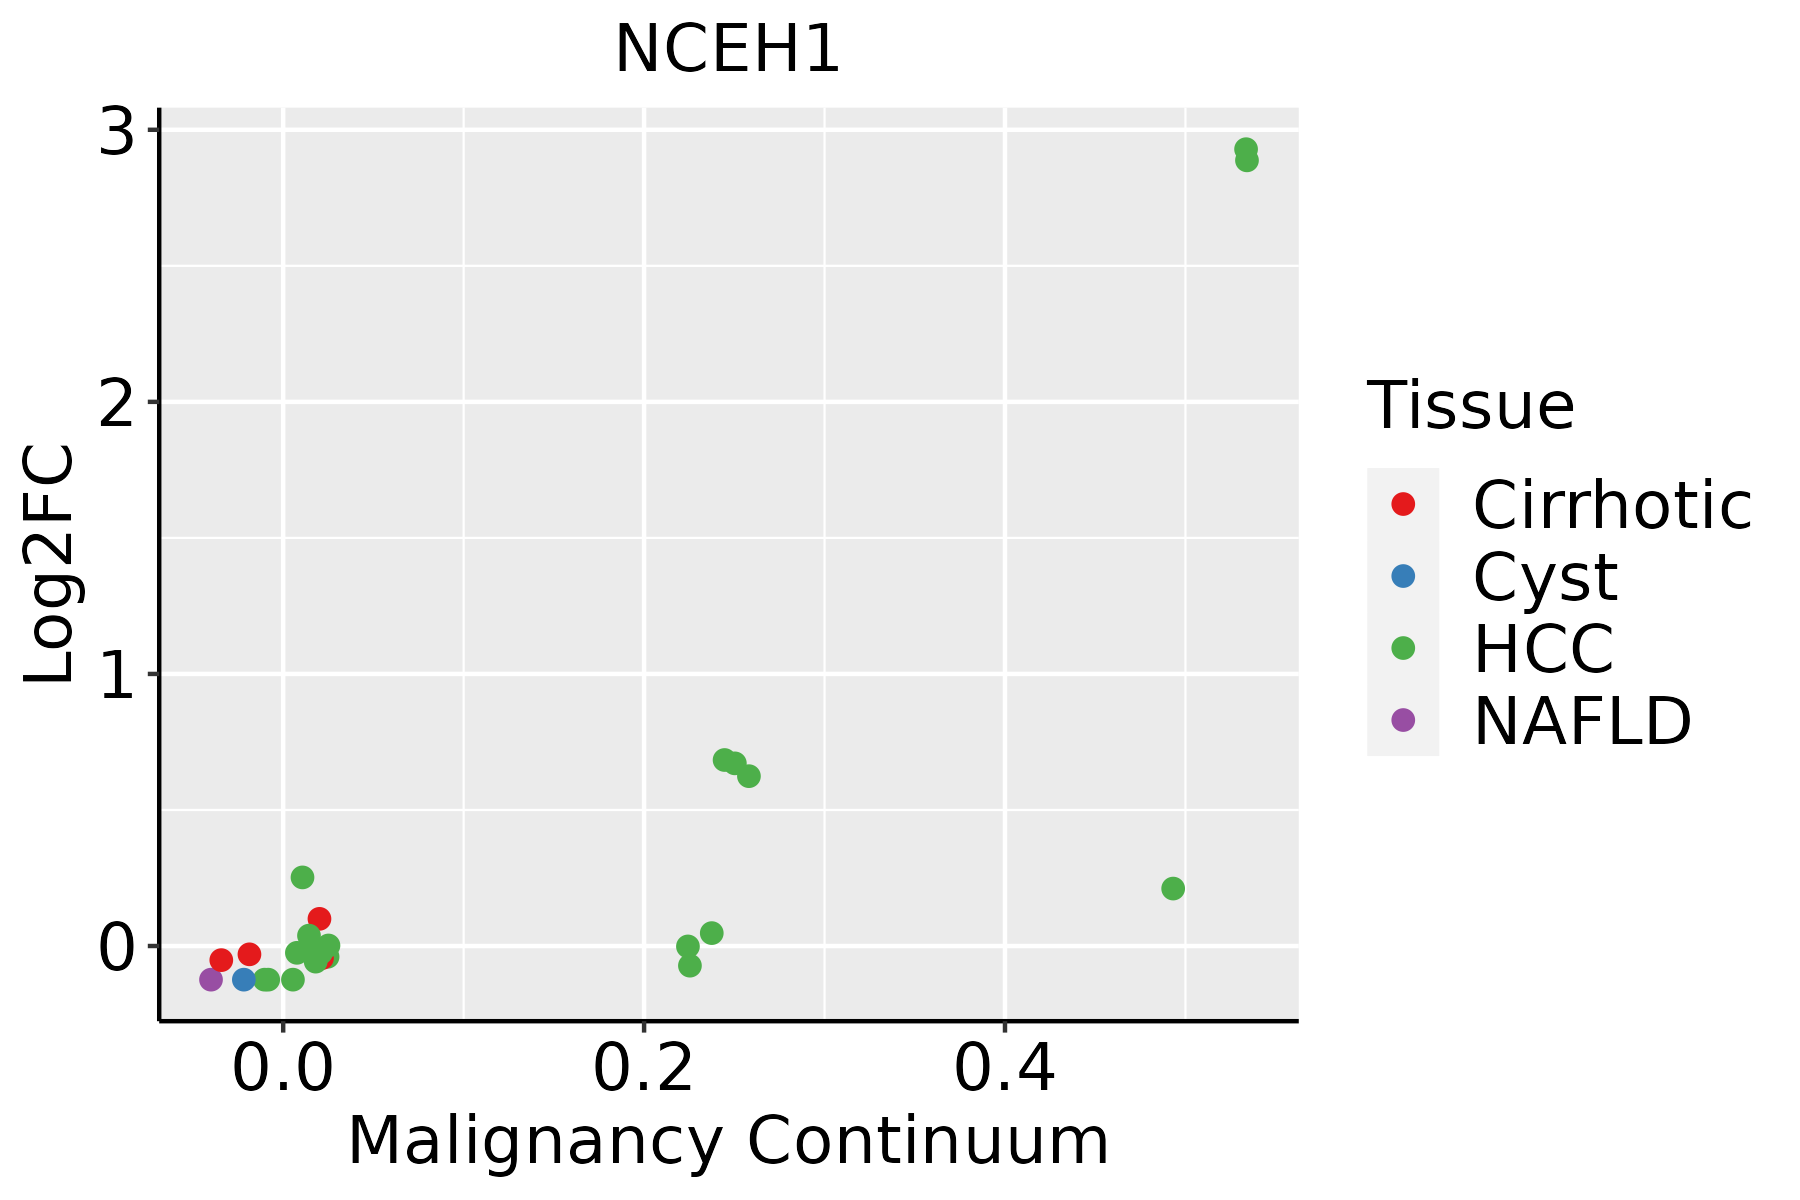 | HCC: Hepatocellular carcinoma |
| NAFLD: Non-alcoholic fatty liver disease | ||
| Lung | 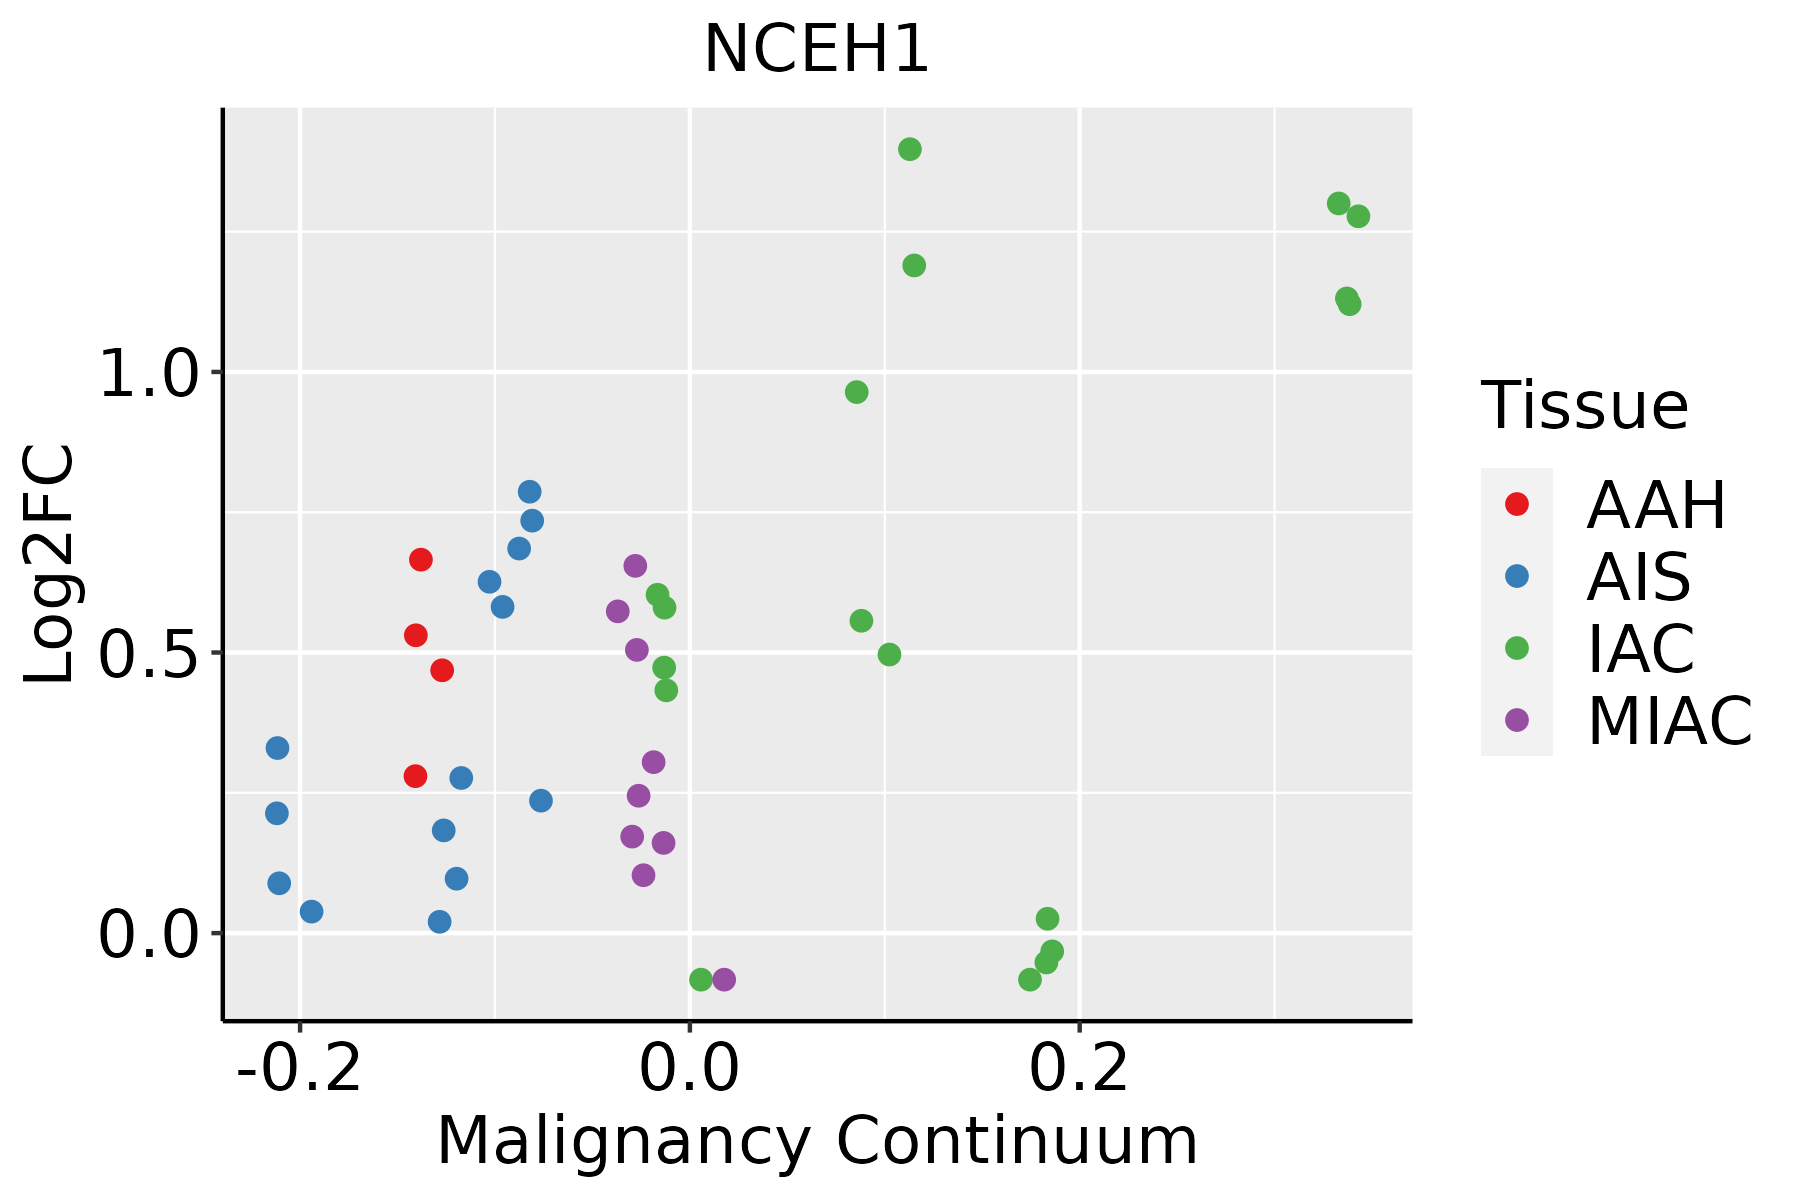 | AAH: Atypical adenomatous hyperplasia |
| AIS: Adenocarcinoma in situ | ||
| IAC: Invasive lung adenocarcinoma | ||
| MIA: Minimally invasive adenocarcinoma | ||
| Oral Cavity | 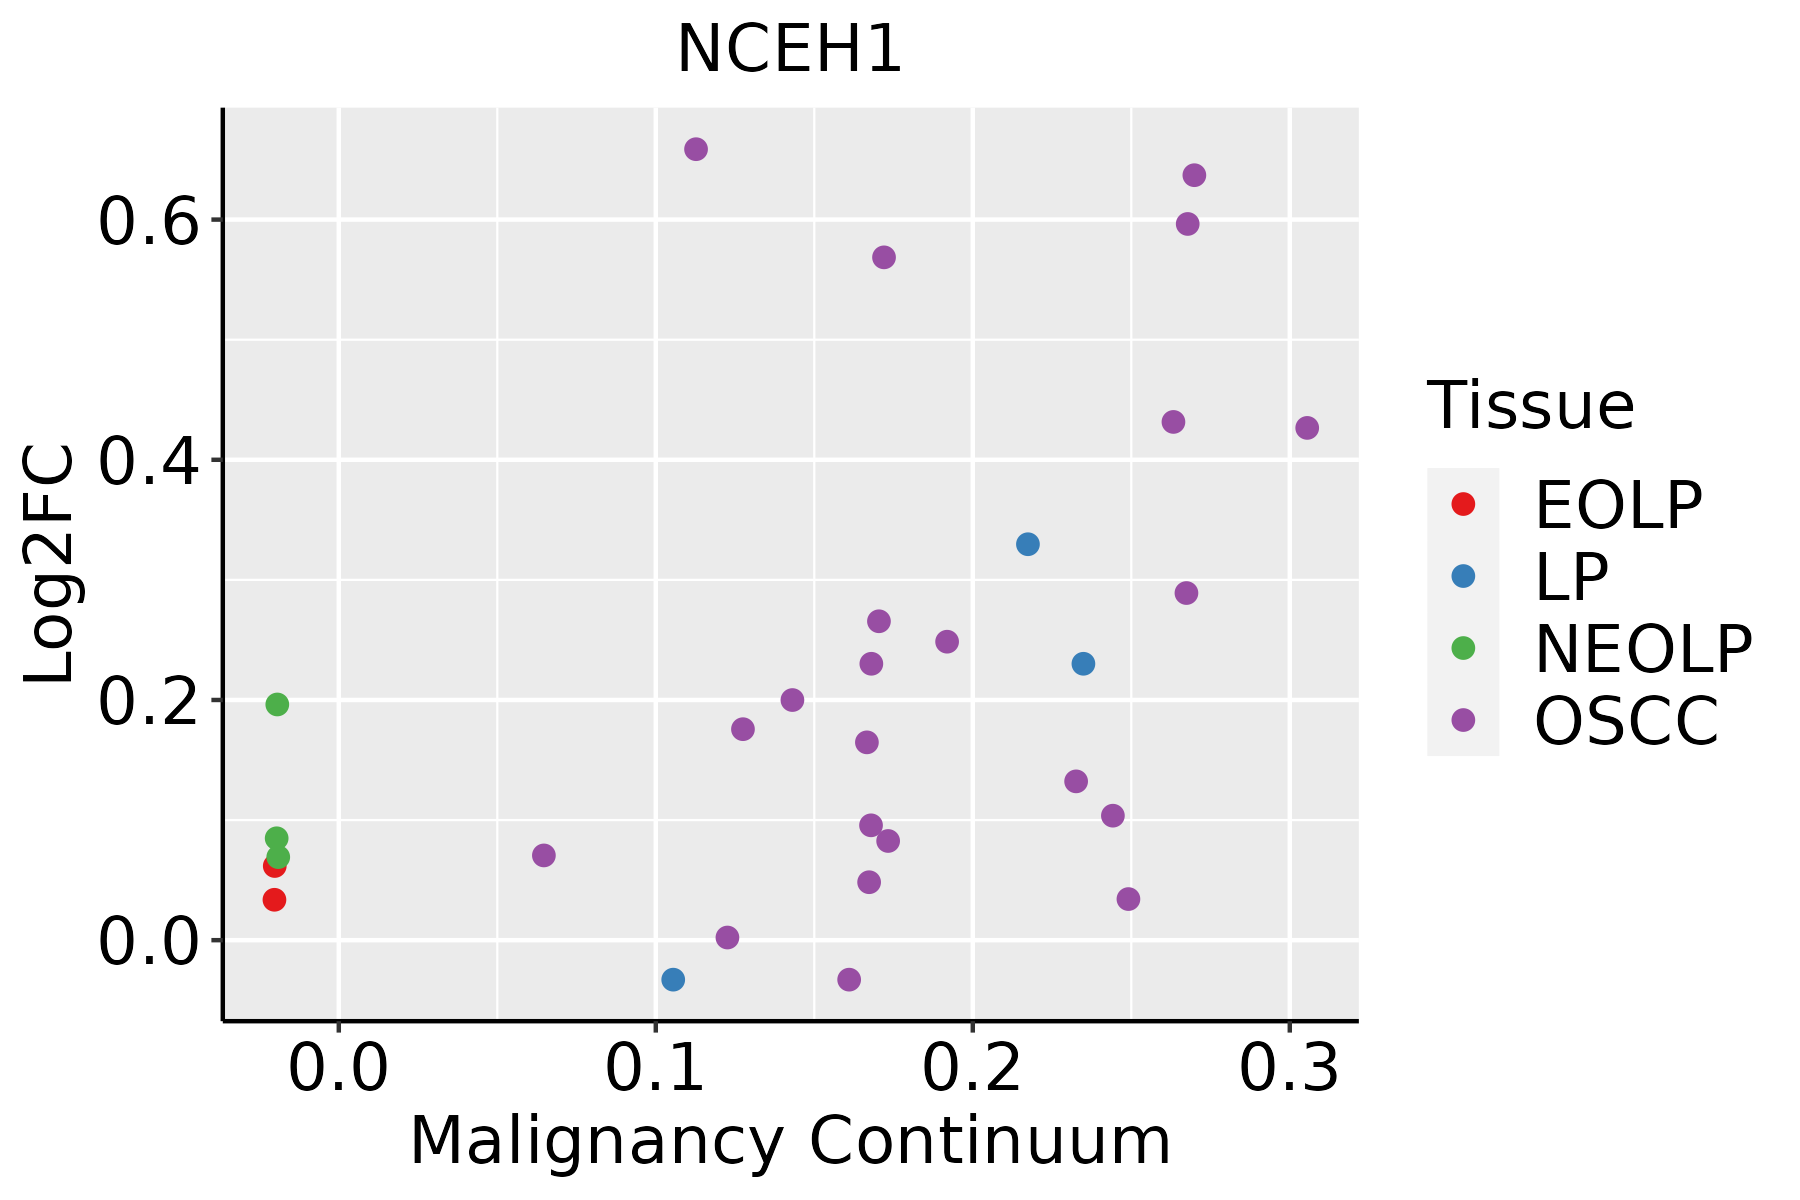 | EOLP: Erosive Oral lichen planus |
| LP: leukoplakia | ||
| NEOLP: Non-erosive oral lichen planus | ||
| OSCC: Oral squamous cell carcinoma | ||
| Prostate | 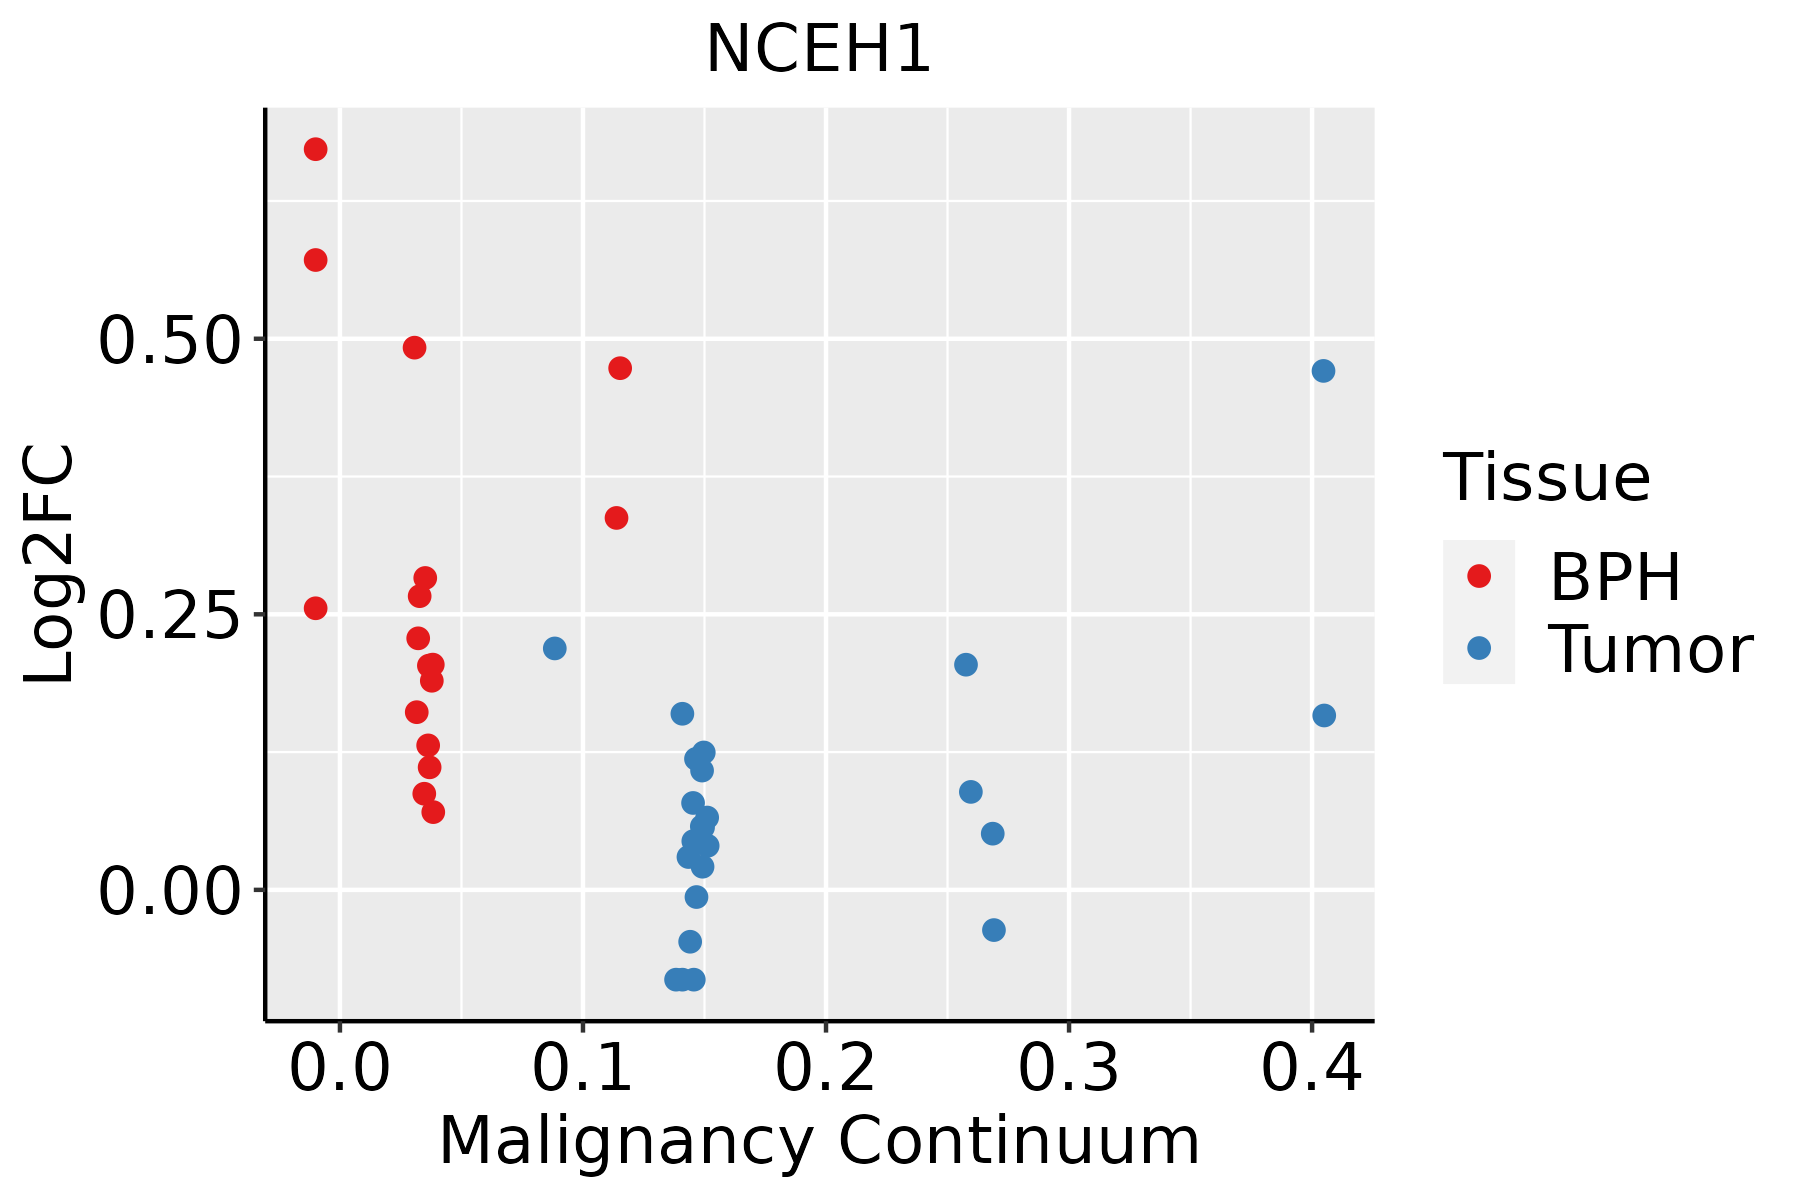 | BPH: Benign Prostatic Hyperplasia |
| ∗log2FC in expression of this searched gene in stem-like cells from each diseased tissue sample relative to stem-like cells in normal samples in each tissue plotted against the malignancy continuum. Samples are colored based on if they are from different disease stage. |
Top |
Malignant transformation related pathway analysis |
| Find out the enriched GO biological processes and KEGG pathways involved in transition from healthy to precancer to cancer |
| Tissue | Disease Stage | Enriched GO biological Processes |
| Colorectum | AD |  |
| Colorectum | SER |  |
| Colorectum | MSS |  |
| Colorectum | MSI-H |  |
| Colorectum | FAP |  |
| ∗Top 15 enriched GO BP terms are showed in the bar plot of each disease state in each tissue. Each row represents a significant GO biological process which is colored according to the -log10(p.adjust). |
| Page: 1 2 3 4 5 6 7 8 9 |
| GO ID | Tissue | Disease Stage | Description | Gene Ratio | Bg Ratio | pvalue | p.adjust | Count |
| GO:00064708 | Cervix | CC | protein dephosphorylation | 60/2311 | 281/18723 | 1.33e-05 | 2.68e-04 | 60 |
| GO:00071786 | Cervix | CC | transmembrane receptor protein serine/threonine kinase signaling pathway | 67/2311 | 355/18723 | 2.39e-04 | 2.67e-03 | 67 |
| GO:00163117 | Cervix | CC | dephosphorylation | 73/2311 | 417/18723 | 1.23e-03 | 9.87e-03 | 73 |
| GO:00094109 | Cervix | CC | response to xenobiotic stimulus | 78/2311 | 462/18723 | 2.39e-03 | 1.70e-02 | 78 |
| GO:0016311 | Colorectum | AD | dephosphorylation | 123/3918 | 417/18723 | 1.84e-05 | 3.82e-04 | 123 |
| GO:0006470 | Colorectum | AD | protein dephosphorylation | 88/3918 | 281/18723 | 2.56e-05 | 4.89e-04 | 88 |
| GO:0016042 | Colorectum | AD | lipid catabolic process | 97/3918 | 320/18723 | 4.31e-05 | 7.56e-04 | 97 |
| GO:0009410 | Colorectum | AD | response to xenobiotic stimulus | 128/3918 | 462/18723 | 2.69e-04 | 3.31e-03 | 128 |
| GO:0018904 | Colorectum | AD | ether metabolic process | 14/3918 | 27/18723 | 3.72e-04 | 4.29e-03 | 14 |
| GO:0006662 | Colorectum | AD | glycerol ether metabolic process | 12/3918 | 22/18723 | 5.38e-04 | 5.74e-03 | 12 |
| GO:0007178 | Colorectum | AD | transmembrane receptor protein serine/threonine kinase signaling pathway | 99/3918 | 355/18723 | 9.92e-04 | 9.28e-03 | 99 |
| GO:0046485 | Colorectum | AD | ether lipid metabolic process | 10/3918 | 20/18723 | 3.67e-03 | 2.60e-02 | 10 |
| GO:0060395 | Colorectum | AD | SMAD protein signal transduction | 28/3918 | 82/18723 | 3.73e-03 | 2.63e-02 | 28 |
| GO:00163113 | Colorectum | FAP | dephosphorylation | 95/2622 | 417/18723 | 7.07e-07 | 3.32e-05 | 95 |
| GO:00064704 | Colorectum | FAP | protein dephosphorylation | 69/2622 | 281/18723 | 1.47e-06 | 6.39e-05 | 69 |
| GO:00071782 | Colorectum | FAP | transmembrane receptor protein serine/threonine kinase signaling pathway | 81/2622 | 355/18723 | 4.28e-06 | 1.46e-04 | 81 |
| GO:00603951 | Colorectum | FAP | SMAD protein signal transduction | 24/2622 | 82/18723 | 2.55e-04 | 3.51e-03 | 24 |
| GO:00160423 | Colorectum | FAP | lipid catabolic process | 65/2622 | 320/18723 | 1.13e-03 | 1.08e-02 | 65 |
| GO:00094102 | Colorectum | FAP | response to xenobiotic stimulus | 87/2622 | 462/18723 | 2.15e-03 | 1.77e-02 | 87 |
| GO:00189042 | Colorectum | FAP | ether metabolic process | 10/2622 | 27/18723 | 2.46e-03 | 1.95e-02 | 10 |
| Page: 1 2 3 4 |
| Pathway ID | Tissue | Disease Stage | Description | Gene Ratio | Bg Ratio | pvalue | p.adjust | qvalue | Count |
| hsa04976 | Colorectum | FAP | Bile secretion | 24/1404 | 89/8465 | 8.76e-03 | 3.21e-02 | 1.96e-02 | 24 |
| hsa049761 | Colorectum | FAP | Bile secretion | 24/1404 | 89/8465 | 8.76e-03 | 3.21e-02 | 1.96e-02 | 24 |
| hsa049792 | Liver | Cirrhotic | Cholesterol metabolism | 30/2530 | 51/8465 | 1.59e-05 | 1.39e-04 | 8.60e-05 | 30 |
| hsa049793 | Liver | Cirrhotic | Cholesterol metabolism | 30/2530 | 51/8465 | 1.59e-05 | 1.39e-04 | 8.60e-05 | 30 |
| hsa049794 | Liver | HCC | Cholesterol metabolism | 41/4020 | 51/8465 | 1.33e-06 | 1.35e-05 | 7.49e-06 | 41 |
| hsa049795 | Liver | HCC | Cholesterol metabolism | 41/4020 | 51/8465 | 1.33e-06 | 1.35e-05 | 7.49e-06 | 41 |
| Page: 1 |
Top |
Cell-cell communication analysis |
| Identification of potential cell-cell interactions between two cell types and their ligand-receptor pairs for different disease states |
| Ligand | Receptor | LRpair | Pathway | Tissue | Disease Stage |
| Page: 1 |
Top |
Single-cell gene regulatory network inference analysis |
| Find out the significant the regulons (TFs) and the target genes of each regulon across cell types for different disease states |
| TF | Cell Type | Tissue | Disease Stage | Target Gene | RSS | Regulon Activity |
| ∗The dot plots of a searched regulon are shown for all cell subpopulations in each disease state of each tissue based on the regulon specific score inferred using pySCENIC and by calculating the average expression. |
| Page: 1 |
Top |
Somatic mutation of malignant transformation related genes |
| Annotation of somatic variants for genes involved in malignant transformation |
| Hugo Symbol | Variant Class | Variant Classification | dbSNP RS | HGVSc | HGVSp | HGVSp Short | SWISSPROT | BIOTYPE | SIFT | PolyPhen | Tumor Sample Barcode | Tissue | Histology | Sex | Age | Stage | Therapy Types | Drugs | Outcome |
| NCEH1 | SNV | Missense_Mutation | c.66C>G | p.Cys22Trp | p.C22W | protein_coding | tolerated_low_confidence(0.16) | benign(0.148) | TCGA-A7-A0CE-01 | Breast | breast invasive carcinoma | Female | <65 | I/II | Chemotherapy | adriamycin | SD | ||
| NCEH1 | SNV | Missense_Mutation | c.415N>G | p.Arg139Gly | p.R139G | protein_coding | deleterious(0) | possibly_damaging(0.831) | TCGA-AO-A1KR-01 | Breast | breast invasive carcinoma | Female | <65 | I/II | Chemotherapy | cyclophosphamide | SD | ||
| NCEH1 | SNV | Missense_Mutation | novel | c.764N>T | p.Lys255Ile | p.K255I | protein_coding | deleterious(0) | probably_damaging(0.991) | TCGA-S3-A6ZF-01 | Breast | breast invasive carcinoma | Female | <65 | I/II | Chemotherapy | taxotere | CR | |
| NCEH1 | insertion | In_Frame_Ins | novel | c.155_156insTCCATCAAAGCCTTATAAGTGTGTTTATTTTTT | p.Tyr52_Ile53insProSerLysProTyrLysCysValTyrPhePhe | p.Y52_I53insPSKPYKCVYFF | protein_coding | TCGA-A7-A0CG-01 | Breast | breast invasive carcinoma | Female | >=65 | I/II | Unknown | Unknown | SD | |||
| NCEH1 | SNV | Missense_Mutation | novel | c.1147C>G | p.Leu383Val | p.L383V | protein_coding | deleterious(0.04) | possibly_damaging(0.857) | TCGA-EK-A2RM-01 | Cervix | cervical & endocervical cancer | Female | <65 | I/II | Unknown | Unknown | SD | |
| NCEH1 | SNV | Missense_Mutation | c.902N>G | p.Asp301Gly | p.D301G | protein_coding | tolerated(0.05) | benign(0.194) | TCGA-AA-3715-01 | Colorectum | colon adenocarcinoma | Male | >=65 | I/II | Unknown | Unknown | PD | ||
| NCEH1 | SNV | Missense_Mutation | rs754711926 | c.1087N>T | p.Arg363Cys | p.R363C | protein_coding | deleterious(0) | possibly_damaging(0.819) | TCGA-AA-3877-01 | Colorectum | colon adenocarcinoma | Female | >=65 | I/II | Unknown | Unknown | SD | |
| NCEH1 | SNV | Missense_Mutation | rs761406371 | c.467N>T | p.Ala156Val | p.A156V | protein_coding | tolerated(0.27) | benign(0) | TCGA-AA-3977-01 | Colorectum | colon adenocarcinoma | Male | >=65 | I/II | Unknown | Unknown | SD | |
| NCEH1 | SNV | Missense_Mutation | c.790N>A | p.Leu264Ile | p.L264I | protein_coding | deleterious(0) | probably_damaging(0.997) | TCGA-AA-3984-01 | Colorectum | colon adenocarcinoma | Female | <65 | I/II | Unknown | Unknown | SD | ||
| NCEH1 | SNV | Missense_Mutation | c.173N>A | p.Ser58Tyr | p.S58Y | protein_coding | deleterious(0.01) | benign(0.075) | TCGA-AY-6196-01 | Colorectum | colon adenocarcinoma | Male | <65 | III/IV | Unknown | Unknown | SD |
| Page: 1 2 3 4 5 |
Top |
Related drugs of malignant transformation related genes |
| Identification of chemicals and drugs interact with genes involved in malignant transfromation |
| (DGIdb 4.0) |
| Entrez ID | Symbol | Category | Interaction Types | Drug Claim Name | Drug Name | PMIDs |
| Page: 1 |

Copyright 2023-Present -The University of Texas Health Science Center at Houston |