
|
|||||
|
 | |
| |
| |
| |
| |
| |
|
Gene: NCBP3 |
Gene summary for NCBP3 |
| Gene information | Species | Human | Gene symbol | NCBP3 | Gene ID | 55421 |
| Gene name | nuclear cap binding subunit 3 | |
| Gene Alias | C17orf85 | |
| Cytomap | 17p13.2 | |
| Gene Type | protein-coding | GO ID | GO:0002376 | UniProtAcc | Q53F19 |
Top |
Malignant transformation analysis |
| Identification of the aberrant gene expression in precancerous and cancerous lesions by comparing the gene expression of stem-like cells in diseased tissues with normal stem cells |
| Entrez ID | Symbol | Replicates | Species | Organ | Tissue | Adj P-value | Log2FC | Malignancy |
| 55421 | NCBP3 | LZE4T | Human | Esophagus | ESCC | 1.44e-19 | 4.48e-01 | 0.0811 |
| 55421 | NCBP3 | LZE7T | Human | Esophagus | ESCC | 4.05e-12 | 5.87e-01 | 0.0667 |
| 55421 | NCBP3 | LZE8T | Human | Esophagus | ESCC | 3.87e-08 | 2.08e-01 | 0.067 |
| 55421 | NCBP3 | LZE20T | Human | Esophagus | ESCC | 1.48e-07 | 1.31e-01 | 0.0662 |
| 55421 | NCBP3 | LZE22T | Human | Esophagus | ESCC | 3.90e-03 | 1.53e-01 | 0.068 |
| 55421 | NCBP3 | LZE24T | Human | Esophagus | ESCC | 2.43e-21 | 4.89e-01 | 0.0596 |
| 55421 | NCBP3 | LZE21T | Human | Esophagus | ESCC | 1.42e-03 | 1.78e-01 | 0.0655 |
| 55421 | NCBP3 | P1T-E | Human | Esophagus | ESCC | 2.83e-11 | 4.27e-01 | 0.0875 |
| 55421 | NCBP3 | P2T-E | Human | Esophagus | ESCC | 1.82e-36 | 5.50e-01 | 0.1177 |
| 55421 | NCBP3 | P4T-E | Human | Esophagus | ESCC | 2.07e-31 | 6.43e-01 | 0.1323 |
| 55421 | NCBP3 | P5T-E | Human | Esophagus | ESCC | 1.99e-15 | 1.17e-01 | 0.1327 |
| 55421 | NCBP3 | P8T-E | Human | Esophagus | ESCC | 6.53e-34 | 5.33e-01 | 0.0889 |
| 55421 | NCBP3 | P9T-E | Human | Esophagus | ESCC | 6.22e-19 | 3.09e-01 | 0.1131 |
| 55421 | NCBP3 | P10T-E | Human | Esophagus | ESCC | 1.55e-23 | 3.99e-01 | 0.116 |
| 55421 | NCBP3 | P11T-E | Human | Esophagus | ESCC | 1.49e-10 | 5.43e-01 | 0.1426 |
| 55421 | NCBP3 | P12T-E | Human | Esophagus | ESCC | 1.78e-40 | 6.38e-01 | 0.1122 |
| 55421 | NCBP3 | P15T-E | Human | Esophagus | ESCC | 1.28e-20 | 3.55e-01 | 0.1149 |
| 55421 | NCBP3 | P16T-E | Human | Esophagus | ESCC | 6.64e-42 | 6.38e-01 | 0.1153 |
| 55421 | NCBP3 | P17T-E | Human | Esophagus | ESCC | 3.69e-10 | 4.24e-01 | 0.1278 |
| 55421 | NCBP3 | P19T-E | Human | Esophagus | ESCC | 1.47e-10 | 8.42e-01 | 0.1662 |
| Page: 1 2 3 4 5 |
| Tissue | Expression Dynamics | Abbreviation |
| Esophagus | 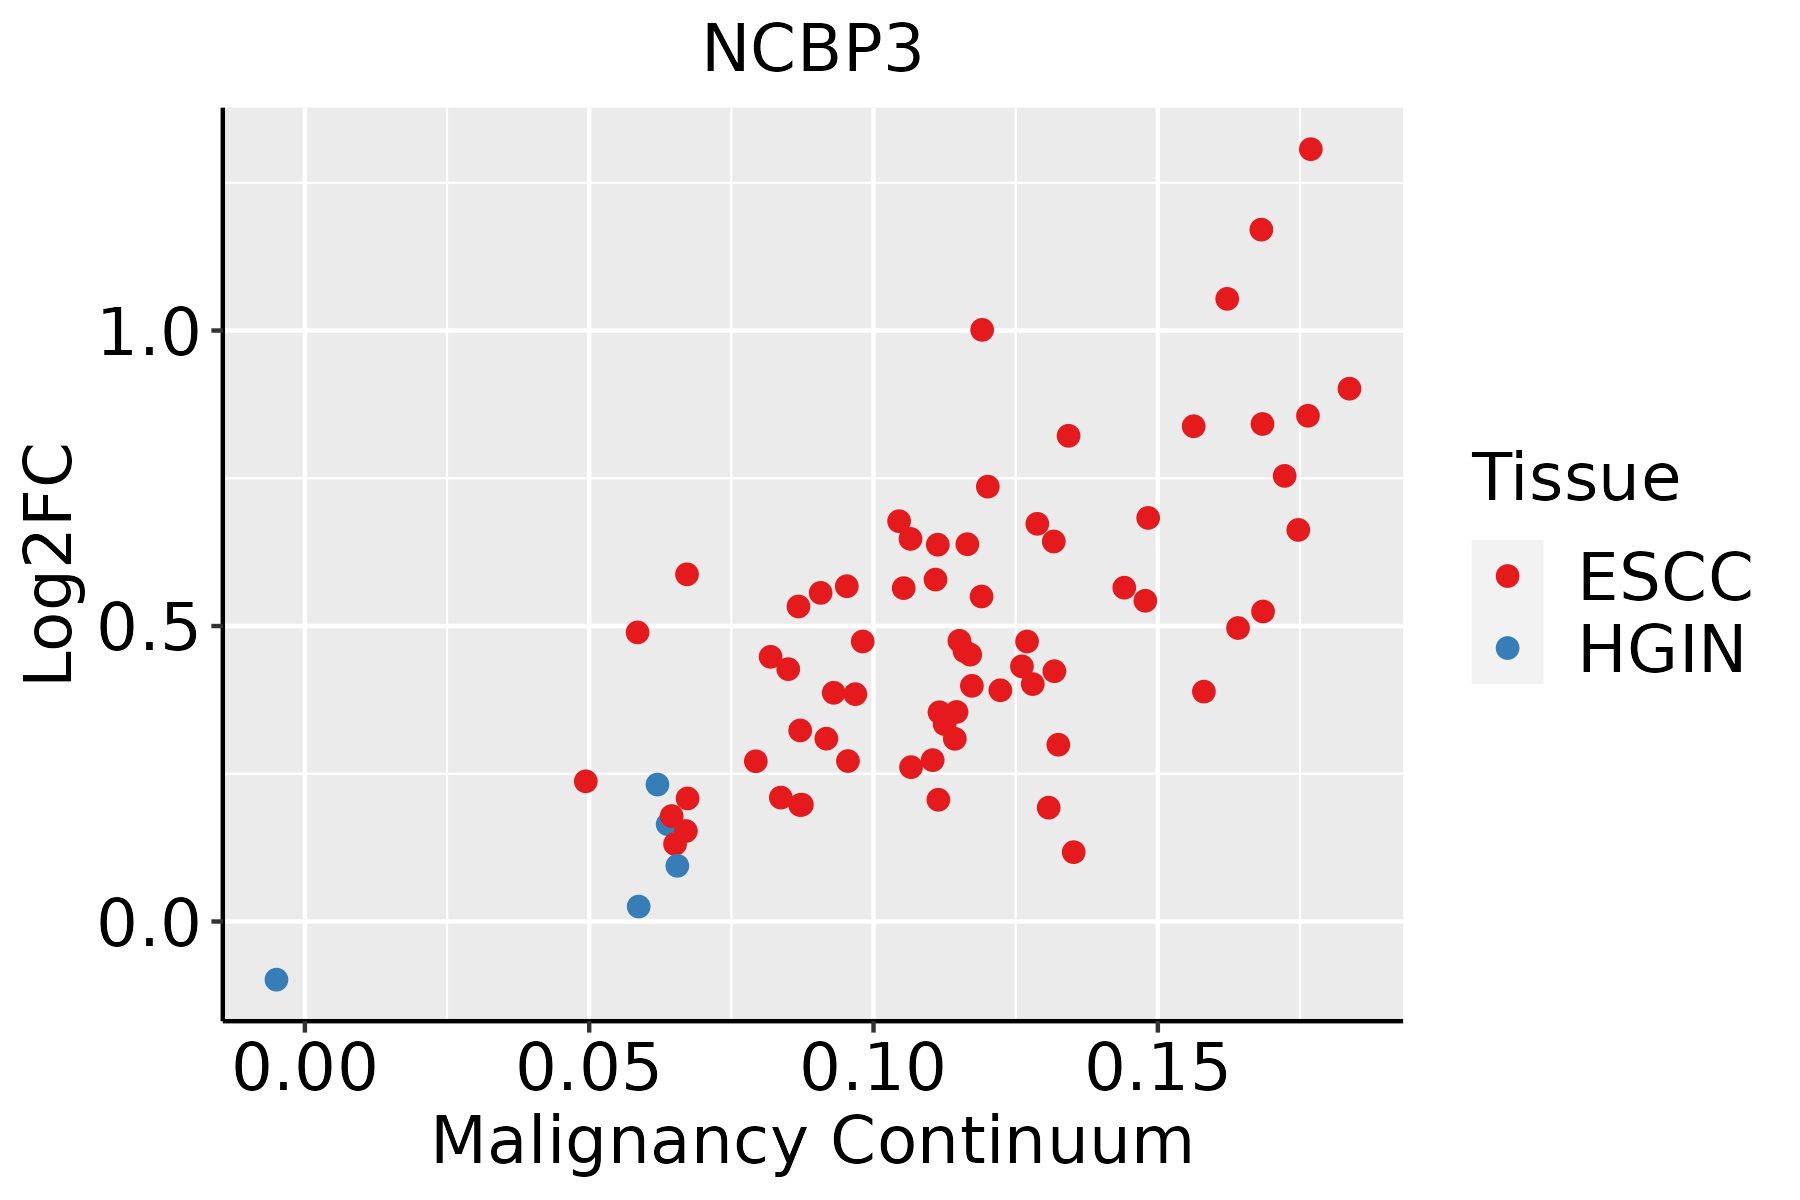 | ESCC: Esophageal squamous cell carcinoma |
| HGIN: High-grade intraepithelial neoplasias | ||
| LGIN: Low-grade intraepithelial neoplasias | ||
| Oral Cavity | 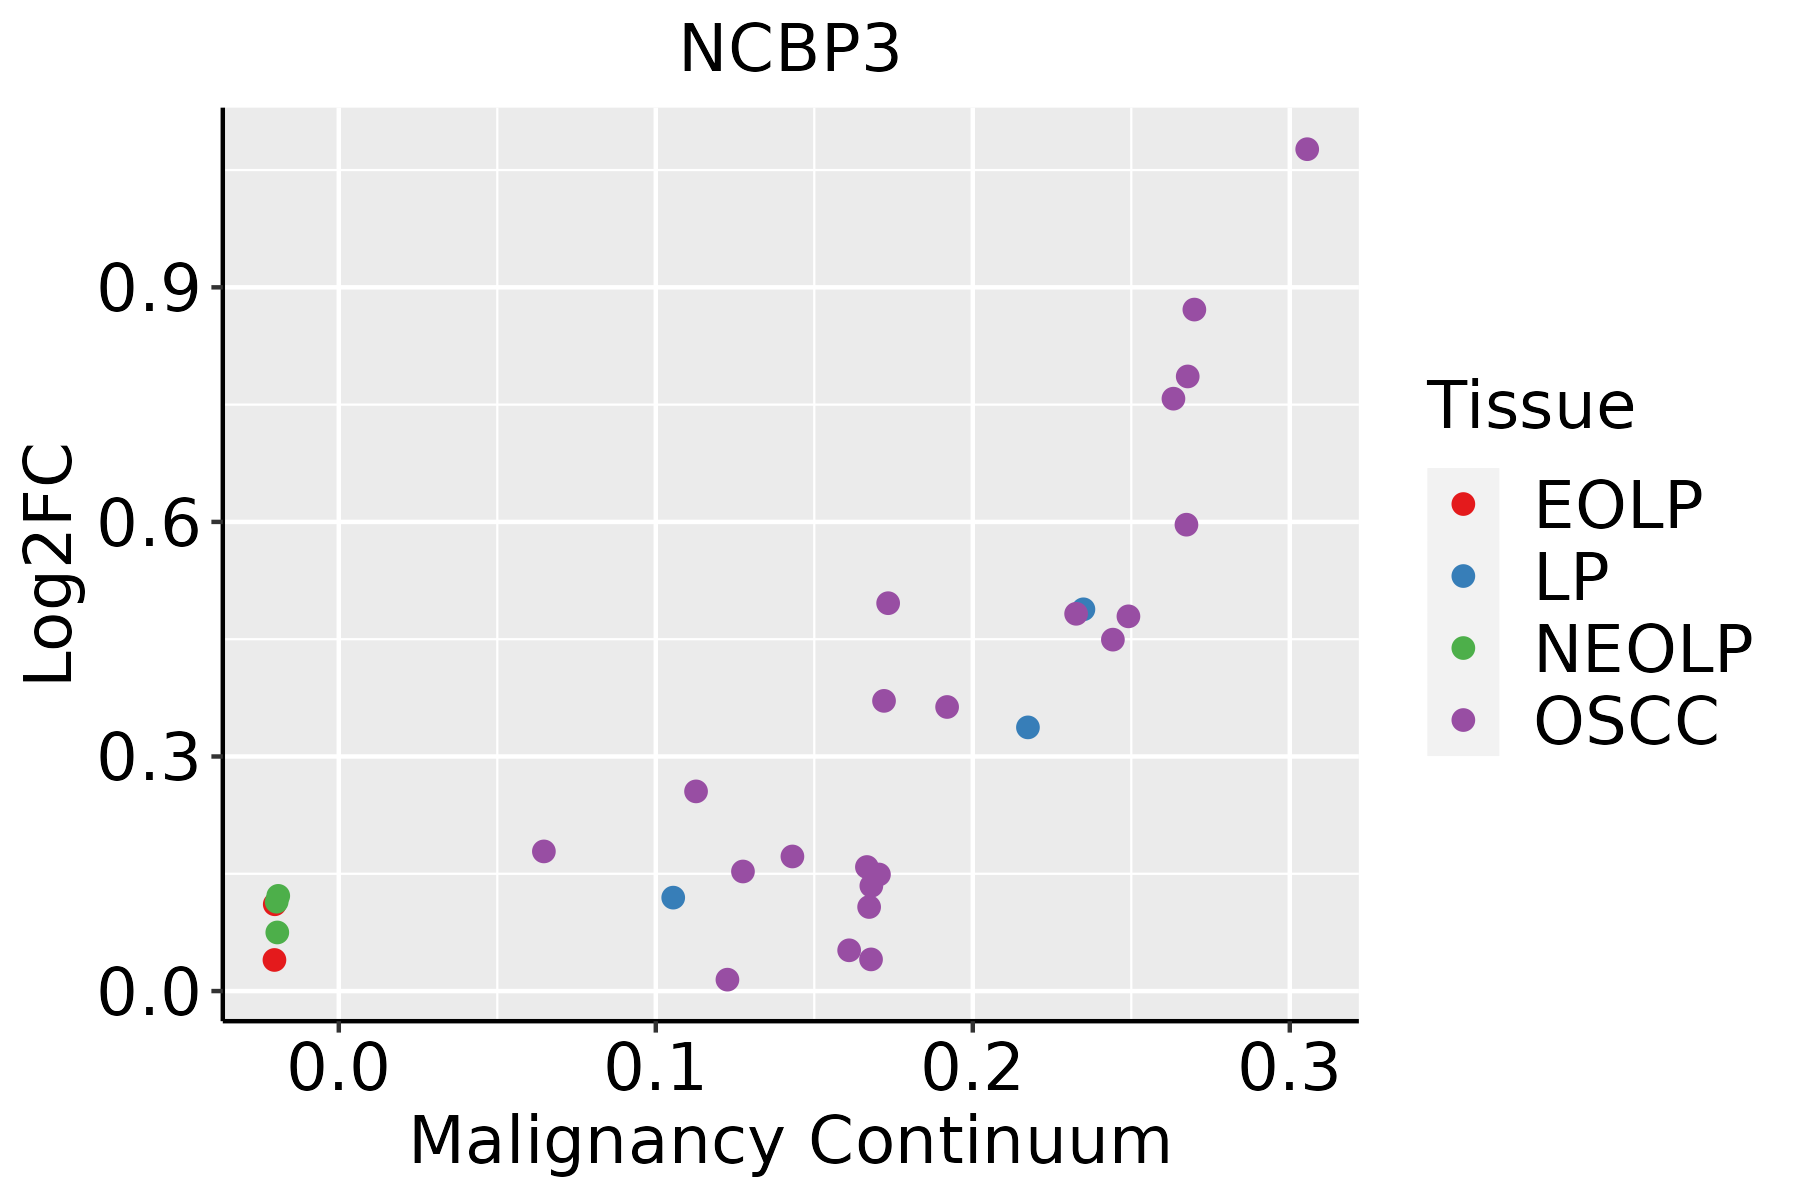 | EOLP: Erosive Oral lichen planus |
| LP: leukoplakia | ||
| NEOLP: Non-erosive oral lichen planus | ||
| OSCC: Oral squamous cell carcinoma | ||
| Thyroid | 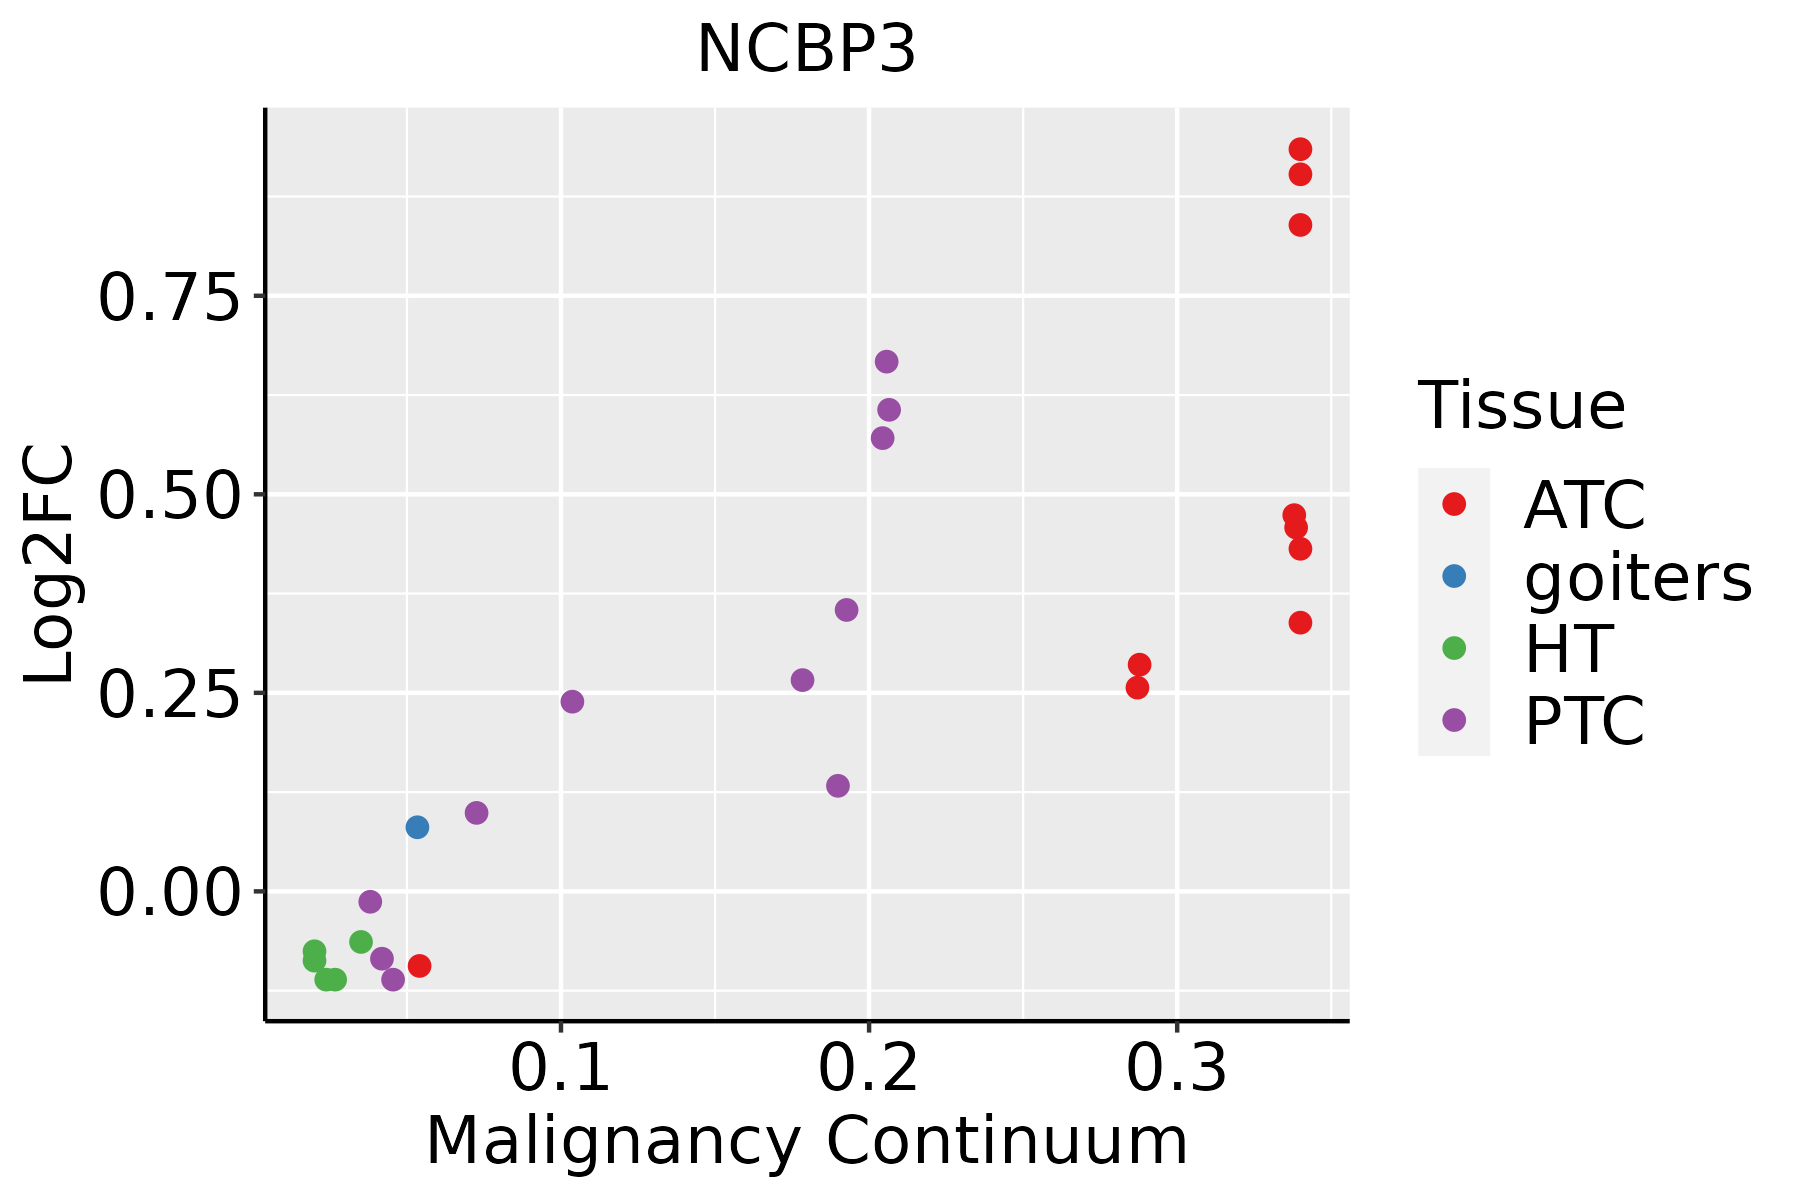 | ATC: Anaplastic thyroid cancer |
| HT: Hashimoto's thyroiditis | ||
| PTC: Papillary thyroid cancer |
| ∗log2FC in expression of this searched gene in stem-like cells from each diseased tissue sample relative to stem-like cells in normal samples in each tissue plotted against the malignancy continuum. Samples are colored based on if they are from different disease stage. |
Top |
Malignant transformation related pathway analysis |
| Find out the enriched GO biological processes and KEGG pathways involved in transition from healthy to precancer to cancer |
| Tissue | Disease Stage | Enriched GO biological Processes |
| Colorectum | AD |  |
| Colorectum | SER |  |
| Colorectum | MSS |  |
| Colorectum | MSI-H |  |
| Colorectum | FAP |  |
| ∗Top 15 enriched GO BP terms are showed in the bar plot of each disease state in each tissue. Each row represents a significant GO biological process which is colored according to the -log10(p.adjust). |
| Page: 1 2 3 4 5 6 7 8 9 |
| GO ID | Tissue | Disease Stage | Description | Gene Ratio | Bg Ratio | pvalue | p.adjust | Count |
| GO:0006403110 | Esophagus | ESCC | RNA localization | 166/8552 | 201/18723 | 1.95e-27 | 6.18e-25 | 166 |
| GO:005123617 | Esophagus | ESCC | establishment of RNA localization | 134/8552 | 166/18723 | 1.23e-20 | 1.81e-18 | 134 |
| GO:005102815 | Esophagus | ESCC | mRNA transport | 110/8552 | 130/18723 | 2.76e-20 | 3.80e-18 | 110 |
| GO:005065717 | Esophagus | ESCC | nucleic acid transport | 131/8552 | 163/18723 | 6.94e-20 | 8.46e-18 | 131 |
| GO:005065817 | Esophagus | ESCC | RNA transport | 131/8552 | 163/18723 | 6.94e-20 | 8.46e-18 | 131 |
| GO:001593117 | Esophagus | ESCC | nucleobase-containing compound transport | 162/8552 | 222/18723 | 9.87e-17 | 7.93e-15 | 162 |
| GO:000961518 | Esophagus | ESCC | response to virus | 238/8552 | 367/18723 | 6.65e-14 | 3.32e-12 | 238 |
| GO:00516075 | Esophagus | ESCC | defense response to virus | 171/8552 | 265/18723 | 3.91e-10 | 1.05e-08 | 171 |
| GO:01405465 | Esophagus | ESCC | defense response to symbiont | 171/8552 | 265/18723 | 3.91e-10 | 1.05e-08 | 171 |
| GO:000640318 | Oral cavity | OSCC | RNA localization | 150/7305 | 201/18723 | 6.90e-25 | 1.98e-22 | 150 |
| GO:00510287 | Oral cavity | OSCC | mRNA transport | 101/7305 | 130/18723 | 2.19e-19 | 3.15e-17 | 101 |
| GO:005065714 | Oral cavity | OSCC | nucleic acid transport | 120/7305 | 163/18723 | 2.31e-19 | 3.18e-17 | 120 |
| GO:005065814 | Oral cavity | OSCC | RNA transport | 120/7305 | 163/18723 | 2.31e-19 | 3.18e-17 | 120 |
| GO:005123614 | Oral cavity | OSCC | establishment of RNA localization | 121/7305 | 166/18723 | 6.38e-19 | 8.24e-17 | 121 |
| GO:001593114 | Oral cavity | OSCC | nucleobase-containing compound transport | 150/7305 | 222/18723 | 4.86e-18 | 5.04e-16 | 150 |
| GO:000961515 | Oral cavity | OSCC | response to virus | 215/7305 | 367/18723 | 1.63e-14 | 9.41e-13 | 215 |
| GO:00516074 | Oral cavity | OSCC | defense response to virus | 154/7305 | 265/18723 | 1.96e-10 | 5.63e-09 | 154 |
| GO:01405464 | Oral cavity | OSCC | defense response to symbiont | 154/7305 | 265/18723 | 1.96e-10 | 5.63e-09 | 154 |
| GO:0006403112 | Thyroid | PTC | RNA localization | 130/5968 | 201/18723 | 9.23e-22 | 1.94e-19 | 130 |
| GO:0051236110 | Thyroid | PTC | establishment of RNA localization | 100/5968 | 166/18723 | 4.26e-14 | 2.58e-12 | 100 |
| Page: 1 2 |
| Pathway ID | Tissue | Disease Stage | Description | Gene Ratio | Bg Ratio | pvalue | p.adjust | qvalue | Count |
| Page: 1 |
Top |
Cell-cell communication analysis |
| Identification of potential cell-cell interactions between two cell types and their ligand-receptor pairs for different disease states |
| Ligand | Receptor | LRpair | Pathway | Tissue | Disease Stage |
| Page: 1 |
Top |
Single-cell gene regulatory network inference analysis |
| Find out the significant the regulons (TFs) and the target genes of each regulon across cell types for different disease states |
| TF | Cell Type | Tissue | Disease Stage | Target Gene | RSS | Regulon Activity |
| ∗The dot plots of a searched regulon are shown for all cell subpopulations in each disease state of each tissue based on the regulon specific score inferred using pySCENIC and by calculating the average expression. |
| Page: 1 |
Top |
Somatic mutation of malignant transformation related genes |
| Annotation of somatic variants for genes involved in malignant transformation |
| Hugo Symbol | Variant Class | Variant Classification | dbSNP RS | HGVSc | HGVSp | HGVSp Short | SWISSPROT | BIOTYPE | SIFT | PolyPhen | Tumor Sample Barcode | Tissue | Histology | Sex | Age | Stage | Therapy Types | Drugs | Outcome |
| NCBP3 | SNV | Missense_Mutation | c.1166N>G | p.Ser389Cys | p.S389C | Q53F19 | protein_coding | deleterious(0.04) | possibly_damaging(0.804) | TCGA-AC-A23H-01 | Breast | breast invasive carcinoma | Female | >=65 | I/II | Unknown | Unknown | PD | |
| NCBP3 | SNV | Missense_Mutation | c.384N>G | p.Ile128Met | p.I128M | Q53F19 | protein_coding | deleterious(0) | possibly_damaging(0.866) | TCGA-AC-A23H-01 | Breast | breast invasive carcinoma | Female | >=65 | I/II | Unknown | Unknown | PD | |
| NCBP3 | SNV | Missense_Mutation | c.830N>C | p.Ser277Thr | p.S277T | Q53F19 | protein_coding | deleterious(0) | possibly_damaging(0.525) | TCGA-AQ-A0Y5-01 | Breast | breast invasive carcinoma | Female | >=65 | III/IV | Chemotherapy | cytoxan | SD | |
| NCBP3 | SNV | Missense_Mutation | c.479C>T | p.Ser160Phe | p.S160F | Q53F19 | protein_coding | deleterious(0) | probably_damaging(0.996) | TCGA-BH-A1FU-01 | Breast | breast invasive carcinoma | Female | <65 | I/II | Unknown | Unknown | PD | |
| NCBP3 | insertion | Frame_Shift_Ins | novel | c.1493_1494insTCCGCTCTTGCTACTTCGGCAAGACATCTTAAGAATG | p.His499ProfsTer20 | p.H499Pfs*20 | Q53F19 | protein_coding | TCGA-A8-A08T-01 | Breast | breast invasive carcinoma | Female | <65 | III/IV | Unknown | Unknown | PD | ||
| NCBP3 | deletion | Frame_Shift_Del | novel | c.969delN | p.Gly324AlafsTer2 | p.G324Afs*2 | Q53F19 | protein_coding | TCGA-D8-A27V-01 | Breast | breast invasive carcinoma | Female | <65 | I/II | Hormone Therapy | tamoxiphen | SD | ||
| NCBP3 | SNV | Missense_Mutation | novel | c.284N>A | p.Arg95His | p.R95H | Q53F19 | protein_coding | deleterious(0) | probably_damaging(0.991) | TCGA-2W-A8YY-01 | Cervix | cervical & endocervical cancer | Female | <65 | I/II | Chemotherapy | cisplatin | CR |
| NCBP3 | SNV | Missense_Mutation | c.1855G>A | p.Glu619Lys | p.E619K | Q53F19 | protein_coding | deleterious_low_confidence(0.02) | benign(0.225) | TCGA-DG-A2KM-01 | Cervix | cervical & endocervical cancer | Female | <65 | I/II | Chemotherapy | cisplatin | SD | |
| NCBP3 | SNV | Missense_Mutation | novel | c.1219N>C | p.Glu407Gln | p.E407Q | Q53F19 | protein_coding | deleterious(0) | probably_damaging(0.994) | TCGA-VS-A958-01 | Cervix | cervical & endocervical cancer | Female | <65 | I/II | Chemotherapy | cisplatin | CR |
| NCBP3 | SNV | Missense_Mutation | c.853A>T | p.Asn285Tyr | p.N285Y | Q53F19 | protein_coding | deleterious(0.01) | probably_damaging(0.994) | TCGA-CK-4951-01 | Colorectum | colon adenocarcinoma | Female | >=65 | I/II | Unknown | Unknown | PD |
| Page: 1 2 3 4 5 6 |
Top |
Related drugs of malignant transformation related genes |
| Identification of chemicals and drugs interact with genes involved in malignant transfromation |
| (DGIdb 4.0) |
| Entrez ID | Symbol | Category | Interaction Types | Drug Claim Name | Drug Name | PMIDs |
| Page: 1 |

Copyright 2023-Present -The University of Texas Health Science Center at Houston |