
|
|||||
|
 | |
| |
| |
| |
| |
| |
|
Gene: NCAPH2 |
Gene summary for NCAPH2 |
| Gene information | Species | Human | Gene symbol | NCAPH2 | Gene ID | 29781 |
| Gene name | non-SMC condensin II complex subunit H2 | |
| Gene Alias | CAPH2 | |
| Cytomap | 22q13.33 | |
| Gene Type | protein-coding | GO ID | GO:0000003 | UniProtAcc | Q6IBW4 |
Top |
Malignant transformation analysis |
| Identification of the aberrant gene expression in precancerous and cancerous lesions by comparing the gene expression of stem-like cells in diseased tissues with normal stem cells |
| Entrez ID | Symbol | Replicates | Species | Organ | Tissue | Adj P-value | Log2FC | Malignancy |
| 29781 | NCAPH2 | LZE7T | Human | Esophagus | ESCC | 8.89e-04 | 2.23e-01 | 0.0667 |
| 29781 | NCAPH2 | LZE8T | Human | Esophagus | ESCC | 4.52e-02 | 6.05e-02 | 0.067 |
| 29781 | NCAPH2 | LZE22T | Human | Esophagus | ESCC | 2.53e-02 | 2.19e-01 | 0.068 |
| 29781 | NCAPH2 | LZE24T | Human | Esophagus | ESCC | 7.45e-04 | 2.18e-01 | 0.0596 |
| 29781 | NCAPH2 | LZE21T | Human | Esophagus | ESCC | 1.75e-03 | 4.09e-01 | 0.0655 |
| 29781 | NCAPH2 | LZE6T | Human | Esophagus | ESCC | 9.70e-04 | 1.59e-01 | 0.0845 |
| 29781 | NCAPH2 | P2T-E | Human | Esophagus | ESCC | 5.84e-15 | 2.99e-01 | 0.1177 |
| 29781 | NCAPH2 | P4T-E | Human | Esophagus | ESCC | 1.37e-07 | 1.68e-01 | 0.1323 |
| 29781 | NCAPH2 | P5T-E | Human | Esophagus | ESCC | 1.63e-14 | 2.79e-01 | 0.1327 |
| 29781 | NCAPH2 | P8T-E | Human | Esophagus | ESCC | 5.71e-20 | 3.75e-01 | 0.0889 |
| 29781 | NCAPH2 | P9T-E | Human | Esophagus | ESCC | 6.77e-06 | 1.48e-01 | 0.1131 |
| 29781 | NCAPH2 | P10T-E | Human | Esophagus | ESCC | 9.55e-11 | 2.69e-01 | 0.116 |
| 29781 | NCAPH2 | P11T-E | Human | Esophagus | ESCC | 3.50e-09 | 3.15e-01 | 0.1426 |
| 29781 | NCAPH2 | P12T-E | Human | Esophagus | ESCC | 1.78e-26 | 4.62e-01 | 0.1122 |
| 29781 | NCAPH2 | P15T-E | Human | Esophagus | ESCC | 4.14e-18 | 4.52e-01 | 0.1149 |
| 29781 | NCAPH2 | P16T-E | Human | Esophagus | ESCC | 3.56e-08 | 2.27e-01 | 0.1153 |
| 29781 | NCAPH2 | P17T-E | Human | Esophagus | ESCC | 1.40e-07 | 3.95e-01 | 0.1278 |
| 29781 | NCAPH2 | P19T-E | Human | Esophagus | ESCC | 5.57e-04 | 2.84e-01 | 0.1662 |
| 29781 | NCAPH2 | P20T-E | Human | Esophagus | ESCC | 6.50e-09 | 2.69e-01 | 0.1124 |
| 29781 | NCAPH2 | P21T-E | Human | Esophagus | ESCC | 2.66e-11 | 2.20e-01 | 0.1617 |
| Page: 1 2 3 4 5 |
| Tissue | Expression Dynamics | Abbreviation |
| Esophagus |  | ESCC: Esophageal squamous cell carcinoma |
| HGIN: High-grade intraepithelial neoplasias | ||
| LGIN: Low-grade intraepithelial neoplasias | ||
| Liver | 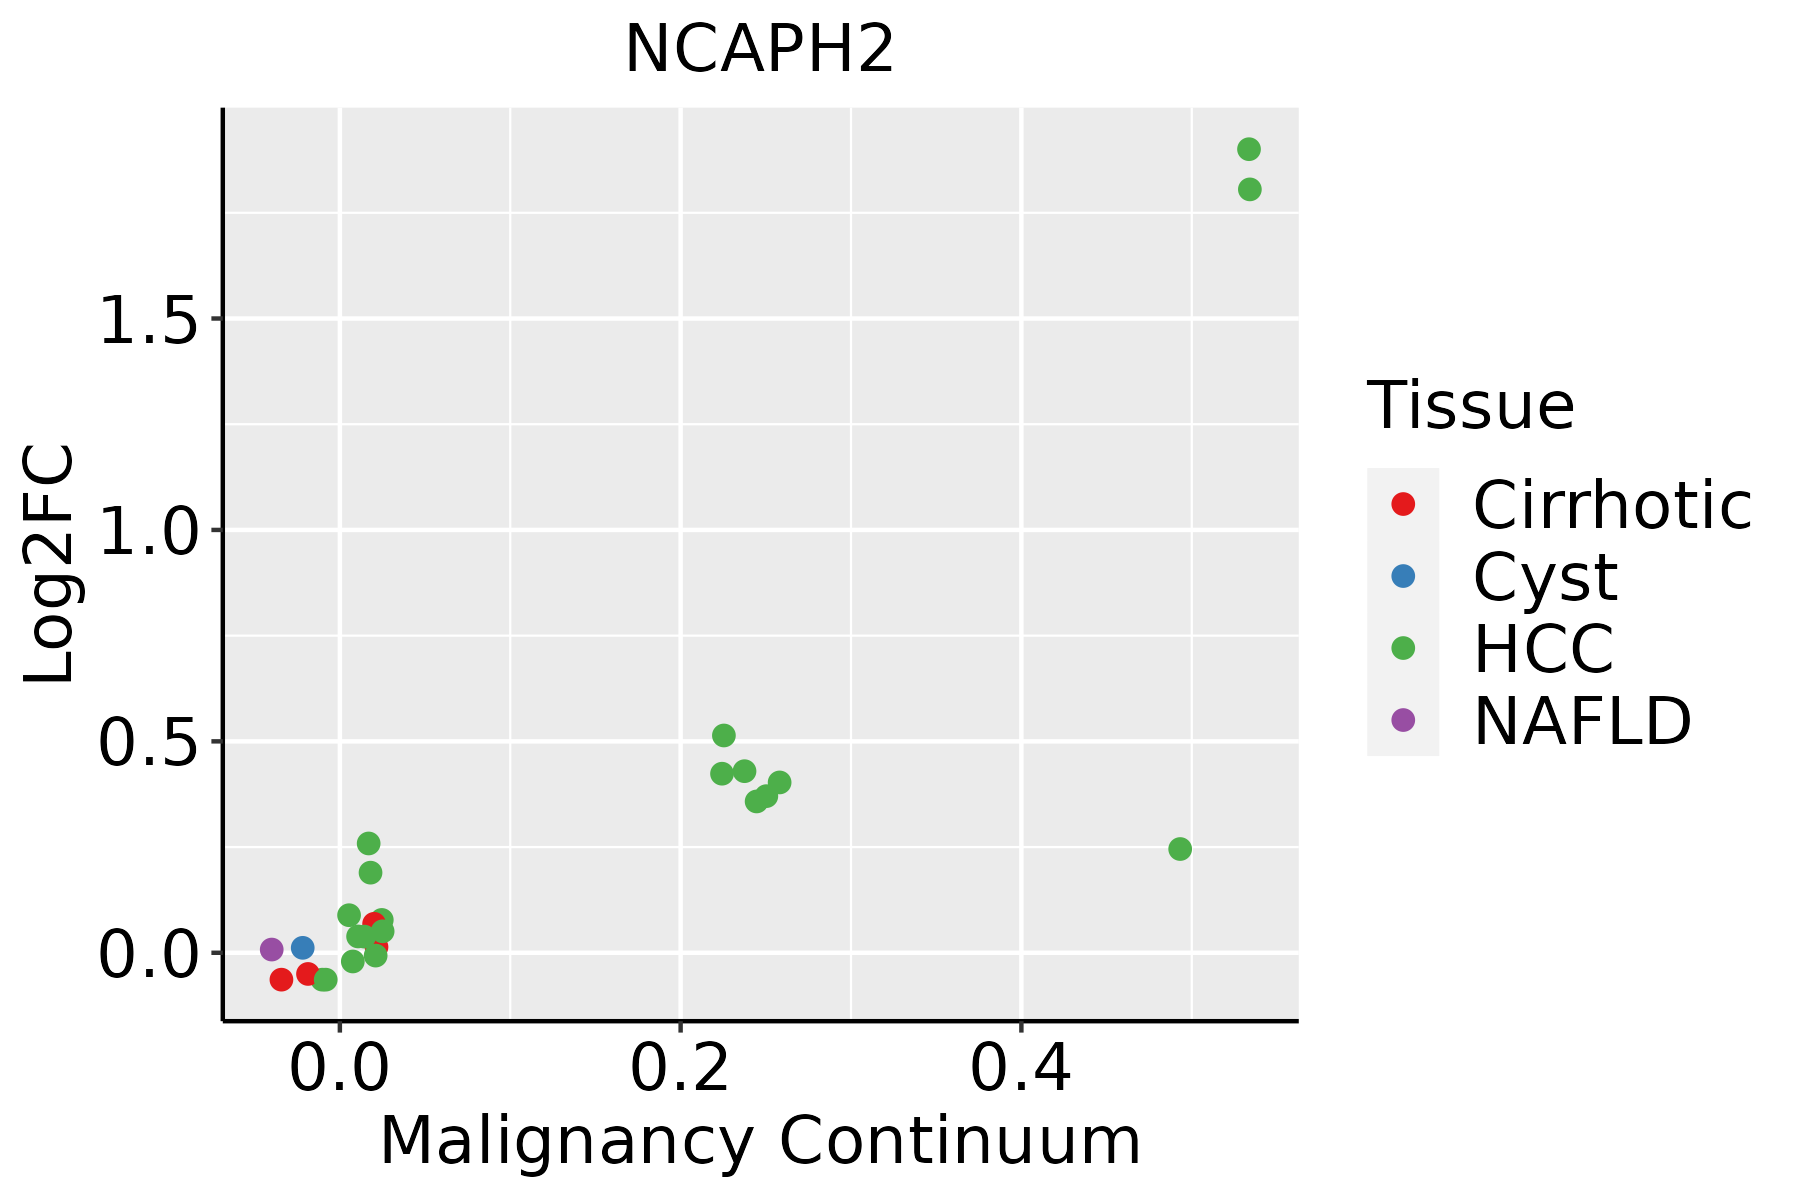 | HCC: Hepatocellular carcinoma |
| NAFLD: Non-alcoholic fatty liver disease | ||
| Oral Cavity | 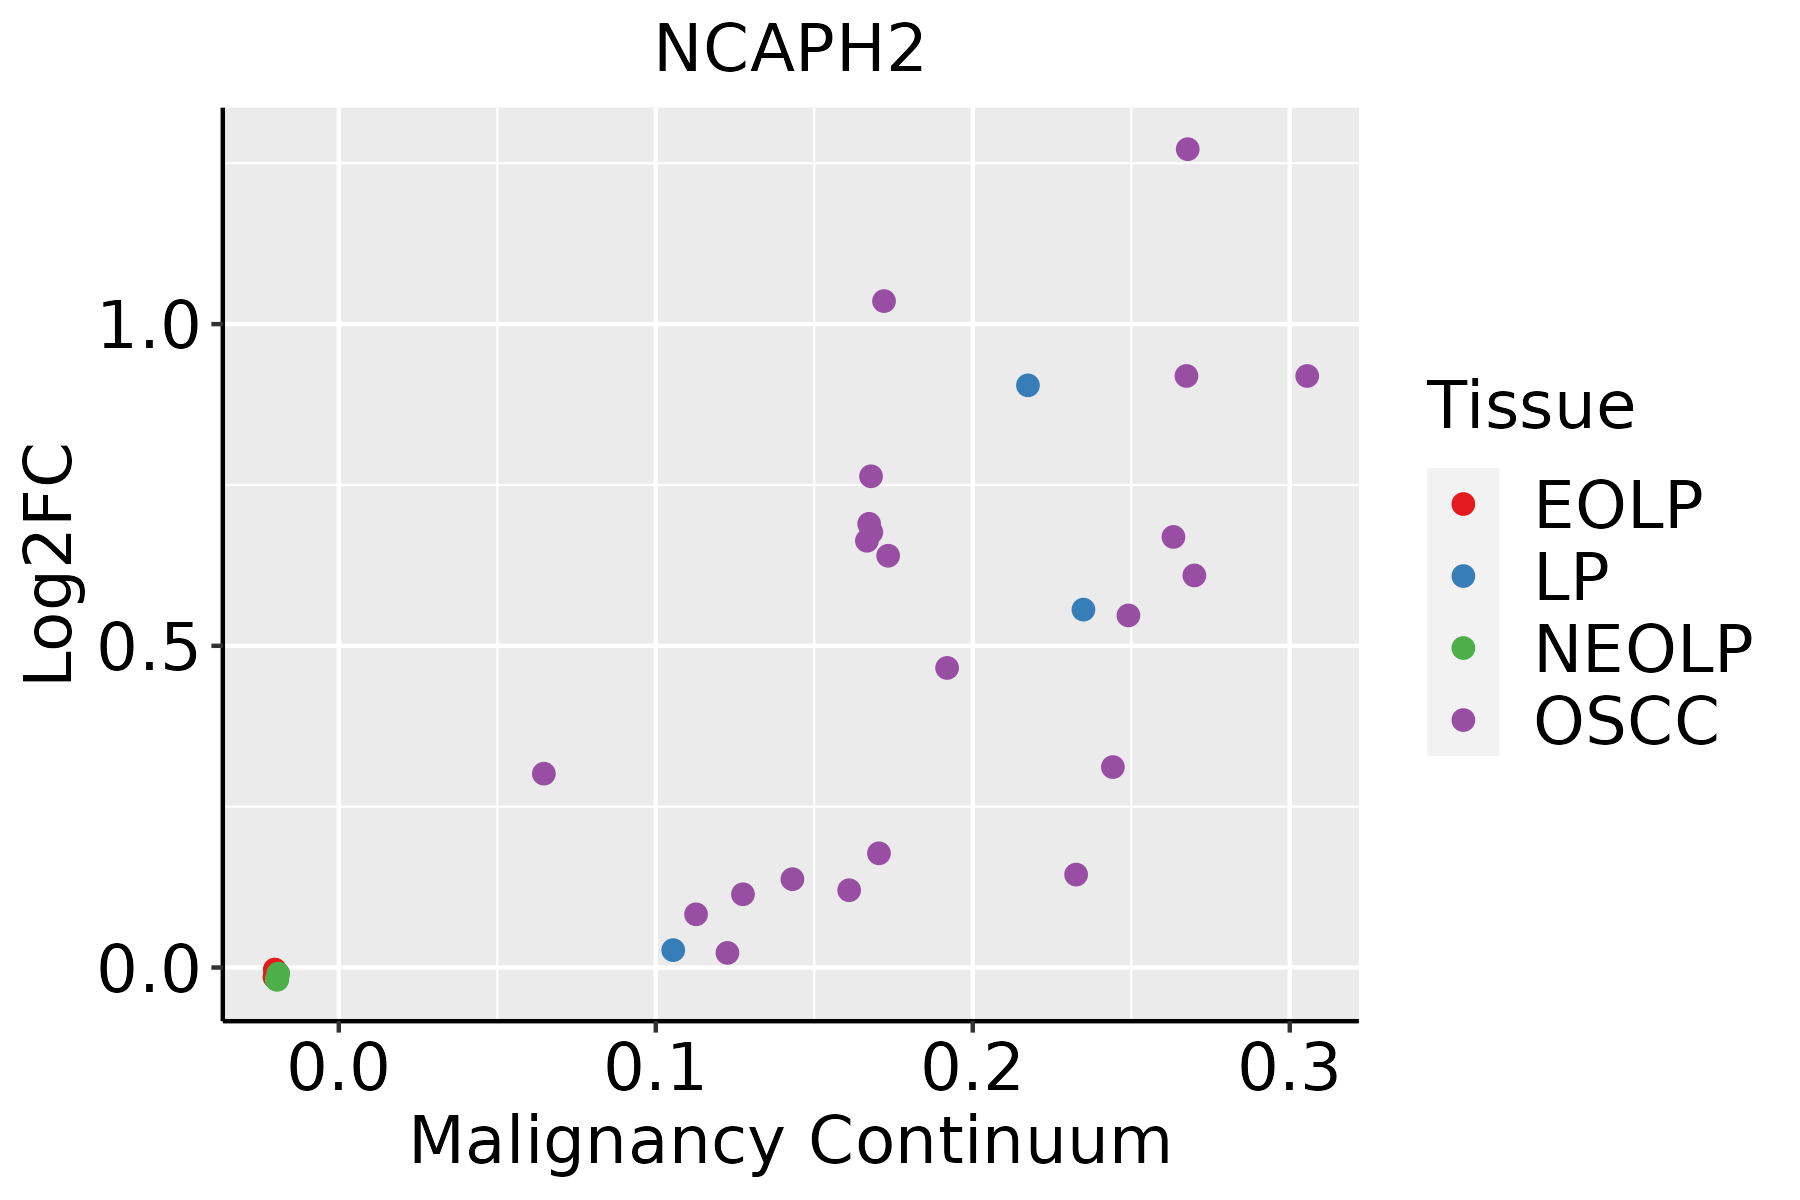 | EOLP: Erosive Oral lichen planus |
| LP: leukoplakia | ||
| NEOLP: Non-erosive oral lichen planus | ||
| OSCC: Oral squamous cell carcinoma |
| ∗log2FC in expression of this searched gene in stem-like cells from each diseased tissue sample relative to stem-like cells in normal samples in each tissue plotted against the malignancy continuum. Samples are colored based on if they are from different disease stage. |
Top |
Malignant transformation related pathway analysis |
| Find out the enriched GO biological processes and KEGG pathways involved in transition from healthy to precancer to cancer |
| Tissue | Disease Stage | Enriched GO biological Processes |
| Colorectum | AD |  |
| Colorectum | SER |  |
| Colorectum | MSS |  |
| Colorectum | MSI-H |  |
| Colorectum | FAP |  |
| ∗Top 15 enriched GO BP terms are showed in the bar plot of each disease state in each tissue. Each row represents a significant GO biological process which is colored according to the -log10(p.adjust). |
| Page: 1 2 3 4 5 6 7 8 9 |
| GO ID | Tissue | Disease Stage | Description | Gene Ratio | Bg Ratio | pvalue | p.adjust | Count |
| GO:014001414 | Esophagus | ESCC | mitotic nuclear division | 218/8552 | 287/18723 | 6.17e-26 | 1.78e-23 | 218 |
| GO:000007011 | Esophagus | ESCC | mitotic sister chromatid segregation | 138/8552 | 168/18723 | 1.37e-22 | 2.63e-20 | 138 |
| GO:00008194 | Esophagus | ESCC | sister chromatid segregation | 157/8552 | 202/18723 | 8.41e-21 | 1.33e-18 | 157 |
| GO:000705911 | Esophagus | ESCC | chromosome segregation | 238/8552 | 346/18723 | 1.72e-18 | 1.82e-16 | 238 |
| GO:00482853 | Esophagus | ESCC | organelle fission | 301/8552 | 488/18723 | 4.64e-13 | 2.12e-11 | 301 |
| GO:00988133 | Esophagus | ESCC | nuclear chromosome segregation | 187/8552 | 281/18723 | 1.00e-12 | 4.36e-11 | 187 |
| GO:00002802 | Esophagus | ESCC | nuclear division | 270/8552 | 439/18723 | 1.17e-11 | 4.24e-10 | 270 |
| GO:00513062 | Esophagus | ESCC | mitotic sister chromatid separation | 52/8552 | 67/18723 | 9.14e-08 | 1.52e-06 | 52 |
| GO:00513042 | Esophagus | ESCC | chromosome separation | 64/8552 | 96/18723 | 2.61e-05 | 2.20e-04 | 64 |
| GO:00070761 | Esophagus | ESCC | mitotic chromosome condensation | 15/8552 | 17/18723 | 3.48e-04 | 2.03e-03 | 15 |
| GO:004211018 | Esophagus | ESCC | T cell activation | 256/8552 | 487/18723 | 1.18e-03 | 5.87e-03 | 256 |
| GO:19031317 | Esophagus | ESCC | mononuclear cell differentiation | 226/8552 | 426/18723 | 1.20e-03 | 5.88e-03 | 226 |
| GO:00302176 | Esophagus | ESCC | T cell differentiation | 137/8552 | 257/18723 | 8.09e-03 | 2.87e-02 | 137 |
| GO:00300984 | Esophagus | ESCC | lymphocyte differentiation | 192/8552 | 374/18723 | 1.52e-02 | 4.93e-02 | 192 |
| GO:014001411 | Liver | HCC | mitotic nuclear division | 174/7958 | 287/18723 | 3.74e-10 | 1.23e-08 | 174 |
| GO:0000070 | Liver | HCC | mitotic sister chromatid segregation | 110/7958 | 168/18723 | 1.42e-09 | 4.25e-08 | 110 |
| GO:00008191 | Liver | HCC | sister chromatid segregation | 128/7958 | 202/18723 | 1.59e-09 | 4.73e-08 | 128 |
| GO:0007059 | Liver | HCC | chromosome segregation | 197/7958 | 346/18723 | 3.57e-08 | 7.87e-07 | 197 |
| GO:0098813 | Liver | HCC | nuclear chromosome segregation | 157/7958 | 281/18723 | 3.82e-06 | 4.95e-05 | 157 |
| GO:0048285 | Liver | HCC | organelle fission | 254/7958 | 488/18723 | 1.07e-05 | 1.23e-04 | 254 |
| Page: 1 2 3 |
| Pathway ID | Tissue | Disease Stage | Description | Gene Ratio | Bg Ratio | pvalue | p.adjust | qvalue | Count |
| Page: 1 |
Top |
Cell-cell communication analysis |
| Identification of potential cell-cell interactions between two cell types and their ligand-receptor pairs for different disease states |
| Ligand | Receptor | LRpair | Pathway | Tissue | Disease Stage |
| Page: 1 |
Top |
Single-cell gene regulatory network inference analysis |
| Find out the significant the regulons (TFs) and the target genes of each regulon across cell types for different disease states |
| TF | Cell Type | Tissue | Disease Stage | Target Gene | RSS | Regulon Activity |
| ∗The dot plots of a searched regulon are shown for all cell subpopulations in each disease state of each tissue based on the regulon specific score inferred using pySCENIC and by calculating the average expression. |
| Page: 1 |
Top |
Somatic mutation of malignant transformation related genes |
| Annotation of somatic variants for genes involved in malignant transformation |
| Hugo Symbol | Variant Class | Variant Classification | dbSNP RS | HGVSc | HGVSp | HGVSp Short | SWISSPROT | BIOTYPE | SIFT | PolyPhen | Tumor Sample Barcode | Tissue | Histology | Sex | Age | Stage | Therapy Types | Drugs | Outcome |
| NCAPH2 | SNV | Missense_Mutation | c.1033N>A | p.Glu345Lys | p.E345K | Q6IBW4 | protein_coding | tolerated(0.13) | probably_damaging(0.994) | TCGA-AC-A23H-01 | Breast | breast invasive carcinoma | Female | >=65 | I/II | Unknown | Unknown | PD | |
| NCAPH2 | SNV | Missense_Mutation | rs567035246 | c.1484G>A | p.Arg495His | p.R495H | Q6IBW4 | protein_coding | tolerated(0.13) | benign(0.042) | TCGA-BH-A18P-01 | Breast | breast invasive carcinoma | Female | <65 | I/II | Unknown | Unknown | PD |
| NCAPH2 | SNV | Missense_Mutation | c.754N>T | p.Pro252Ser | p.P252S | Q6IBW4 | protein_coding | tolerated(0.14) | benign(0.027) | TCGA-C8-A1HJ-01 | Breast | breast invasive carcinoma | Female | <65 | I/II | Unknown | Unknown | SD | |
| NCAPH2 | deletion | Frame_Shift_Del | novel | c.390delC | p.Asn130LysfsTer52 | p.N130Kfs*52 | Q6IBW4 | protein_coding | TCGA-D8-A27V-01 | Breast | breast invasive carcinoma | Female | <65 | I/II | Hormone Therapy | tamoxiphen | SD | ||
| NCAPH2 | SNV | Missense_Mutation | novel | c.241N>A | p.Ala81Thr | p.A81T | Q6IBW4 | protein_coding | tolerated(0.34) | possibly_damaging(0.856) | TCGA-2W-A8YY-01 | Cervix | cervical & endocervical cancer | Female | <65 | I/II | Chemotherapy | cisplatin | CR |
| NCAPH2 | SNV | Missense_Mutation | novel | c.1580N>T | p.Ser527Leu | p.S527L | Q6IBW4 | protein_coding | deleterious(0) | possibly_damaging(0.536) | TCGA-C5-A1BQ-01 | Cervix | cervical & endocervical cancer | Female | >=65 | III/IV | Chemotherapy | cisplatin | CR |
| NCAPH2 | SNV | Missense_Mutation | c.1039N>G | p.Leu347Val | p.L347V | Q6IBW4 | protein_coding | tolerated(1) | benign(0.022) | TCGA-C5-A1MK-01 | Cervix | cervical & endocervical cancer | Female | >=65 | III/IV | Chemotherapy | carboplatin | PD | |
| NCAPH2 | SNV | Missense_Mutation | c.805N>C | p.Glu269Gln | p.E269Q | Q6IBW4 | protein_coding | tolerated(0.43) | probably_damaging(0.997) | TCGA-DR-A0ZM-01 | Cervix | cervical & endocervical cancer | Female | <65 | III/IV | Unspecific | Cisplatin | SD | |
| NCAPH2 | SNV | Missense_Mutation | c.302N>A | p.Arg101Lys | p.R101K | Q6IBW4 | protein_coding | tolerated(0.12) | benign(0.153) | TCGA-EA-A43B-01 | Cervix | cervical & endocervical cancer | Female | <65 | I/II | Chemotherapy | cisplatin | CR | |
| NCAPH2 | SNV | Missense_Mutation | rs748497607 | c.136G>A | p.Glu46Lys | p.E46K | Q6IBW4 | protein_coding | tolerated(0.35) | benign(0.011) | TCGA-FU-A3HZ-01 | Cervix | cervical & endocervical cancer | Female | <65 | I/II | Chemotherapy | cisplatin | CR |
| Page: 1 2 3 4 5 |
Top |
Related drugs of malignant transformation related genes |
| Identification of chemicals and drugs interact with genes involved in malignant transfromation |
| (DGIdb 4.0) |
| Entrez ID | Symbol | Category | Interaction Types | Drug Claim Name | Drug Name | PMIDs |
| Page: 1 |

Copyright 2023-Present -The University of Texas Health Science Center at Houston |