
|
|||||
|
 | |
| |
| |
| |
| |
| |
|
Gene: NCAPG2 |
Gene summary for NCAPG2 |
| Gene information | Species | Human | Gene symbol | NCAPG2 | Gene ID | 54892 |
| Gene name | non-SMC condensin II complex subunit G2 | |
| Gene Alias | 3KS | |
| Cytomap | 7q36.3 | |
| Gene Type | protein-coding | GO ID | GO:0000070 | UniProtAcc | B3KRQ2 |
Top |
Malignant transformation analysis |
| Identification of the aberrant gene expression in precancerous and cancerous lesions by comparing the gene expression of stem-like cells in diseased tissues with normal stem cells |
| Entrez ID | Symbol | Replicates | Species | Organ | Tissue | Adj P-value | Log2FC | Malignancy |
| 54892 | NCAPG2 | LZE2T | Human | Esophagus | ESCC | 1.30e-02 | 4.92e-01 | 0.082 |
| 54892 | NCAPG2 | LZE7T | Human | Esophagus | ESCC | 1.88e-02 | 1.55e-01 | 0.0667 |
| 54892 | NCAPG2 | LZE22T | Human | Esophagus | ESCC | 9.85e-03 | 2.86e-01 | 0.068 |
| 54892 | NCAPG2 | LZE24T | Human | Esophagus | ESCC | 1.64e-05 | 1.69e-01 | 0.0596 |
| 54892 | NCAPG2 | LZE6T | Human | Esophagus | ESCC | 6.73e-03 | 1.98e-01 | 0.0845 |
| 54892 | NCAPG2 | P2T-E | Human | Esophagus | ESCC | 2.98e-07 | 1.72e-01 | 0.1177 |
| 54892 | NCAPG2 | P4T-E | Human | Esophagus | ESCC | 2.90e-05 | 1.81e-01 | 0.1323 |
| 54892 | NCAPG2 | P5T-E | Human | Esophagus | ESCC | 1.12e-06 | 1.90e-01 | 0.1327 |
| 54892 | NCAPG2 | P10T-E | Human | Esophagus | ESCC | 4.95e-03 | 1.39e-01 | 0.116 |
| 54892 | NCAPG2 | P12T-E | Human | Esophagus | ESCC | 8.50e-04 | 1.34e-01 | 0.1122 |
| 54892 | NCAPG2 | P15T-E | Human | Esophagus | ESCC | 9.46e-11 | 2.93e-01 | 0.1149 |
| 54892 | NCAPG2 | P21T-E | Human | Esophagus | ESCC | 7.33e-11 | 3.17e-01 | 0.1617 |
| 54892 | NCAPG2 | P24T-E | Human | Esophagus | ESCC | 6.44e-07 | 1.89e-01 | 0.1287 |
| 54892 | NCAPG2 | P26T-E | Human | Esophagus | ESCC | 8.26e-05 | 1.31e-01 | 0.1276 |
| 54892 | NCAPG2 | P28T-E | Human | Esophagus | ESCC | 4.15e-06 | 1.75e-01 | 0.1149 |
| 54892 | NCAPG2 | P30T-E | Human | Esophagus | ESCC | 5.37e-04 | 3.09e-01 | 0.137 |
| 54892 | NCAPG2 | P31T-E | Human | Esophagus | ESCC | 7.92e-05 | 1.74e-01 | 0.1251 |
| 54892 | NCAPG2 | P32T-E | Human | Esophagus | ESCC | 1.57e-11 | 3.33e-01 | 0.1666 |
| 54892 | NCAPG2 | P37T-E | Human | Esophagus | ESCC | 7.41e-08 | 2.29e-01 | 0.1371 |
| 54892 | NCAPG2 | P48T-E | Human | Esophagus | ESCC | 9.26e-03 | 8.79e-02 | 0.0959 |
| Page: 1 2 3 |
| Tissue | Expression Dynamics | Abbreviation |
| Esophagus | 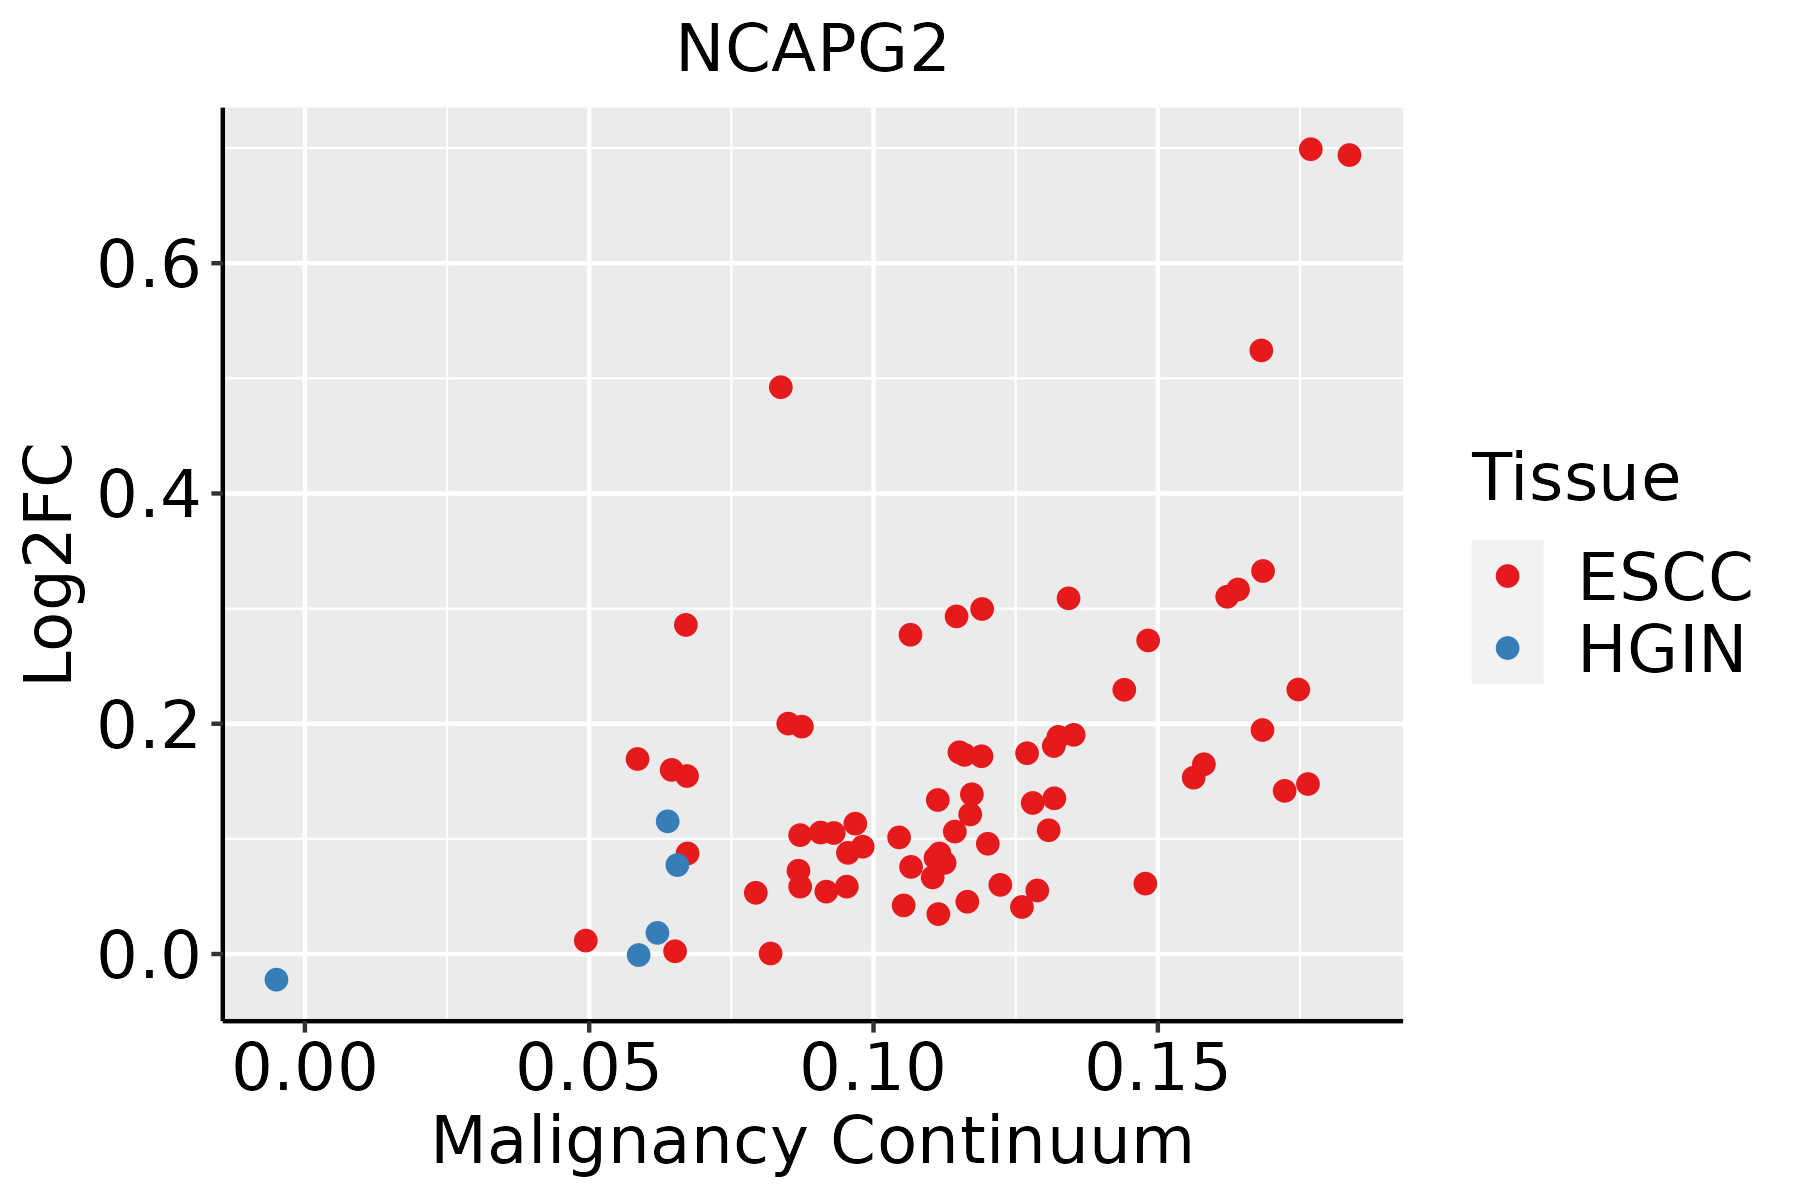 | ESCC: Esophageal squamous cell carcinoma |
| HGIN: High-grade intraepithelial neoplasias | ||
| LGIN: Low-grade intraepithelial neoplasias | ||
| Liver |  | HCC: Hepatocellular carcinoma |
| NAFLD: Non-alcoholic fatty liver disease | ||
| Skin |  | AK: Actinic keratosis |
| cSCC: Cutaneous squamous cell carcinoma | ||
| SCCIS:squamous cell carcinoma in situ | ||
| Thyroid |  | ATC: Anaplastic thyroid cancer |
| HT: Hashimoto's thyroiditis | ||
| PTC: Papillary thyroid cancer |
| ∗log2FC in expression of this searched gene in stem-like cells from each diseased tissue sample relative to stem-like cells in normal samples in each tissue plotted against the malignancy continuum. Samples are colored based on if they are from different disease stage. |
Top |
Malignant transformation related pathway analysis |
| Find out the enriched GO biological processes and KEGG pathways involved in transition from healthy to precancer to cancer |
| Tissue | Disease Stage | Enriched GO biological Processes |
| Colorectum | AD |  |
| Colorectum | SER |  |
| Colorectum | MSS |  |
| Colorectum | MSI-H |  |
| Colorectum | FAP |  |
| ∗Top 15 enriched GO BP terms are showed in the bar plot of each disease state in each tissue. Each row represents a significant GO biological process which is colored according to the -log10(p.adjust). |
| Page: 1 2 3 4 5 6 7 8 9 |
| GO ID | Tissue | Disease Stage | Description | Gene Ratio | Bg Ratio | pvalue | p.adjust | Count |
| GO:001657015 | Esophagus | ESCC | histone modification | 323/8552 | 463/18723 | 2.61e-26 | 7.88e-24 | 323 |
| GO:014001414 | Esophagus | ESCC | mitotic nuclear division | 218/8552 | 287/18723 | 6.17e-26 | 1.78e-23 | 218 |
| GO:000007011 | Esophagus | ESCC | mitotic sister chromatid segregation | 138/8552 | 168/18723 | 1.37e-22 | 2.63e-20 | 138 |
| GO:00008194 | Esophagus | ESCC | sister chromatid segregation | 157/8552 | 202/18723 | 8.41e-21 | 1.33e-18 | 157 |
| GO:000705911 | Esophagus | ESCC | chromosome segregation | 238/8552 | 346/18723 | 1.72e-18 | 1.82e-16 | 238 |
| GO:000170119 | Esophagus | ESCC | in utero embryonic development | 243/8552 | 367/18723 | 1.00e-15 | 6.86e-14 | 243 |
| GO:00482853 | Esophagus | ESCC | organelle fission | 301/8552 | 488/18723 | 4.64e-13 | 2.12e-11 | 301 |
| GO:00988133 | Esophagus | ESCC | nuclear chromosome segregation | 187/8552 | 281/18723 | 1.00e-12 | 4.36e-11 | 187 |
| GO:0010563111 | Esophagus | ESCC | negative regulation of phosphorus metabolic process | 274/8552 | 442/18723 | 2.32e-12 | 9.41e-11 | 274 |
| GO:0045936111 | Esophagus | ESCC | negative regulation of phosphate metabolic process | 273/8552 | 441/18723 | 3.18e-12 | 1.25e-10 | 273 |
| GO:0051348111 | Esophagus | ESCC | negative regulation of transferase activity | 177/8552 | 268/18723 | 1.08e-11 | 4.00e-10 | 177 |
| GO:00002802 | Esophagus | ESCC | nuclear division | 270/8552 | 439/18723 | 1.17e-11 | 4.24e-10 | 270 |
| GO:0042326111 | Esophagus | ESCC | negative regulation of phosphorylation | 237/8552 | 385/18723 | 1.86e-10 | 5.33e-09 | 237 |
| GO:0001933111 | Esophagus | ESCC | negative regulation of protein phosphorylation | 213/8552 | 342/18723 | 3.54e-10 | 9.76e-09 | 213 |
| GO:0030099111 | Esophagus | ESCC | myeloid cell differentiation | 232/8552 | 381/18723 | 1.22e-09 | 2.90e-08 | 232 |
| GO:003367319 | Esophagus | ESCC | negative regulation of kinase activity | 154/8552 | 237/18723 | 1.38e-09 | 3.27e-08 | 154 |
| GO:003105614 | Esophagus | ESCC | regulation of histone modification | 106/8552 | 152/18723 | 1.52e-09 | 3.55e-08 | 106 |
| GO:000646920 | Esophagus | ESCC | negative regulation of protein kinase activity | 140/8552 | 212/18723 | 1.53e-09 | 3.56e-08 | 140 |
| GO:00356015 | Esophagus | ESCC | protein deacylation | 79/8552 | 112/18723 | 8.30e-08 | 1.42e-06 | 79 |
| GO:0002262111 | Esophagus | ESCC | myeloid cell homeostasis | 104/8552 | 157/18723 | 1.49e-07 | 2.36e-06 | 104 |
| Page: 1 2 3 4 5 6 7 |
| Pathway ID | Tissue | Disease Stage | Description | Gene Ratio | Bg Ratio | pvalue | p.adjust | qvalue | Count |
| Page: 1 |
Top |
Cell-cell communication analysis |
| Identification of potential cell-cell interactions between two cell types and their ligand-receptor pairs for different disease states |
| Ligand | Receptor | LRpair | Pathway | Tissue | Disease Stage |
| Page: 1 |
Top |
Single-cell gene regulatory network inference analysis |
| Find out the significant the regulons (TFs) and the target genes of each regulon across cell types for different disease states |
| TF | Cell Type | Tissue | Disease Stage | Target Gene | RSS | Regulon Activity |
| ∗The dot plots of a searched regulon are shown for all cell subpopulations in each disease state of each tissue based on the regulon specific score inferred using pySCENIC and by calculating the average expression. |
| Page: 1 |
Top |
Somatic mutation of malignant transformation related genes |
| Annotation of somatic variants for genes involved in malignant transformation |
| Hugo Symbol | Variant Class | Variant Classification | dbSNP RS | HGVSc | HGVSp | HGVSp Short | SWISSPROT | BIOTYPE | SIFT | PolyPhen | Tumor Sample Barcode | Tissue | Histology | Sex | Age | Stage | Therapy Types | Drugs | Outcome |
| NCAPG2 | SNV | Missense_Mutation | c.2170N>A | p.Glu724Lys | p.E724K | Q86XI2 | protein_coding | deleterious(0) | probably_damaging(0.956) | TCGA-A2-A04W-01 | Breast | breast invasive carcinoma | Female | <65 | I/II | Chemotherapy | cytoxan | SD | |
| NCAPG2 | SNV | Missense_Mutation | c.2542N>A | p.Glu848Lys | p.E848K | Q86XI2 | protein_coding | tolerated(0.27) | benign(0.057) | TCGA-AC-A23H-01 | Breast | breast invasive carcinoma | Female | >=65 | I/II | Unknown | Unknown | PD | |
| NCAPG2 | SNV | Missense_Mutation | novel | c.1678G>A | p.Glu560Lys | p.E560K | Q86XI2 | protein_coding | tolerated(0.43) | benign(0.045) | TCGA-AN-A046-01 | Breast | breast invasive carcinoma | Female | >=65 | I/II | Unknown | Unknown | SD |
| NCAPG2 | insertion | Frame_Shift_Ins | novel | c.2709_2710insTGGATTGGGCTAGTGGCTATTTCCTGGCATCTGTGTGGGAAACCAT | p.Gln904TrpfsTer39 | p.Q904Wfs*39 | Q86XI2 | protein_coding | TCGA-A8-A07Z-01 | Breast | breast invasive carcinoma | Female | >=65 | I/II | Unspecific | Exemestane | SD | ||
| NCAPG2 | SNV | Missense_Mutation | rs370630902 | c.1997G>A | p.Arg666His | p.R666H | Q86XI2 | protein_coding | deleterious(0.01) | probably_damaging(0.995) | TCGA-2W-A8YY-01 | Cervix | cervical & endocervical cancer | Female | <65 | I/II | Chemotherapy | cisplatin | CR |
| NCAPG2 | SNV | Missense_Mutation | rs371198970 | c.563G>A | p.Arg188His | p.R188H | Q86XI2 | protein_coding | tolerated(0.31) | benign(0) | TCGA-2W-A8YY-01 | Cervix | cervical & endocervical cancer | Female | <65 | I/II | Chemotherapy | cisplatin | CR |
| NCAPG2 | SNV | Missense_Mutation | rs374235532 | c.1595N>T | p.Pro532Leu | p.P532L | Q86XI2 | protein_coding | deleterious(0) | probably_damaging(0.937) | TCGA-AA-3811-01 | Colorectum | colon adenocarcinoma | Female | >=65 | III/IV | Unknown | Unknown | PD |
| NCAPG2 | SNV | Missense_Mutation | rs377006246 | c.2899C>T | p.Arg967Trp | p.R967W | Q86XI2 | protein_coding | tolerated(0.16) | benign(0.003) | TCGA-AA-3867-01 | Colorectum | colon adenocarcinoma | Male | >=65 | III/IV | Unknown | Unknown | PD |
| NCAPG2 | SNV | Missense_Mutation | rs199662183 | c.1415C>T | p.Ser472Leu | p.S472L | Q86XI2 | protein_coding | deleterious(0) | possibly_damaging(0.867) | TCGA-AA-3984-01 | Colorectum | colon adenocarcinoma | Female | <65 | I/II | Unknown | Unknown | SD |
| NCAPG2 | SNV | Missense_Mutation | novel | c.275G>A | p.Ser92Asn | p.S92N | Q86XI2 | protein_coding | tolerated(0.29) | benign(0) | TCGA-AA-3984-01 | Colorectum | colon adenocarcinoma | Female | <65 | I/II | Unknown | Unknown | SD |
| Page: 1 2 3 4 5 6 7 8 9 10 |
Top |
Related drugs of malignant transformation related genes |
| Identification of chemicals and drugs interact with genes involved in malignant transfromation |
| (DGIdb 4.0) |
| Entrez ID | Symbol | Category | Interaction Types | Drug Claim Name | Drug Name | PMIDs |
| Page: 1 |

Copyright 2023-Present -The University of Texas Health Science Center at Houston |