
|
|||||
|
 | |
| |
| |
| |
| |
| |
|
Gene: NCAPG |
Gene summary for NCAPG |
| Gene information | Species | Human | Gene symbol | NCAPG | Gene ID | 64151 |
| Gene name | non-SMC condensin I complex subunit G | |
| Gene Alias | CAPG | |
| Cytomap | 4p15.31 | |
| Gene Type | protein-coding | GO ID | GO:0000070 | UniProtAcc | Q9BPX3 |
Top |
Malignant transformation analysis |
| Identification of the aberrant gene expression in precancerous and cancerous lesions by comparing the gene expression of stem-like cells in diseased tissues with normal stem cells |
| Entrez ID | Symbol | Replicates | Species | Organ | Tissue | Adj P-value | Log2FC | Malignancy |
| 64151 | NCAPG | LZE6T | Human | Esophagus | ESCC | 2.97e-05 | 2.41e-01 | 0.0845 |
| 64151 | NCAPG | P2T-E | Human | Esophagus | ESCC | 1.28e-06 | 3.54e-01 | 0.1177 |
| 64151 | NCAPG | P5T-E | Human | Esophagus | ESCC | 1.84e-06 | 1.72e-01 | 0.1327 |
| 64151 | NCAPG | P10T-E | Human | Esophagus | ESCC | 1.61e-03 | 1.47e-01 | 0.116 |
| 64151 | NCAPG | P24T-E | Human | Esophagus | ESCC | 3.04e-03 | 1.82e-01 | 0.1287 |
| 64151 | NCAPG | P28T-E | Human | Esophagus | ESCC | 5.13e-03 | 1.03e-01 | 0.1149 |
| 64151 | NCAPG | P31T-E | Human | Esophagus | ESCC | 3.58e-05 | 1.82e-01 | 0.1251 |
| 64151 | NCAPG | P32T-E | Human | Esophagus | ESCC | 3.60e-09 | 3.01e-01 | 0.1666 |
| 64151 | NCAPG | P36T-E | Human | Esophagus | ESCC | 1.70e-02 | 2.55e-01 | 0.1187 |
| 64151 | NCAPG | P37T-E | Human | Esophagus | ESCC | 2.81e-04 | 1.45e-01 | 0.1371 |
| 64151 | NCAPG | P52T-E | Human | Esophagus | ESCC | 8.80e-05 | 1.92e-01 | 0.1555 |
| 64151 | NCAPG | P74T-E | Human | Esophagus | ESCC | 1.66e-02 | 1.50e-01 | 0.1479 |
| 64151 | NCAPG | P76T-E | Human | Esophagus | ESCC | 6.61e-06 | 2.29e-01 | 0.1207 |
| 64151 | NCAPG | P79T-E | Human | Esophagus | ESCC | 3.43e-02 | 1.81e-01 | 0.1154 |
| 64151 | NCAPG | P83T-E | Human | Esophagus | ESCC | 1.07e-08 | 3.41e-01 | 0.1738 |
| 64151 | NCAPG | P89T-E | Human | Esophagus | ESCC | 4.68e-04 | 4.50e-01 | 0.1752 |
| 64151 | NCAPG | P91T-E | Human | Esophagus | ESCC | 2.10e-06 | 8.27e-01 | 0.1828 |
| 64151 | NCAPG | P107T-E | Human | Esophagus | ESCC | 2.23e-12 | 4.98e-01 | 0.171 |
| 64151 | NCAPG | P130T-E | Human | Esophagus | ESCC | 2.32e-16 | 5.59e-01 | 0.1676 |
| 64151 | NCAPG | HCC1_Meng | Human | Liver | HCC | 2.09e-11 | 5.50e-02 | 0.0246 |
| Page: 1 2 |
| Tissue | Expression Dynamics | Abbreviation |
| Esophagus | 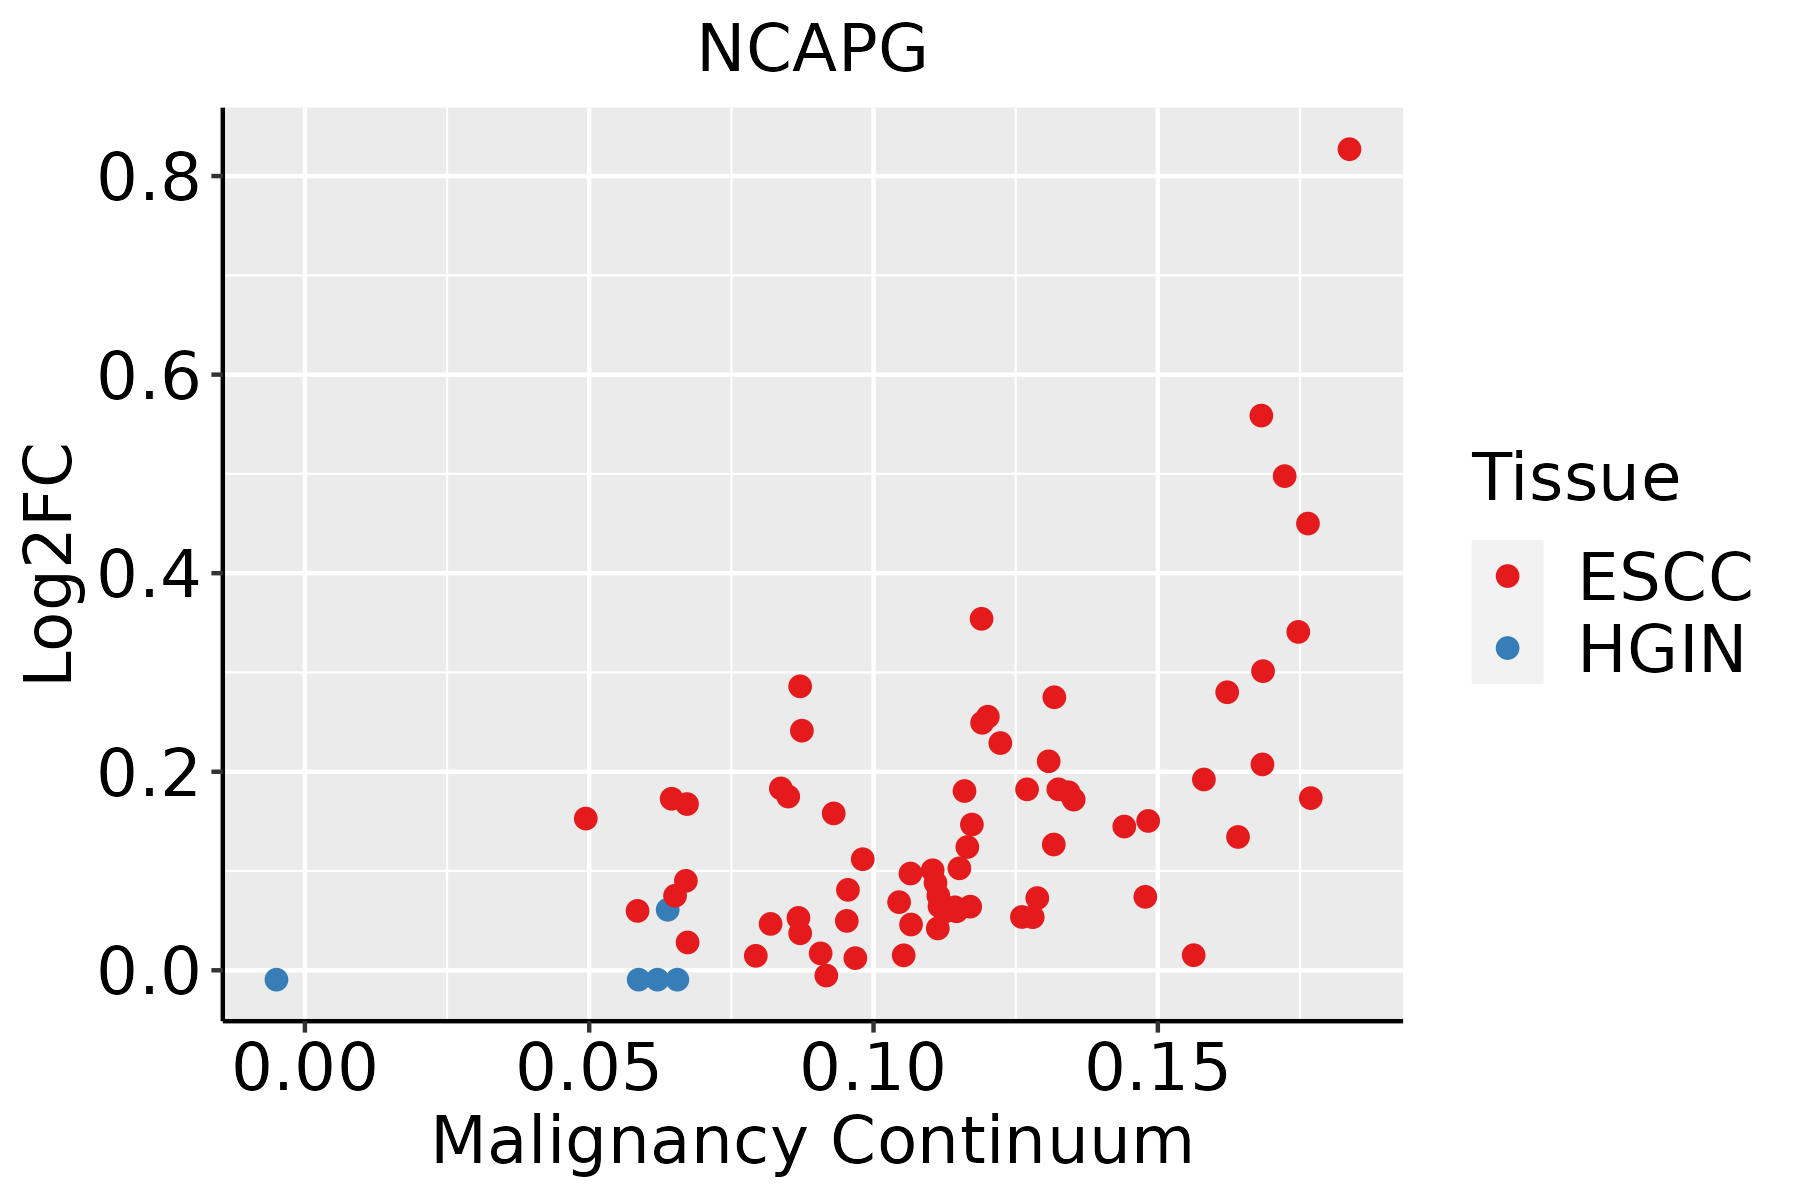 | ESCC: Esophageal squamous cell carcinoma |
| HGIN: High-grade intraepithelial neoplasias | ||
| LGIN: Low-grade intraepithelial neoplasias | ||
| Liver |  | HCC: Hepatocellular carcinoma |
| NAFLD: Non-alcoholic fatty liver disease | ||
| Skin | 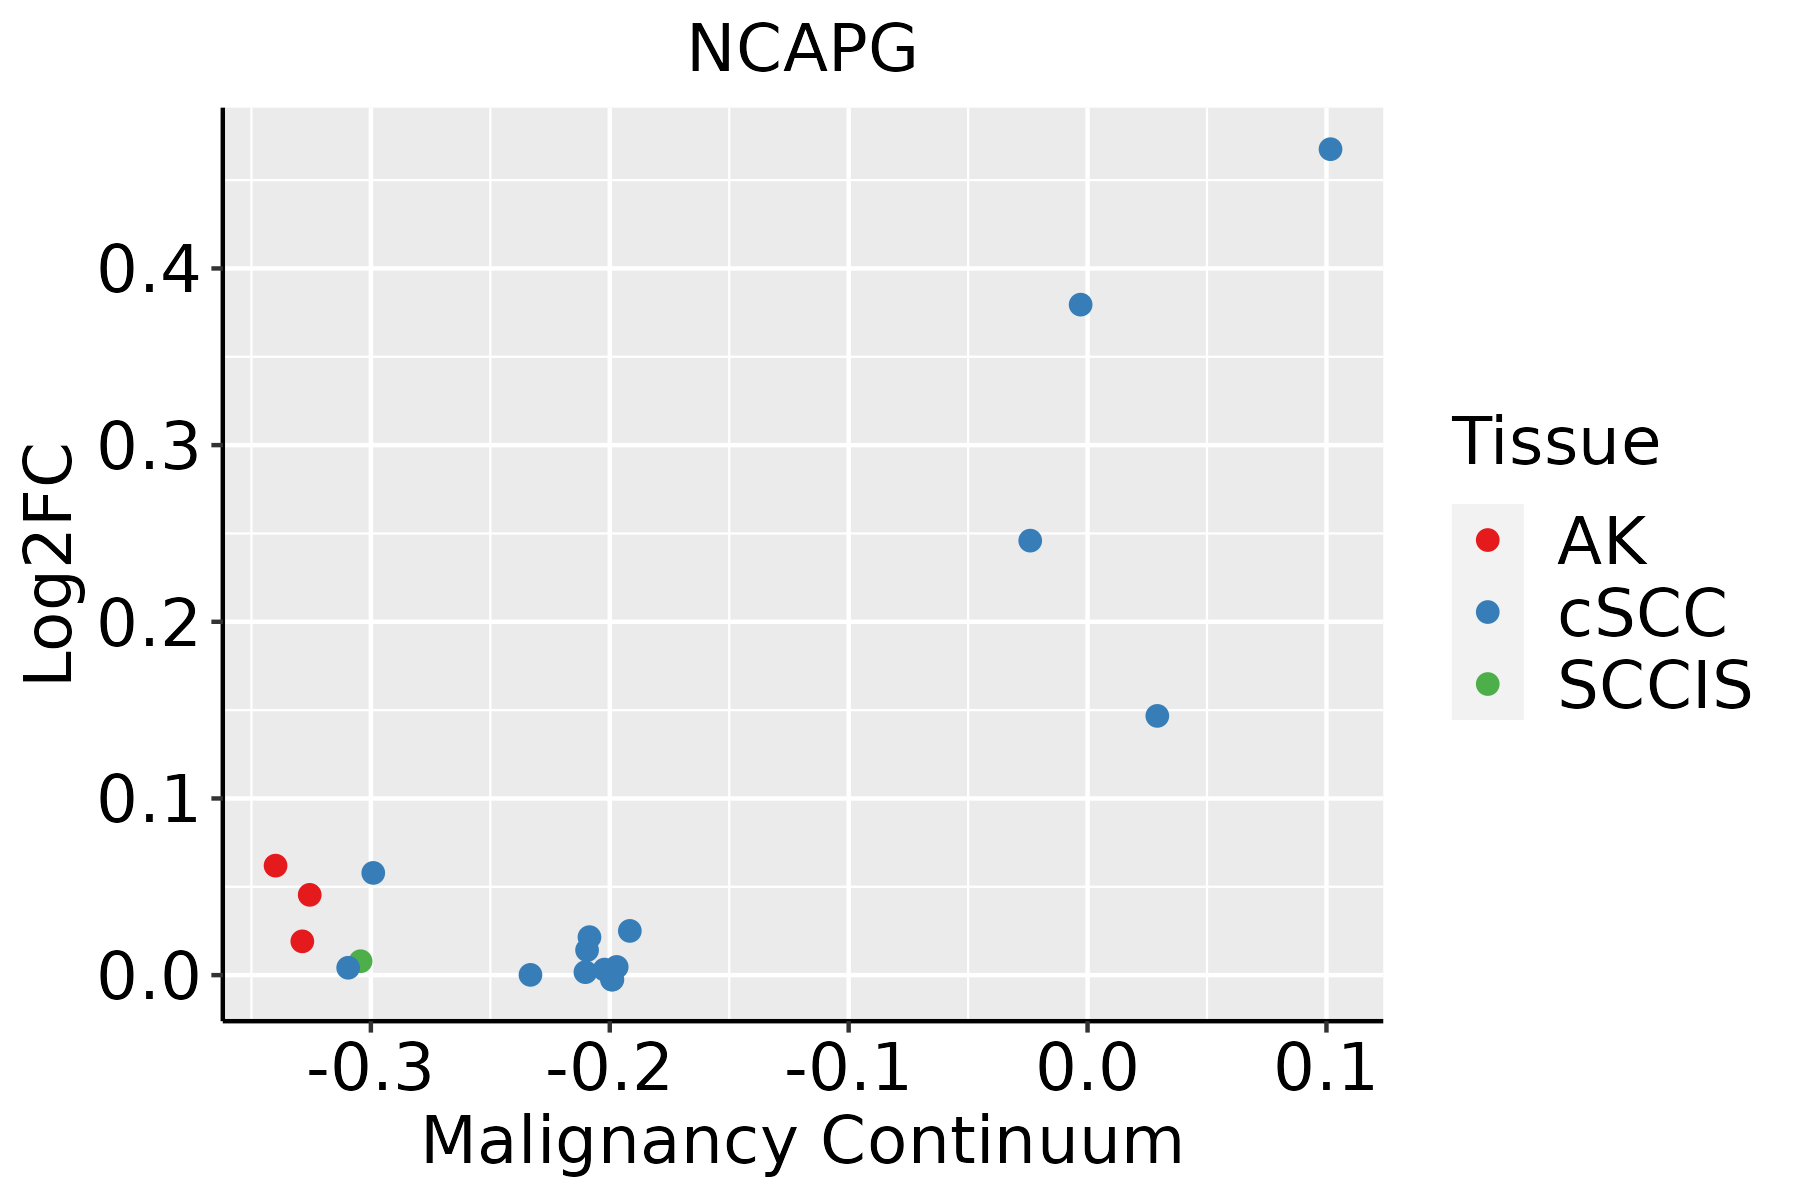 | AK: Actinic keratosis |
| cSCC: Cutaneous squamous cell carcinoma | ||
| SCCIS:squamous cell carcinoma in situ | ||
| Thyroid | 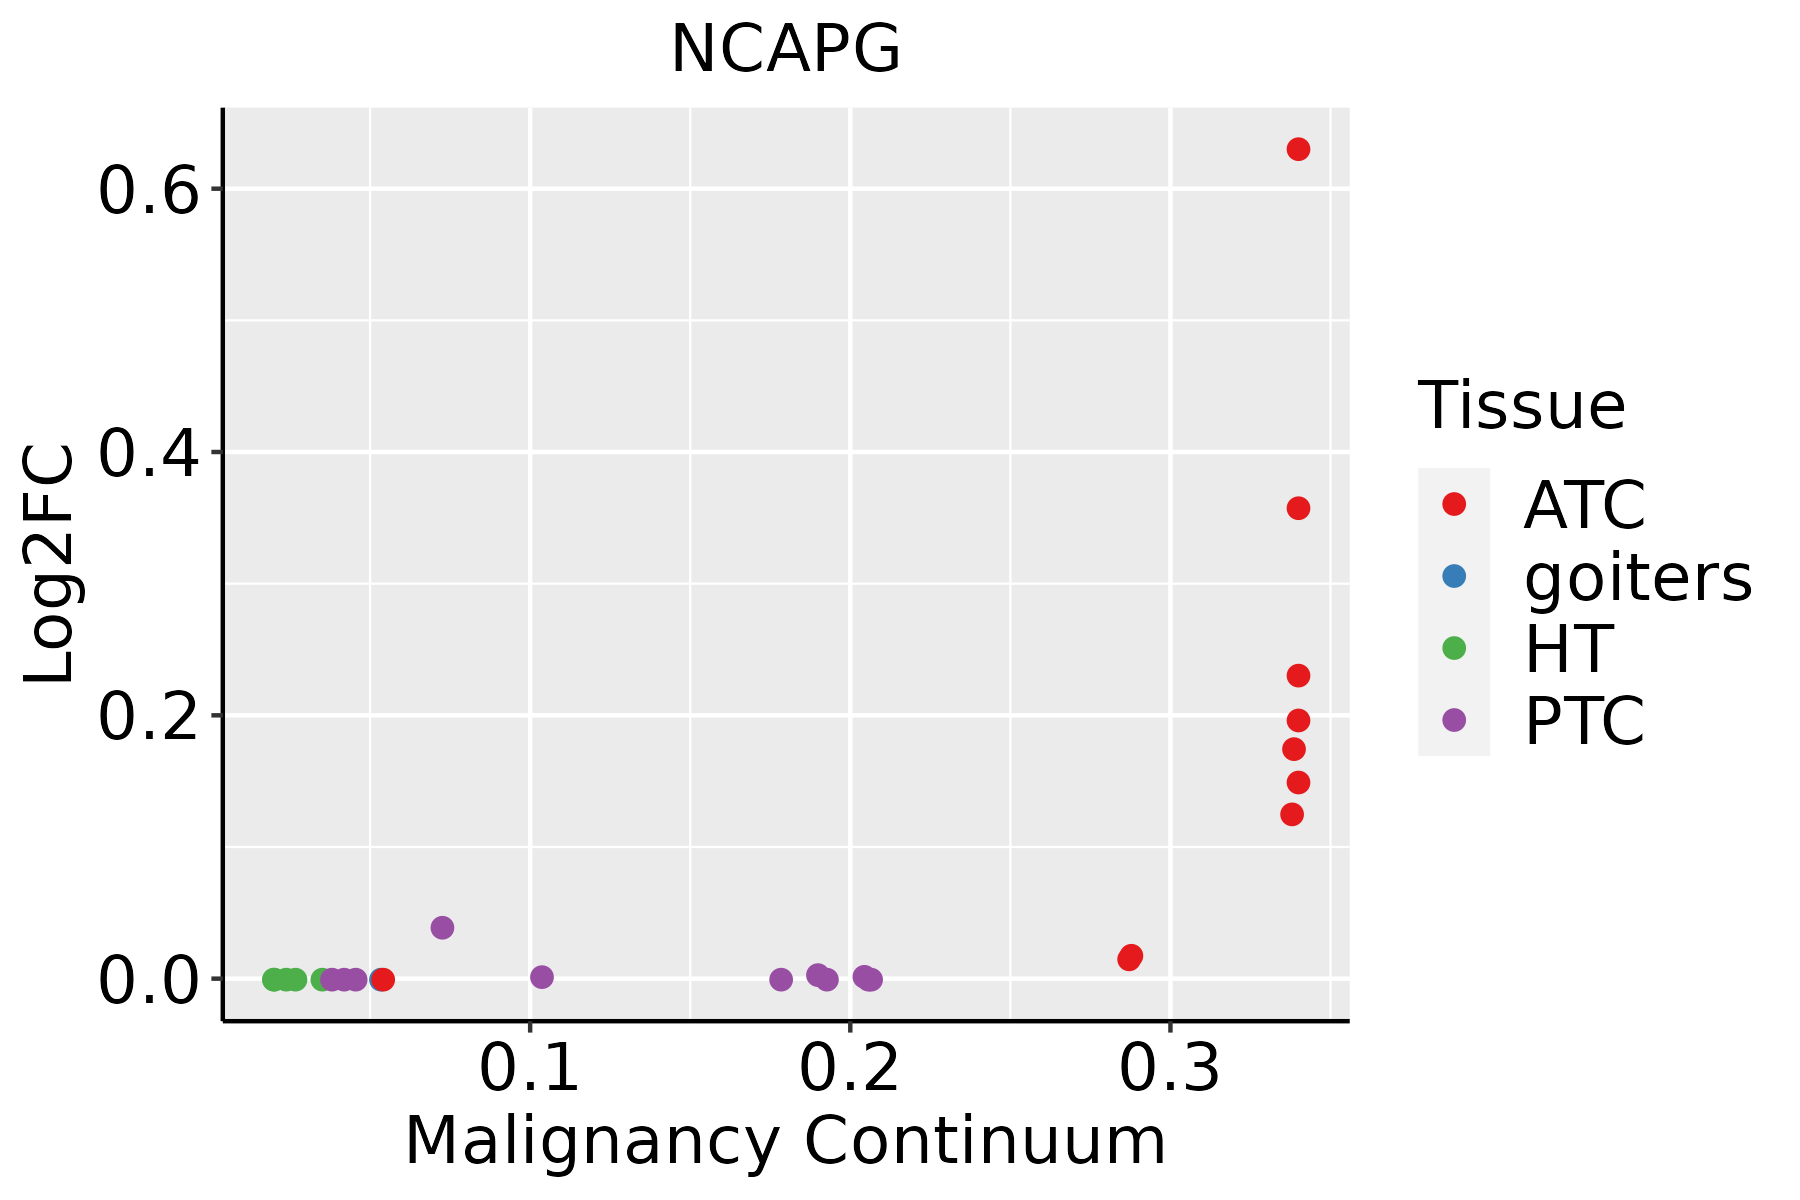 | ATC: Anaplastic thyroid cancer |
| HT: Hashimoto's thyroiditis | ||
| PTC: Papillary thyroid cancer |
| ∗log2FC in expression of this searched gene in stem-like cells from each diseased tissue sample relative to stem-like cells in normal samples in each tissue plotted against the malignancy continuum. Samples are colored based on if they are from different disease stage. |
Top |
Malignant transformation related pathway analysis |
| Find out the enriched GO biological processes and KEGG pathways involved in transition from healthy to precancer to cancer |
| Tissue | Disease Stage | Enriched GO biological Processes |
| Colorectum | AD |  |
| Colorectum | SER |  |
| Colorectum | MSS |  |
| Colorectum | MSI-H |  |
| Colorectum | FAP |  |
| ∗Top 15 enriched GO BP terms are showed in the bar plot of each disease state in each tissue. Each row represents a significant GO biological process which is colored according to the -log10(p.adjust). |
| Page: 1 2 3 4 5 6 7 8 9 |
| GO ID | Tissue | Disease Stage | Description | Gene Ratio | Bg Ratio | pvalue | p.adjust | Count |
| GO:001657015 | Esophagus | ESCC | histone modification | 323/8552 | 463/18723 | 2.61e-26 | 7.88e-24 | 323 |
| GO:014001414 | Esophagus | ESCC | mitotic nuclear division | 218/8552 | 287/18723 | 6.17e-26 | 1.78e-23 | 218 |
| GO:000007011 | Esophagus | ESCC | mitotic sister chromatid segregation | 138/8552 | 168/18723 | 1.37e-22 | 2.63e-20 | 138 |
| GO:00008194 | Esophagus | ESCC | sister chromatid segregation | 157/8552 | 202/18723 | 8.41e-21 | 1.33e-18 | 157 |
| GO:000705911 | Esophagus | ESCC | chromosome segregation | 238/8552 | 346/18723 | 1.72e-18 | 1.82e-16 | 238 |
| GO:000170119 | Esophagus | ESCC | in utero embryonic development | 243/8552 | 367/18723 | 1.00e-15 | 6.86e-14 | 243 |
| GO:00482853 | Esophagus | ESCC | organelle fission | 301/8552 | 488/18723 | 4.64e-13 | 2.12e-11 | 301 |
| GO:00988133 | Esophagus | ESCC | nuclear chromosome segregation | 187/8552 | 281/18723 | 1.00e-12 | 4.36e-11 | 187 |
| GO:0010563111 | Esophagus | ESCC | negative regulation of phosphorus metabolic process | 274/8552 | 442/18723 | 2.32e-12 | 9.41e-11 | 274 |
| GO:0045936111 | Esophagus | ESCC | negative regulation of phosphate metabolic process | 273/8552 | 441/18723 | 3.18e-12 | 1.25e-10 | 273 |
| GO:0051348111 | Esophagus | ESCC | negative regulation of transferase activity | 177/8552 | 268/18723 | 1.08e-11 | 4.00e-10 | 177 |
| GO:00002802 | Esophagus | ESCC | nuclear division | 270/8552 | 439/18723 | 1.17e-11 | 4.24e-10 | 270 |
| GO:0042326111 | Esophagus | ESCC | negative regulation of phosphorylation | 237/8552 | 385/18723 | 1.86e-10 | 5.33e-09 | 237 |
| GO:0001933111 | Esophagus | ESCC | negative regulation of protein phosphorylation | 213/8552 | 342/18723 | 3.54e-10 | 9.76e-09 | 213 |
| GO:0030099111 | Esophagus | ESCC | myeloid cell differentiation | 232/8552 | 381/18723 | 1.22e-09 | 2.90e-08 | 232 |
| GO:003367319 | Esophagus | ESCC | negative regulation of kinase activity | 154/8552 | 237/18723 | 1.38e-09 | 3.27e-08 | 154 |
| GO:003105614 | Esophagus | ESCC | regulation of histone modification | 106/8552 | 152/18723 | 1.52e-09 | 3.55e-08 | 106 |
| GO:000646920 | Esophagus | ESCC | negative regulation of protein kinase activity | 140/8552 | 212/18723 | 1.53e-09 | 3.56e-08 | 140 |
| GO:00356015 | Esophagus | ESCC | protein deacylation | 79/8552 | 112/18723 | 8.30e-08 | 1.42e-06 | 79 |
| GO:0002262111 | Esophagus | ESCC | myeloid cell homeostasis | 104/8552 | 157/18723 | 1.49e-07 | 2.36e-06 | 104 |
| Page: 1 2 3 4 5 6 7 |
| Pathway ID | Tissue | Disease Stage | Description | Gene Ratio | Bg Ratio | pvalue | p.adjust | qvalue | Count |
| Page: 1 |
Top |
Cell-cell communication analysis |
| Identification of potential cell-cell interactions between two cell types and their ligand-receptor pairs for different disease states |
| Ligand | Receptor | LRpair | Pathway | Tissue | Disease Stage |
| Page: 1 |
Top |
Single-cell gene regulatory network inference analysis |
| Find out the significant the regulons (TFs) and the target genes of each regulon across cell types for different disease states |
| TF | Cell Type | Tissue | Disease Stage | Target Gene | RSS | Regulon Activity |
| ∗The dot plots of a searched regulon are shown for all cell subpopulations in each disease state of each tissue based on the regulon specific score inferred using pySCENIC and by calculating the average expression. |
| Page: 1 |
Top |
Somatic mutation of malignant transformation related genes |
| Annotation of somatic variants for genes involved in malignant transformation |
| Hugo Symbol | Variant Class | Variant Classification | dbSNP RS | HGVSc | HGVSp | HGVSp Short | SWISSPROT | BIOTYPE | SIFT | PolyPhen | Tumor Sample Barcode | Tissue | Histology | Sex | Age | Stage | Therapy Types | Drugs | Outcome |
| NCAPG | SNV | Missense_Mutation | c.956A>T | p.Asn319Ile | p.N319I | Q9BPX3 | protein_coding | tolerated(0.25) | benign(0.009) | TCGA-E9-A1QZ-01 | Breast | breast invasive carcinoma | Female | <65 | I/II | Unknown | Unknown | SD | |
| NCAPG | SNV | Missense_Mutation | novel | c.1021G>T | p.Ala341Ser | p.A341S | Q9BPX3 | protein_coding | tolerated(0.28) | benign(0.075) | TCGA-C5-A2LT-01 | Cervix | cervical & endocervical cancer | Female | <65 | I/II | Chemotherapy | cisplatin | SD |
| NCAPG | SNV | Missense_Mutation | novel | c.2476N>T | p.Val826Leu | p.V826L | Q9BPX3 | protein_coding | deleterious(0.05) | benign(0.328) | TCGA-5M-AATA-01 | Colorectum | colon adenocarcinoma | Unknown | Unknown | I/II | Unknown | Unknown | Unknown |
| NCAPG | SNV | Missense_Mutation | rs765333490 | c.1441G>A | p.Asp481Asn | p.D481N | Q9BPX3 | protein_coding | tolerated(0.11) | benign(0.288) | TCGA-AA-3510-01 | Colorectum | colon adenocarcinoma | Male | >=65 | I/II | Unknown | Unknown | SD |
| NCAPG | SNV | Missense_Mutation | c.2807N>C | p.Val936Ala | p.V936A | Q9BPX3 | protein_coding | tolerated_low_confidence(0.86) | benign(0.003) | TCGA-AA-3511-01 | Colorectum | colon adenocarcinoma | Male | <65 | I/II | Unknown | Unknown | PD | |
| NCAPG | SNV | Missense_Mutation | rs146806366 | c.1904N>C | p.Val635Ala | p.V635A | Q9BPX3 | protein_coding | tolerated(0.3) | benign(0.026) | TCGA-AA-3672-01 | Colorectum | colon adenocarcinoma | Female | >=65 | III/IV | Unknown | Unknown | SD |
| NCAPG | SNV | Missense_Mutation | novel | c.2417N>A | p.Thr806Lys | p.T806K | Q9BPX3 | protein_coding | deleterious(0) | probably_damaging(1) | TCGA-AA-3845-01 | Colorectum | colon adenocarcinoma | Female | >=65 | I/II | Unknown | Unknown | PD |
| NCAPG | SNV | Missense_Mutation | c.590N>A | p.Arg197Gln | p.R197Q | Q9BPX3 | protein_coding | deleterious(0) | probably_damaging(0.992) | TCGA-AA-3864-01 | Colorectum | colon adenocarcinoma | Male | >=65 | I/II | Unknown | Unknown | SD | |
| NCAPG | SNV | Missense_Mutation | rs770259903 | c.1412N>T | p.Ala471Val | p.A471V | Q9BPX3 | protein_coding | deleterious(0.01) | benign(0.005) | TCGA-AA-3947-01 | Colorectum | colon adenocarcinoma | Female | <65 | I/II | Unknown | Unknown | SD |
| NCAPG | SNV | Missense_Mutation | c.1756N>A | p.Glu586Lys | p.E586K | Q9BPX3 | protein_coding | deleterious(0.02) | possibly_damaging(0.453) | TCGA-AA-A00N-01 | Colorectum | colon adenocarcinoma | Male | >=65 | I/II | Unknown | Unknown | PD |
| Page: 1 2 3 4 5 6 7 8 9 |
Top |
Related drugs of malignant transformation related genes |
| Identification of chemicals and drugs interact with genes involved in malignant transfromation |
| (DGIdb 4.0) |
| Entrez ID | Symbol | Category | Interaction Types | Drug Claim Name | Drug Name | PMIDs |
| Page: 1 |

Copyright 2023-Present -The University of Texas Health Science Center at Houston |