Schematic overview of the cellular and molecular mechanisms involved in the cancer progression, including the proposed cellular and molecular mechanisms in cancer cells trajectory. AT1: alveolar type 1 cells; AT2: alveolar type 2 cells; AAH: atypical adenomatous hyperplasia; AIS: adenocarcinoma in situ; MIA: minimally invasive adenocarcinoma; IA: invasive adenocarcinoma; EMT: epithelial-mesenchymal transition

Home

Download

Statistics

Help

Contact

Center for Computational Systems Medicine
leaf

Gene summary

leaf

Malignant transformation analysis

leaf

Malignant transformation related pathway analysis

leaf

Cell-cell communication analysis

leaf

Single-cell gene regulatory network inference analysis

leaf

Somatic mutation of malignant transformation related genes

leaf

Related drugs of malignant transformation related genes

Gene: NCAPD2

Gene summary for NCAPD2

check button Gene summary.

Gene informationSpeciesHuman
Gene symbol

NCAPD2

Gene ID

9918

Gene namenon-SMC condensin I complex subunit D2
Gene AliasCAP-D2
Cytomap12p13.31
Gene Typeprotein-coding
GO ID

GO:0000003

UniProtAcc

B3KMS0


Top

Malignant transformation analysis

check button Identification of the aberrant gene expression in precancerous and cancerous lesions by comparing the gene expression of stem-like cells in diseased tissues with normal stem cells
check button Malignant transformation involving gene list.
Entrez IDSymbolReplicatesSpeciesOrganTissueAdj P-valueLog2FCMalignancy
9918NCAPD2HTA11_347_2000001011HumanColorectumAD3.27e-023.28e-01-0.1954
9918NCAPD2HTA11_411_2000001011HumanColorectumSER4.36e-025.65e-01-0.2602
9918NCAPD2HTA11_696_2000001011HumanColorectumAD2.31e-054.11e-01-0.1464
9918NCAPD2HTA11_1391_2000001011HumanColorectumAD8.16e-034.48e-01-0.059
9918NCAPD2HTA11_546_2000001011HumanColorectumAD4.76e-024.30e-01-0.0842
9918NCAPD2HTA11_7696_3000711011HumanColorectumAD1.63e-021.60e-010.0674
9918NCAPD2HTA11_99999970781_79442HumanColorectumMSS6.27e-032.63e-010.294
9918NCAPD2HTA11_99999971662_82457HumanColorectumMSS2.45e-032.74e-010.3859
9918NCAPD2LZE2THumanEsophagusESCC2.42e-059.91e-010.082
9918NCAPD2LZE7THumanEsophagusESCC1.53e-052.06e-010.0667
9918NCAPD2LZE24THumanEsophagusESCC2.71e-021.69e-010.0596
9918NCAPD2P2T-EHumanEsophagusESCC1.25e-205.99e-010.1177
9918NCAPD2P4T-EHumanEsophagusESCC1.64e-124.91e-010.1323
9918NCAPD2P5T-EHumanEsophagusESCC3.32e-052.42e-010.1327
9918NCAPD2P8T-EHumanEsophagusESCC5.86e-031.89e-010.0889
9918NCAPD2P9T-EHumanEsophagusESCC3.29e-032.29e-010.1131
9918NCAPD2P10T-EHumanEsophagusESCC1.55e-143.98e-010.116
9918NCAPD2P12T-EHumanEsophagusESCC2.82e-112.88e-010.1122
9918NCAPD2P15T-EHumanEsophagusESCC2.14e-073.43e-010.1149
9918NCAPD2P16T-EHumanEsophagusESCC6.39e-092.00e-010.1153
Page: 1 2 3 4 5 

check button Transcriptomic changes along malignancy continuum.
TissueExpression DynamicsAbbreviation
Colorectum (GSE201348)The image shows the transcriptomic changes along malignancy continuum.log2FC in expression of this searched gene in stem-like cells from each diseased tissue sample relative to stem-like cells in normal samples in each tissue plotted against the malignancy continuum. Samples are colored based on if they are from different disease stage.FAP: Familial adenomatous polyposis
CRC: Colorectal cancer
Colorectum (HTA11)The image shows the transcriptomic changes along malignancy continuum.log2FC in expression of this searched gene in stem-like cells from each diseased tissue sample relative to stem-like cells in normal samples in each tissue plotted against the malignancy continuum. Samples are colored based on if they are from different disease stage.AD: Adenomas
SER: Sessile serrated lesions
MSI-H: Microsatellite-high colorectal cancer
MSS: Microsatellite stable colorectal cancer
EsophagusThe image shows the transcriptomic changes along malignancy continuum.log2FC in expression of this searched gene in stem-like cells from each diseased tissue sample relative to stem-like cells in normal samples in each tissue plotted against the malignancy continuum. Samples are colored based on if they are from different disease stage.
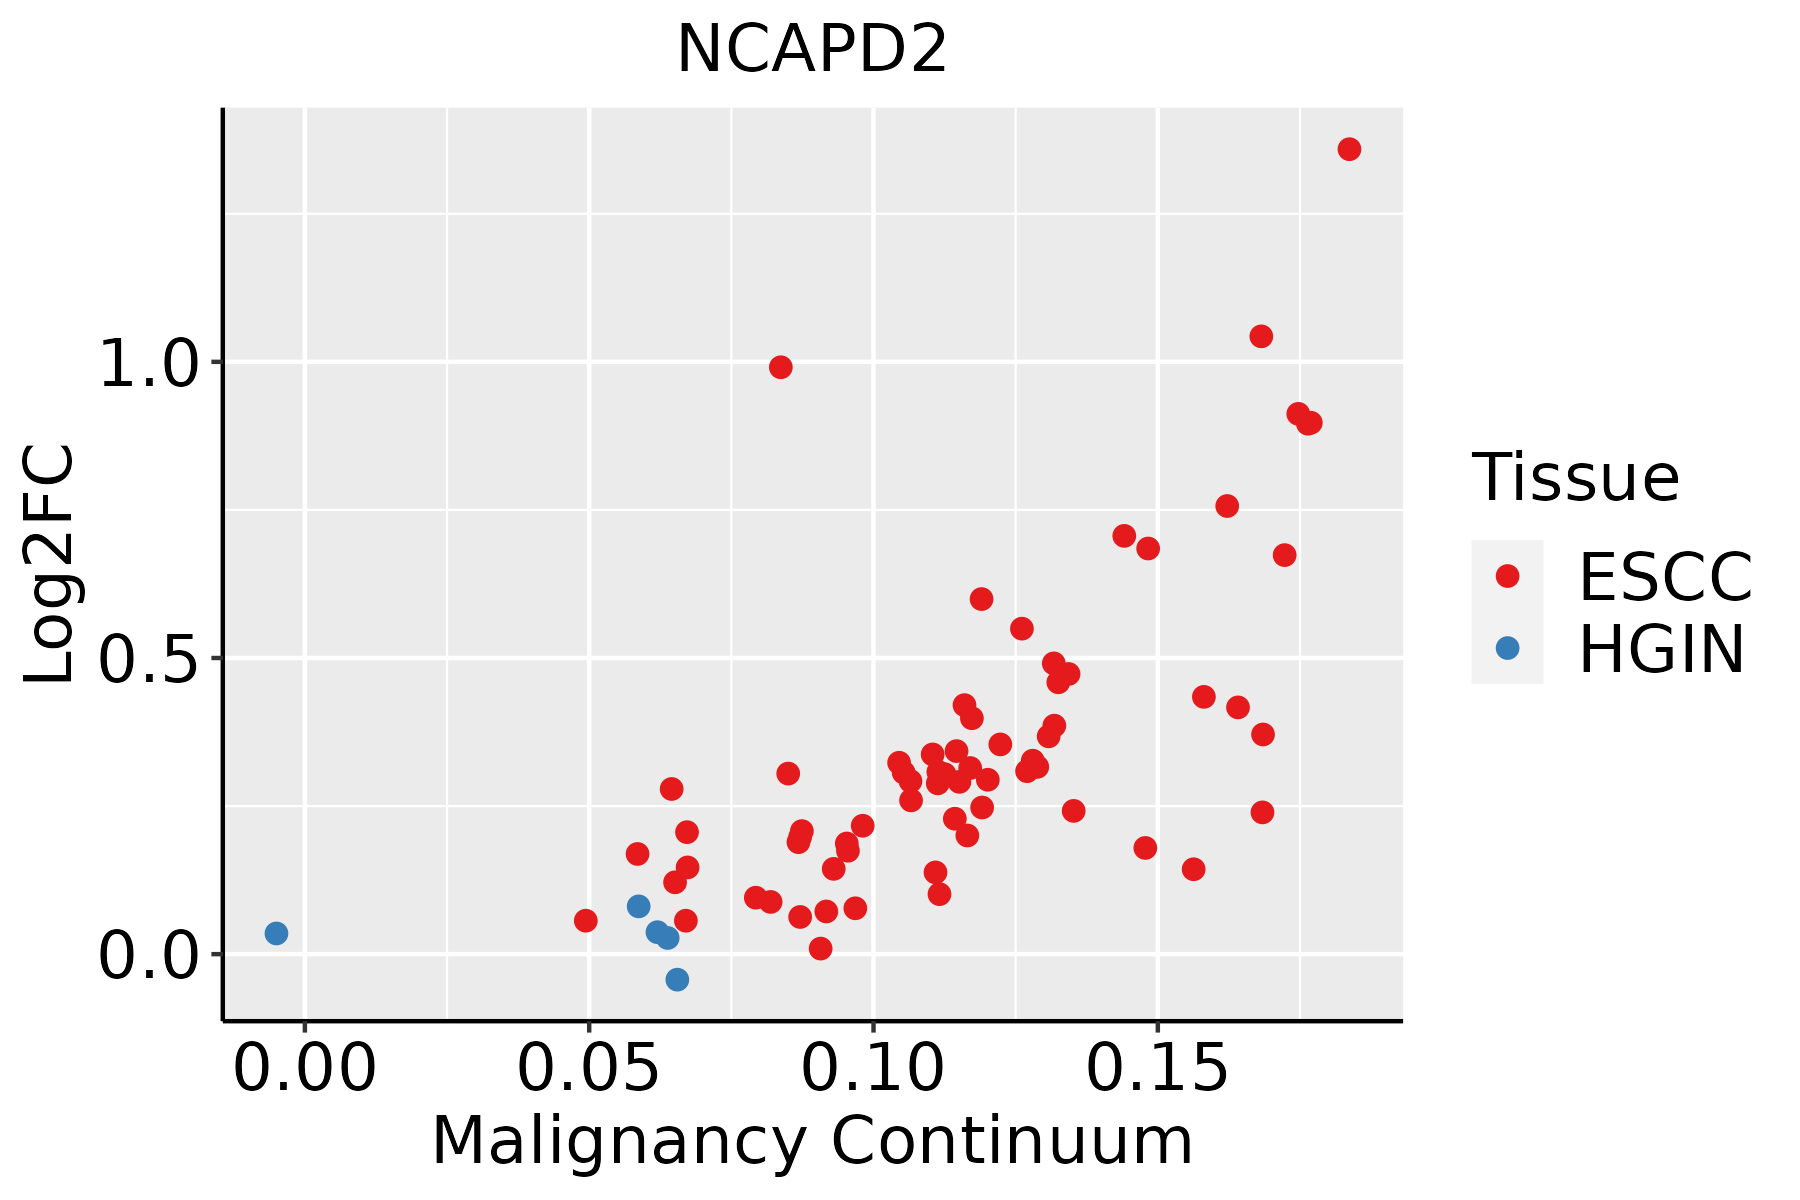
ESCC: Esophageal squamous cell carcinoma
HGIN: High-grade intraepithelial neoplasias
LGIN: Low-grade intraepithelial neoplasias
LiverThe image shows the transcriptomic changes along malignancy continuum.log2FC in expression of this searched gene in stem-like cells from each diseased tissue sample relative to stem-like cells in normal samples in each tissue plotted against the malignancy continuum. Samples are colored based on if they are from different disease stage.HCC: Hepatocellular carcinoma
NAFLD: Non-alcoholic fatty liver disease
Oral CavityThe image shows the transcriptomic changes along malignancy continuum.log2FC in expression of this searched gene in stem-like cells from each diseased tissue sample relative to stem-like cells in normal samples in each tissue plotted against the malignancy continuum. Samples are colored based on if they are from different disease stage.
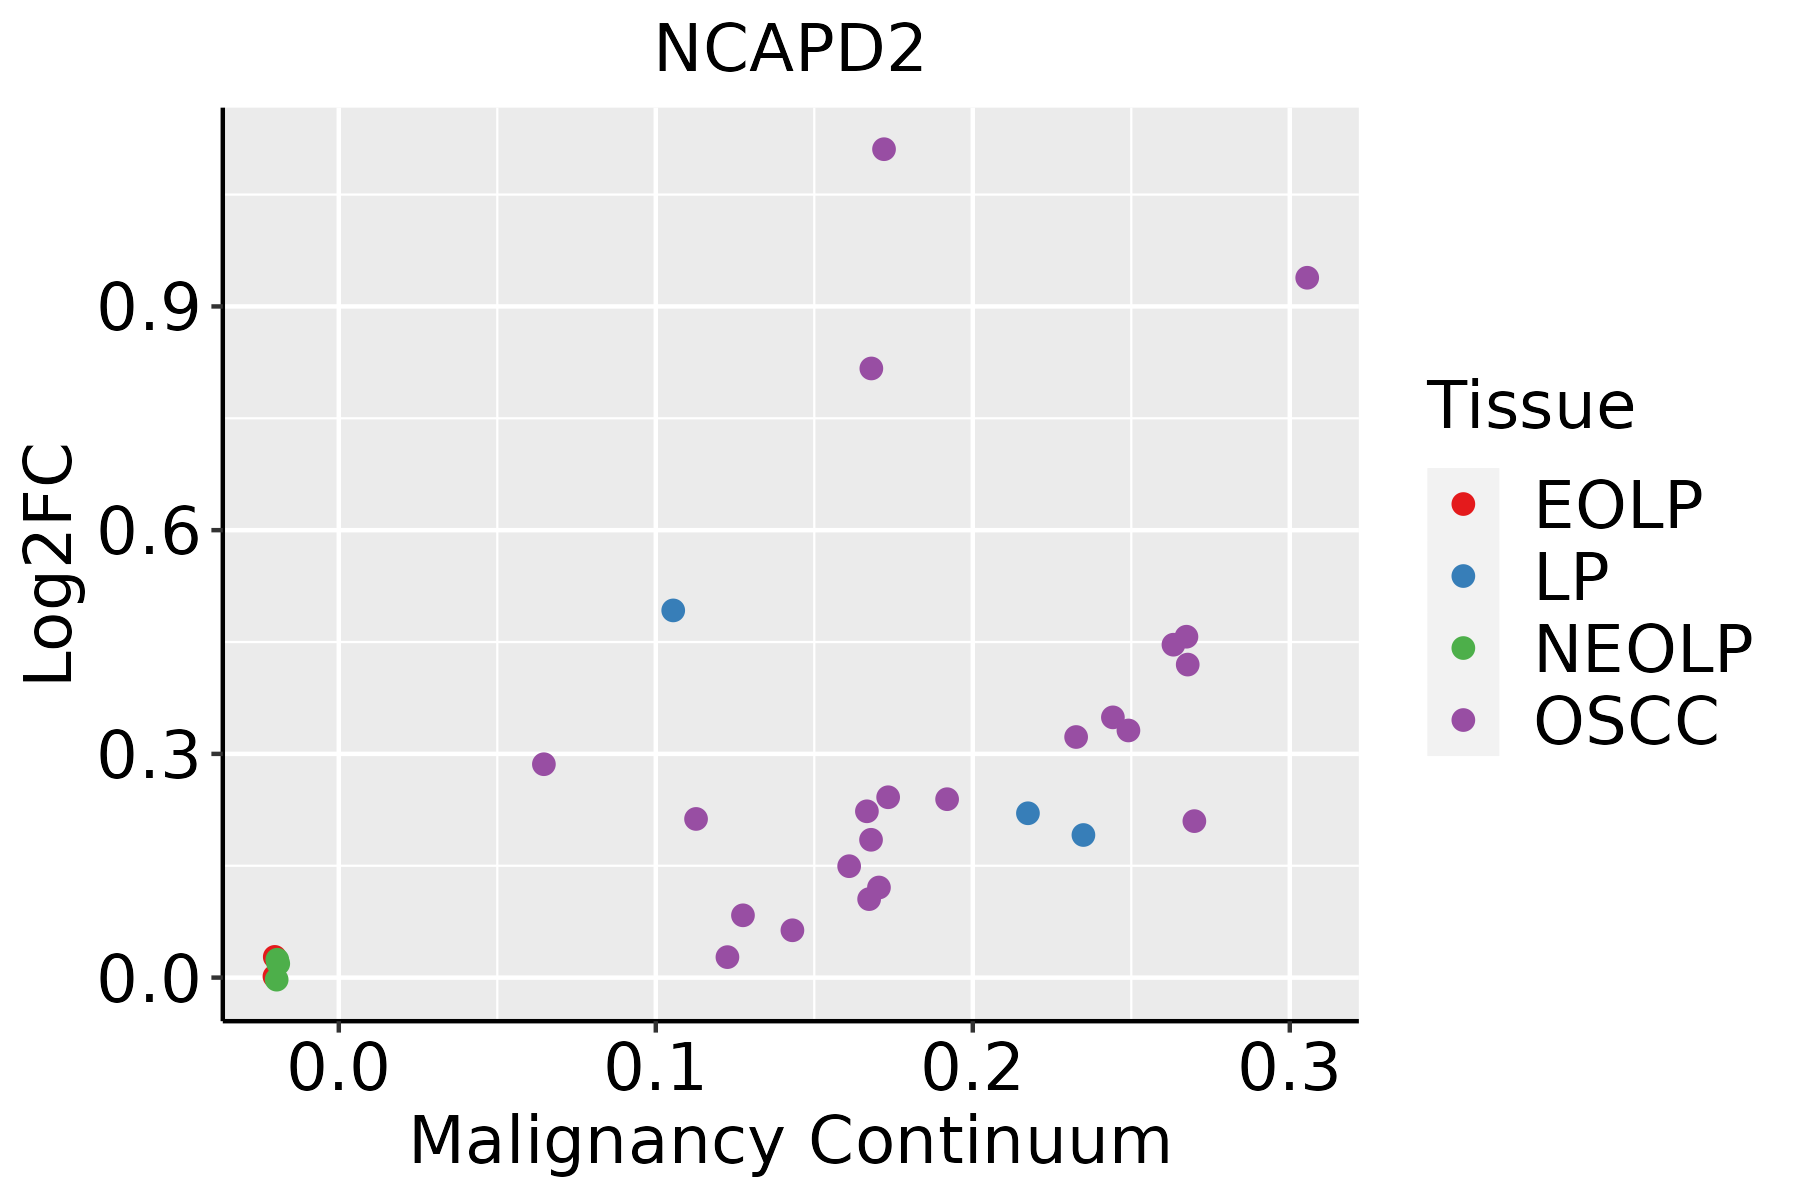
EOLP: Erosive Oral lichen planus
LP: leukoplakia
NEOLP: Non-erosive oral lichen planus
OSCC: Oral squamous cell carcinoma
SkinThe image shows the transcriptomic changes along malignancy continuum.log2FC in expression of this searched gene in stem-like cells from each diseased tissue sample relative to stem-like cells in normal samples in each tissue plotted against the malignancy continuum. Samples are colored based on if they are from different disease stage.
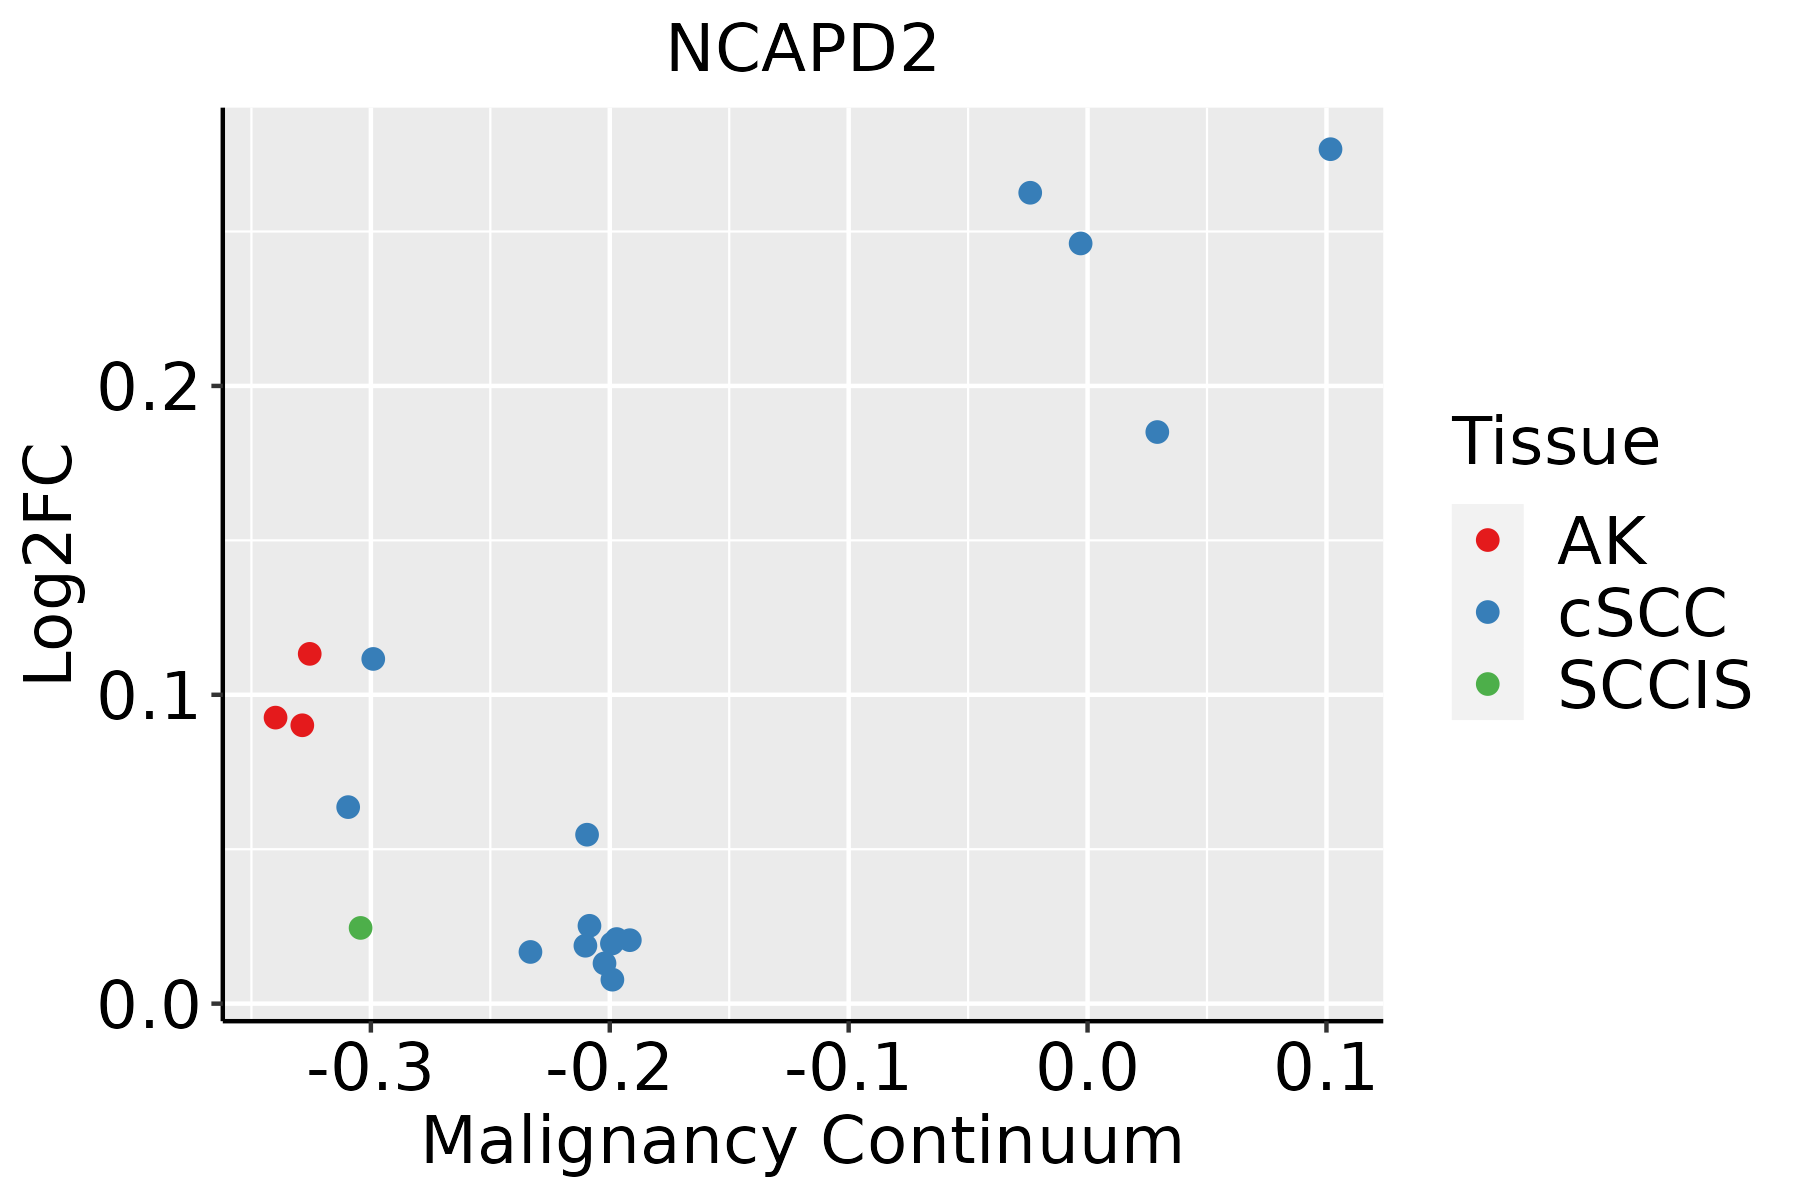
AK: Actinic keratosis
cSCC: Cutaneous squamous cell carcinoma
SCCIS:squamous cell carcinoma in situ
∗log2FC in expression of this searched gene in stem-like cells from each diseased tissue sample relative to stem-like cells in normal samples in each tissue plotted against the malignancy continuum. Samples are colored based on if they are from different disease stage.

Top

Malignant transformation related pathway analysis

check buttonFind out the enriched GO biological processes and KEGG pathways involved in transition from healthy to precancer to cancer
check button Figure of enriched GO biological processes.
TissueDisease StageEnriched GO biological Processes
ColorectumADGO analysis - Figure of enriched GO biological processes: Top 15 enriched GO BP terms are showed in the bar plot of each disease state in each tissue. Each row represents a significant GO biological process which is colored according to the -log10(p.adjust).
ColorectumSERGO analysis - Figure of enriched GO biological processes: Top 15 enriched GO BP terms are showed in the bar plot of each disease state in each tissue. Each row represents a significant GO biological process which is colored according to the -log10(p.adjust).
ColorectumMSSGO analysis - Figure of enriched GO biological processes: Top 15 enriched GO BP terms are showed in the bar plot of each disease state in each tissue. Each row represents a significant GO biological process which is colored according to the -log10(p.adjust).
ColorectumMSI-HGO analysis - Figure of enriched GO biological processes: Top 15 enriched GO BP terms are showed in the bar plot of each disease state in each tissue. Each row represents a significant GO biological process which is colored according to the -log10(p.adjust).
ColorectumFAPGO analysis - Figure of enriched GO biological processes: Top 15 enriched GO BP terms are showed in the bar plot of each disease state in each tissue. Each row represents a significant GO biological process which is colored according to the -log10(p.adjust).
∗Top 15 enriched GO BP terms are showed in the bar plot of each disease state in each tissue. Each row represents a significant GO biological process which is colored according to the -log10(p.adjust).
Page: 1 2 3 4 5 6 7 8 9 

check button Enriched GO biological processes.
GO IDTissueDisease StageDescriptionGene RatioBg Ratiopvaluep.adjustCount
GO:0140014ColorectumADmitotic nuclear division78/3918287/187236.48e-034.05e-0278
GO:01400141ColorectumMSSmitotic nuclear division70/3467287/187237.48e-034.72e-0270
GO:014001414EsophagusESCCmitotic nuclear division218/8552287/187236.17e-261.78e-23218
GO:000007011EsophagusESCCmitotic sister chromatid segregation138/8552168/187231.37e-222.63e-20138
GO:00008194EsophagusESCCsister chromatid segregation157/8552202/187238.41e-211.33e-18157
GO:000705911EsophagusESCCchromosome segregation238/8552346/187231.72e-181.82e-16238
GO:00482853EsophagusESCCorganelle fission301/8552488/187234.64e-132.12e-11301
GO:00988133EsophagusESCCnuclear chromosome segregation187/8552281/187231.00e-124.36e-11187
GO:00002802EsophagusESCCnuclear division270/8552439/187231.17e-114.24e-10270
GO:00070761EsophagusESCCmitotic chromosome condensation15/855217/187233.48e-042.03e-0315
GO:014001411LiverHCCmitotic nuclear division174/7958287/187233.74e-101.23e-08174
GO:0000070LiverHCCmitotic sister chromatid segregation110/7958168/187231.42e-094.25e-08110
GO:00008191LiverHCCsister chromatid segregation128/7958202/187231.59e-094.73e-08128
GO:0007059LiverHCCchromosome segregation197/7958346/187233.57e-087.87e-07197
GO:0098813LiverHCCnuclear chromosome segregation157/7958281/187233.82e-064.95e-05157
GO:0048285LiverHCCorganelle fission254/7958488/187231.07e-051.23e-04254
GO:0000280LiverHCCnuclear division220/7958439/187236.90e-044.25e-03220
GO:01400145Oral cavityOSCCmitotic nuclear division191/7305287/187231.99e-213.70e-19191
GO:00000702Oral cavityOSCCmitotic sister chromatid segregation118/7305168/187231.89e-161.48e-14118
GO:00008193Oral cavityOSCCsister chromatid segregation135/7305202/187238.88e-166.52e-14135
Page: 1 2 

check button Enriched KEGG pathways.
Pathway IDTissueDisease StageDescriptionGene RatioBg Ratiopvaluep.adjustqvalueCount
Page: 1 

Top

Cell-cell communication analysis

check buttonIdentification of potential cell-cell interactions between two cell types and their ligand-receptor pairs for different disease states
LigandReceptorLRpairPathwayTissueDisease Stage
Page: 1 

Top

Single-cell gene regulatory network inference analysis

check buttonFind out the significant the regulons (TFs) and the target genes of each regulon across cell types for different disease states
TFCell TypeTissueDisease StageTarget GeneRSSRegulon Activity
∗The dot plots of a searched regulon are shown for all cell subpopulations in each disease state of each tissue based on the regulon specific score inferred using pySCENIC and by calculating the average expression.
Page: 1 

Top

Somatic mutation of malignant transformation related genes

check buttonAnnotation of somatic variants for genes involved in malignant transformation
Hugo SymbolVariant ClassVariant ClassificationdbSNP RSHGVScHGVSpHGVSp ShortSWISSPROTBIOTYPESIFTPolyPhenTumor Sample BarcodeTissueHistologySexAgeStageTherapy TypesDrugsOutcome
NCAPD2SNVMissense_Mutationnovelc.1932N>Cp.Met644Ilep.M644IQ15021protein_codingdeleterious(0.01)benign(0.184)TCGA-AC-A5XS-01Breastbreast invasive carcinomaFemale>=65I/IIHormone TherapyfemaraSD
NCAPD2SNVMissense_Mutationrs369341180c.1169N>Ap.Arg390Glnp.R390QQ15021protein_codingdeleterious(0.04)probably_damaging(0.961)TCGA-AN-A046-01Breastbreast invasive carcinomaFemale>=65I/IIUnknownUnknownSD
NCAPD2SNVMissense_Mutationc.3245N>Cp.Leu1082Prop.L1082PQ15021protein_codingdeleterious(0)probably_damaging(1)TCGA-AO-A0J4-01Breastbreast invasive carcinomaFemale<65I/IIChemotherapydoxorubicinSD
NCAPD2insertionFrame_Shift_Insnovelc.3066_3067insATGTGCAAp.Asn1023MetfsTer27p.N1023Mfs*27Q15021protein_codingTCGA-A8-A091-01Breastbreast invasive carcinomaFemale<65I/IIChemotherapy5-fluorouracilPD
NCAPD2insertionIn_Frame_Insnovelc.2420_2421insAAGCTTCCTGAAGGTp.Gln807_Asp808insSerPheLeuLysValp.Q807_D808insSFLKVQ15021protein_codingTCGA-AO-A03R-01Breastbreast invasive carcinomaFemale<65I/IIChemotherapydoxorubicinSD
NCAPD2SNVMissense_Mutationnovelc.2233N>Gp.Lys745Glup.K745EQ15021protein_codingdeleterious(0.02)benign(0.057)TCGA-2W-A8YY-01Cervixcervical & endocervical cancerFemale<65I/IIChemotherapycisplatinCR
NCAPD2SNVMissense_Mutationnovelc.2597N>Tp.Pro866Leup.P866LQ15021protein_codingdeleterious(0)possibly_damaging(0.883)TCGA-2W-A8YY-01Cervixcervical & endocervical cancerFemale<65I/IIChemotherapycisplatinCR
NCAPD2SNVMissense_Mutationrs771553945c.3644N>Ap.Arg1215Hisp.R1215HQ15021protein_codingdeleterious(0.01)probably_damaging(0.995)TCGA-2W-A8YY-01Cervixcervical & endocervical cancerFemale<65I/IIChemotherapycisplatinCR
NCAPD2SNVMissense_Mutationnovelc.2858G>Ap.Arg953Glnp.R953QQ15021protein_codingtolerated(0.06)possibly_damaging(0.487)TCGA-C5-A7X5-01Cervixcervical & endocervical cancerFemale>=65I/IIChemotherapycarboplatinPD
NCAPD2SNVMissense_Mutationnovelc.3055N>Gp.Leu1019Valp.L1019VQ15021protein_codingtolerated(0.78)benign(0.04)TCGA-C5-A8YR-01Cervixcervical & endocervical cancerFemale<65I/IIUnknownUnknownPD
Page: 1 2 3 4 5 6 7 8 9 10 11 12 13 

Top

Related drugs of malignant transformation related genes

check buttonIdentification of chemicals and drugs interact with genes involved in malignant transfromation
(DGIdb 4.0)
Entrez IDSymbolCategoryInteraction TypesDrug Claim NameDrug NamePMIDs
Page: 1