
|
|||||
|
 | |
| |
| |
| |
| |
| |
|
Gene: NCAM2 |
Gene summary for NCAM2 |
| Gene information | Species | Human | Gene symbol | NCAM2 | Gene ID | 4685 |
| Gene name | neural cell adhesion molecule 2 | |
| Gene Alias | NCAM21 | |
| Cytomap | 21q21.1 | |
| Gene Type | protein-coding | GO ID | GO:0003008 | UniProtAcc | O15394 |
Top |
Malignant transformation analysis |
| Identification of the aberrant gene expression in precancerous and cancerous lesions by comparing the gene expression of stem-like cells in diseased tissues with normal stem cells |
| Entrez ID | Symbol | Replicates | Species | Organ | Tissue | Adj P-value | Log2FC | Malignancy |
| 4685 | NCAM2 | RNA-P18T-P18T-2 | Human | Lung | IAC | 5.73e-08 | 1.43e+00 | 0.1129 |
| 4685 | NCAM2 | RNA-P18T-P18T-6 | Human | Lung | IAC | 1.73e-02 | 8.59e-01 | 0.0856 |
| 4685 | NCAM2 | RNA-P18T-P18T-8 | Human | Lung | IAC | 7.36e-03 | 8.75e-01 | 0.1151 |
| 4685 | NCAM2 | RNA-P3T-P3T-1 | Human | Lung | IAC | 8.87e-03 | 3.77e-01 | 0.1829 |
| 4685 | NCAM2 | RNA-P3T-P3T-4 | Human | Lung | IAC | 1.67e-02 | 3.62e-01 | 0.1859 |
| Page: 1 |
| Tissue | Expression Dynamics | Abbreviation |
| Lung | 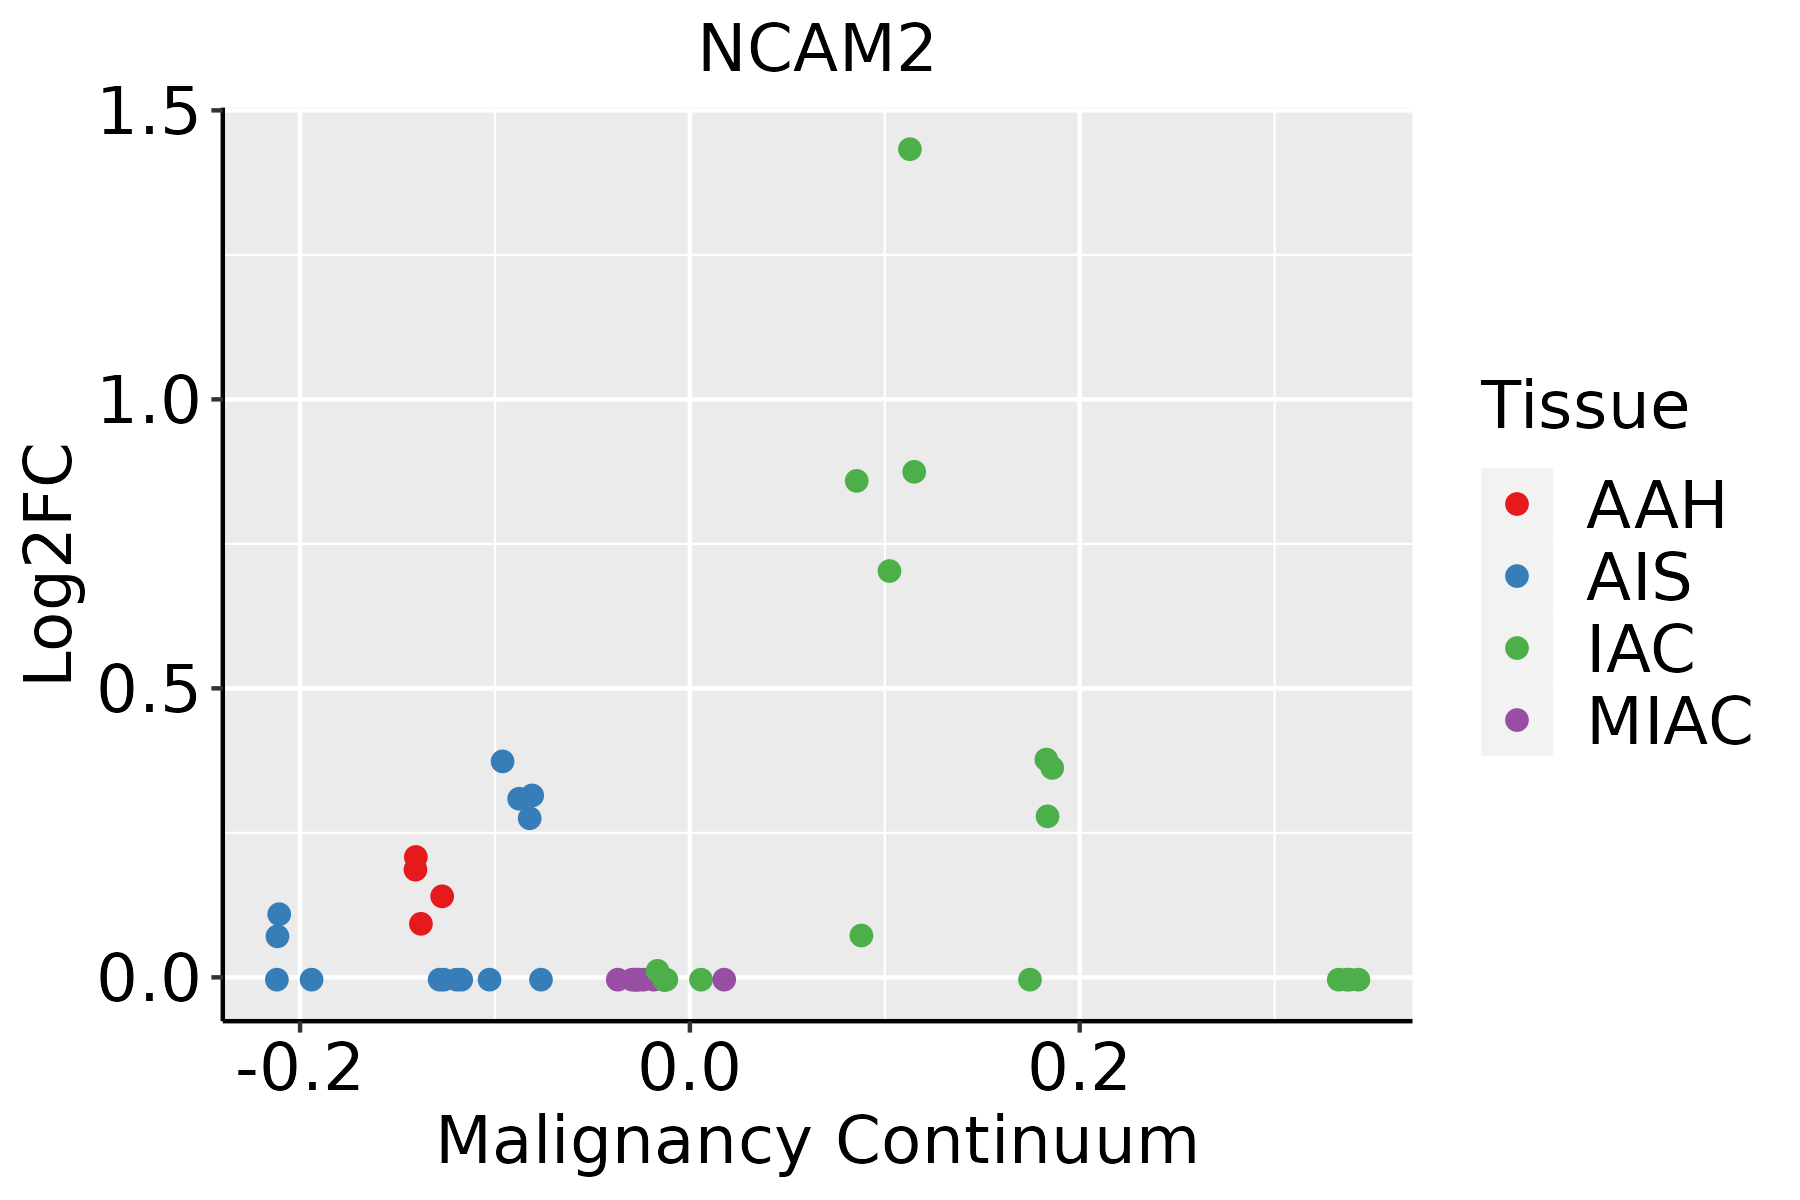 | AAH: Atypical adenomatous hyperplasia |
| AIS: Adenocarcinoma in situ | ||
| IAC: Invasive lung adenocarcinoma | ||
| MIA: Minimally invasive adenocarcinoma |
| ∗log2FC in expression of this searched gene in stem-like cells from each diseased tissue sample relative to stem-like cells in normal samples in each tissue plotted against the malignancy continuum. Samples are colored based on if they are from different disease stage. |
Top |
Malignant transformation related pathway analysis |
| Find out the enriched GO biological processes and KEGG pathways involved in transition from healthy to precancer to cancer |
| Tissue | Disease Stage | Enriched GO biological Processes |
| Colorectum | AD |  |
| Colorectum | SER |  |
| Colorectum | MSS |  |
| Colorectum | MSI-H |  |
| Colorectum | FAP |  |
| ∗Top 15 enriched GO BP terms are showed in the bar plot of each disease state in each tissue. Each row represents a significant GO biological process which is colored according to the -log10(p.adjust). |
| Page: 1 2 3 4 5 6 7 8 9 |
| GO ID | Tissue | Disease Stage | Description | Gene Ratio | Bg Ratio | pvalue | p.adjust | Count |
| GO:00615646 | Lung | IAC | axon development | 78/2061 | 467/18723 | 1.12e-04 | 2.15e-03 | 78 |
| Page: 1 |
| Pathway ID | Tissue | Disease Stage | Description | Gene Ratio | Bg Ratio | pvalue | p.adjust | qvalue | Count |
| hsa045146 | Lung | IAC | Cell adhesion molecules | 30/1053 | 157/8465 | 1.03e-02 | 3.83e-02 | 2.54e-02 | 30 |
| hsa0451411 | Lung | IAC | Cell adhesion molecules | 30/1053 | 157/8465 | 1.03e-02 | 3.83e-02 | 2.54e-02 | 30 |
| Page: 1 |
Top |
Cell-cell communication analysis |
| Identification of potential cell-cell interactions between two cell types and their ligand-receptor pairs for different disease states |
| Ligand | Receptor | LRpair | Pathway | Tissue | Disease Stage |
| NCAM1 | NCAM2 | NCAM1_NCAM2 | NCAM | CRC | ADJ |
| NCAM1 | NCAM2 | NCAM1_NCAM2 | NCAM | CRC | FAP |
| NCAM1 | NCAM2 | NCAM1_NCAM2 | NCAM | Esophagus | ESCC |
| NCAM2 | L1CAM | NCAM2_L1CAM | NCAM | Esophagus | ESCC |
| NCAM1 | NCAM2 | NCAM1_NCAM2 | NCAM | GC | ADJ |
| NCAM1 | NCAM2 | NCAM1_NCAM2 | NCAM | GC | GC |
| NCAM1 | NCAM2 | NCAM1_NCAM2 | NCAM | Liver | Healthy |
| NCAM1 | NCAM2 | NCAM1_NCAM2 | NCAM | Lung | MIAC |
| NCAM1 | NCAM2 | NCAM1_NCAM2 | NCAM | Skin | SCCIS |
| NCAM2 | L1CAM | NCAM2_L1CAM | NCAM | Skin | SCCIS |
| Page: 1 |
Top |
Single-cell gene regulatory network inference analysis |
| Find out the significant the regulons (TFs) and the target genes of each regulon across cell types for different disease states |
| TF | Cell Type | Tissue | Disease Stage | Target Gene | RSS | Regulon Activity |
| ∗The dot plots of a searched regulon are shown for all cell subpopulations in each disease state of each tissue based on the regulon specific score inferred using pySCENIC and by calculating the average expression. |
| Page: 1 |
Top |
Somatic mutation of malignant transformation related genes |
| Annotation of somatic variants for genes involved in malignant transformation |
| Hugo Symbol | Variant Class | Variant Classification | dbSNP RS | HGVSc | HGVSp | HGVSp Short | SWISSPROT | BIOTYPE | SIFT | PolyPhen | Tumor Sample Barcode | Tissue | Histology | Sex | Age | Stage | Therapy Types | Drugs | Outcome |
| NCAM2 | SNV | Missense_Mutation | c.2081N>T | p.Thr694Met | p.T694M | O15394 | protein_coding | deleterious(0.03) | possibly_damaging(0.642) | TCGA-A2-A25C-01 | Breast | breast invasive carcinoma | Female | <65 | I/II | Chemotherapy | taxotere | SD | |
| NCAM2 | SNV | Missense_Mutation | rs770730005 | c.701N>T | p.Ala234Val | p.A234V | O15394 | protein_coding | tolerated(0.2) | benign(0.199) | TCGA-AN-A046-01 | Breast | breast invasive carcinoma | Female | >=65 | I/II | Unknown | Unknown | SD |
| NCAM2 | SNV | Missense_Mutation | c.1928A>C | p.Lys643Thr | p.K643T | O15394 | protein_coding | tolerated(0.08) | possibly_damaging(0.863) | TCGA-AR-A1AO-01 | Breast | breast invasive carcinoma | Female | <65 | I/II | Chemotherapy | doxorubicin | SD | |
| NCAM2 | SNV | Missense_Mutation | c.628N>A | p.Ala210Thr | p.A210T | O15394 | protein_coding | tolerated(1) | benign(0.026) | TCGA-BH-A0RX-01 | Breast | breast invasive carcinoma | Female | <65 | I/II | Chemotherapy | fluorouracil | SD | |
| NCAM2 | SNV | Missense_Mutation | c.907N>G | p.His303Asp | p.H303D | O15394 | protein_coding | deleterious(0.01) | benign(0.224) | TCGA-C5-A1MN-01 | Cervix | cervical & endocervical cancer | Female | <65 | III/IV | Chemotherapy | cisplatin | SD | |
| NCAM2 | SNV | Missense_Mutation | c.777N>C | p.Leu259Phe | p.L259F | O15394 | protein_coding | tolerated(0.78) | possibly_damaging(0.833) | TCGA-DR-A0ZM-01 | Cervix | cervical & endocervical cancer | Female | <65 | III/IV | Unspecific | Cisplatin | SD | |
| NCAM2 | SNV | Missense_Mutation | c.1468C>A | p.Leu490Ile | p.L490I | O15394 | protein_coding | deleterious(0) | probably_damaging(0.999) | TCGA-FU-A3HZ-01 | Cervix | cervical & endocervical cancer | Female | <65 | I/II | Chemotherapy | cisplatin | CR | |
| NCAM2 | SNV | Missense_Mutation | c.2401N>C | p.Glu801Gln | p.E801Q | O15394 | protein_coding | deleterious(0) | benign(0.242) | TCGA-IR-A3LA-01 | Cervix | cervical & endocervical cancer | Female | <65 | I/II | Chemotherapy | cisplatin | CR | |
| NCAM2 | SNV | Missense_Mutation | c.669G>T | p.Glu223Asp | p.E223D | O15394 | protein_coding | tolerated(1) | benign(0) | TCGA-MA-AA3X-01 | Cervix | cervical & endocervical cancer | Female | <65 | III/IV | Chemotherapy | cisplatin | CR | |
| NCAM2 | SNV | Missense_Mutation | c.862N>C | p.Gly288Arg | p.G288R | O15394 | protein_coding | deleterious(0) | probably_damaging(1) | TCGA-AA-3489-01 | Colorectum | colon adenocarcinoma | Male | >=65 | I/II | Unknown | Unknown | PD |
| Page: 1 2 3 4 5 6 7 8 9 10 11 12 13 14 15 16 17 18 19 20 21 22 23 |
Top |
Related drugs of malignant transformation related genes |
| Identification of chemicals and drugs interact with genes involved in malignant transfromation |
| (DGIdb 4.0) |
| Entrez ID | Symbol | Category | Interaction Types | Drug Claim Name | Drug Name | PMIDs |
| Page: 1 |

Copyright 2023-Present -The University of Texas Health Science Center at Houston |