
|
|||||
|
 | |
| |
| |
| |
| |
| |
|
Gene: NCALD |
Gene summary for NCALD |
| Gene information | Species | Human | Gene symbol | NCALD | Gene ID | 83988 |
| Gene name | neurocalcin delta | |
| Gene Alias | NCALD | |
| Cytomap | 8q22.3 | |
| Gene Type | protein-coding | GO ID | GO:0003008 | UniProtAcc | B2RB70 |
Top |
Malignant transformation analysis |
| Identification of the aberrant gene expression in precancerous and cancerous lesions by comparing the gene expression of stem-like cells in diseased tissues with normal stem cells |
| Entrez ID | Symbol | Replicates | Species | Organ | Tissue | Adj P-value | Log2FC | Malignancy |
| 83988 | NCALD | AEH-subject1 | Human | Endometrium | AEH | 1.14e-22 | 6.36e-01 | -0.3059 |
| 83988 | NCALD | AEH-subject2 | Human | Endometrium | AEH | 4.93e-20 | 6.29e-01 | -0.2525 |
| 83988 | NCALD | AEH-subject3 | Human | Endometrium | AEH | 3.31e-02 | 2.43e-01 | -0.2576 |
| 83988 | NCALD | AEH-subject4 | Human | Endometrium | AEH | 1.74e-14 | 5.68e-01 | -0.2657 |
| 83988 | NCALD | AEH-subject5 | Human | Endometrium | AEH | 2.93e-36 | 9.65e-01 | -0.2953 |
| 83988 | NCALD | EEC-subject1 | Human | Endometrium | EEC | 4.21e-36 | 8.77e-01 | -0.2682 |
| 83988 | NCALD | EEC-subject2 | Human | Endometrium | EEC | 6.16e-27 | 7.44e-01 | -0.2607 |
| 83988 | NCALD | EEC-subject4 | Human | Endometrium | EEC | 7.81e-35 | 9.39e-01 | -0.2571 |
| 83988 | NCALD | EEC-subject5 | Human | Endometrium | EEC | 3.89e-32 | 7.77e-01 | -0.249 |
| 83988 | NCALD | GSM5276935 | Human | Endometrium | EEC | 2.57e-09 | 3.71e-01 | -0.123 |
| 83988 | NCALD | GSM6177621_NYU_UCEC2_lib1_lib1 | Human | Endometrium | EEC | 4.73e-04 | 2.97e-01 | -0.1934 |
| 83988 | NCALD | GSM6177622_NYU_UCEC3_lib1_lib1 | Human | Endometrium | EEC | 9.87e-06 | 1.53e-01 | -0.1917 |
| 83988 | NCALD | P5T-E | Human | Esophagus | ESCC | 4.01e-04 | 4.90e-02 | 0.1327 |
| 83988 | NCALD | P16T-E | Human | Esophagus | ESCC | 2.03e-23 | 8.57e-01 | 0.1153 |
| 83988 | NCALD | P26T-E | Human | Esophagus | ESCC | 8.07e-04 | 2.20e-01 | 0.1276 |
| 83988 | NCALD | P27T-E | Human | Esophagus | ESCC | 8.33e-09 | 3.57e-01 | 0.1055 |
| 83988 | NCALD | P37T-E | Human | Esophagus | ESCC | 3.26e-04 | 4.21e-02 | 0.1371 |
| 83988 | NCALD | P40T-E | Human | Esophagus | ESCC | 5.11e-06 | 1.58e-01 | 0.109 |
| 83988 | NCALD | P54T-E | Human | Esophagus | ESCC | 2.64e-03 | 1.50e-01 | 0.0975 |
| 83988 | NCALD | P61T-E | Human | Esophagus | ESCC | 2.34e-02 | 3.35e-02 | 0.099 |
| Page: 1 2 3 |
| Tissue | Expression Dynamics | Abbreviation |
| Endometrium |  | AEH: Atypical endometrial hyperplasia |
| EEC: Endometrioid Cancer | ||
| Esophagus | 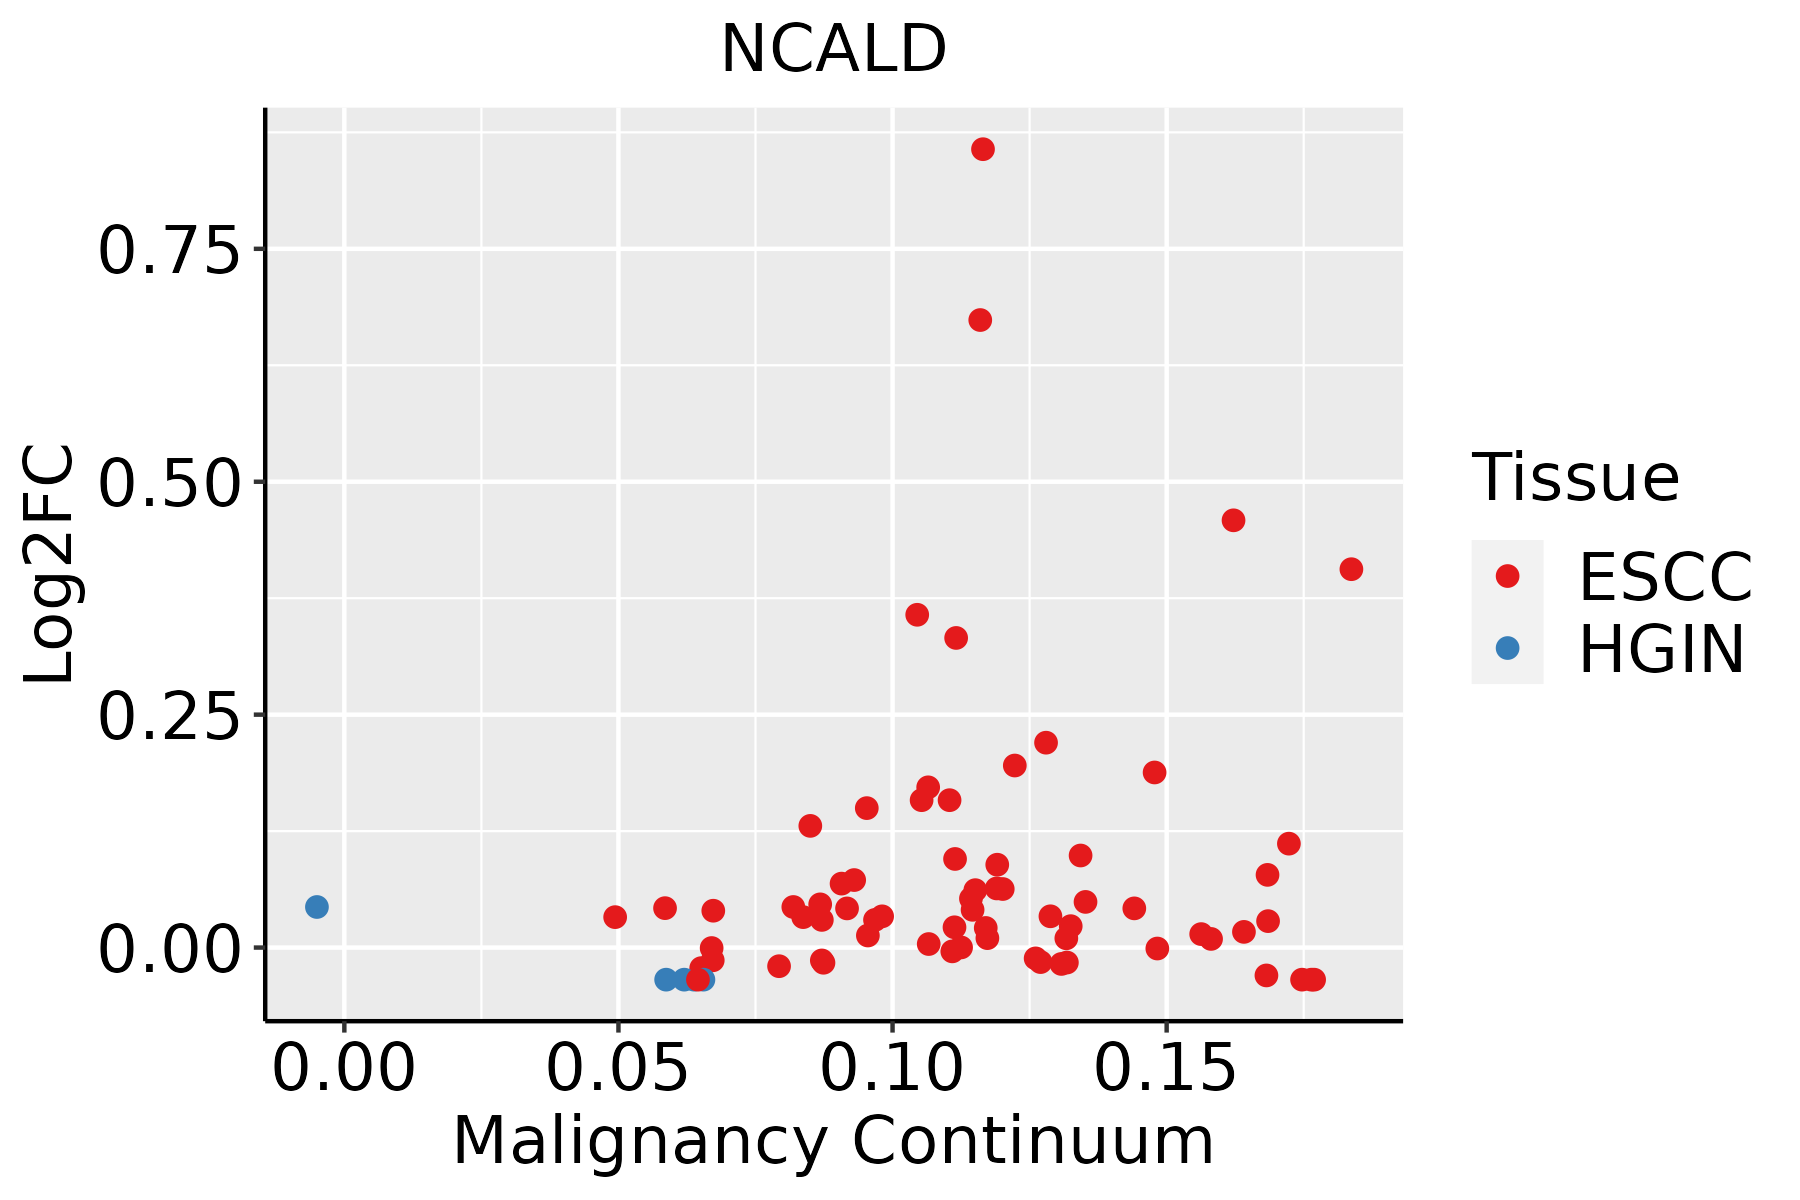 | ESCC: Esophageal squamous cell carcinoma |
| HGIN: High-grade intraepithelial neoplasias | ||
| LGIN: Low-grade intraepithelial neoplasias | ||
| Lung |  | AAH: Atypical adenomatous hyperplasia |
| AIS: Adenocarcinoma in situ | ||
| IAC: Invasive lung adenocarcinoma | ||
| MIA: Minimally invasive adenocarcinoma | ||
| Oral Cavity | 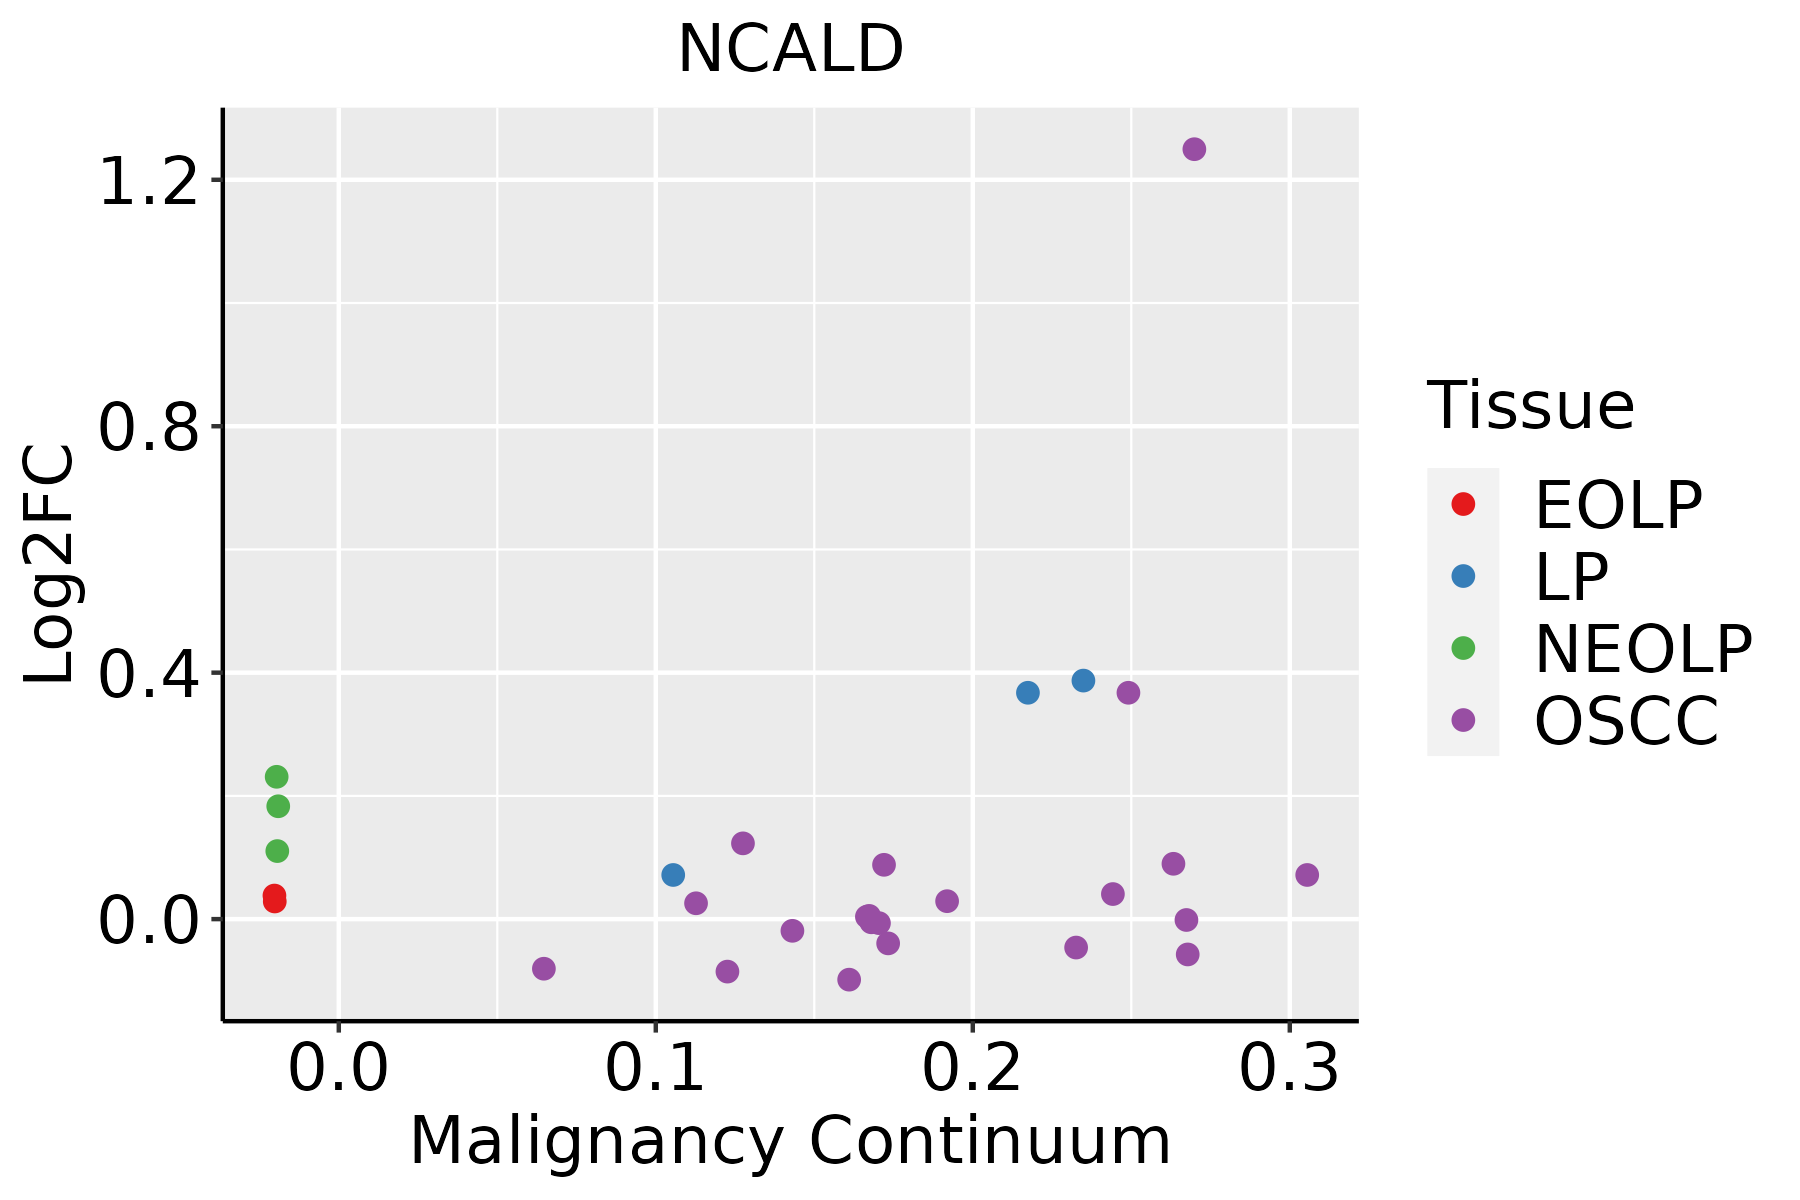 | EOLP: Erosive Oral lichen planus |
| LP: leukoplakia | ||
| NEOLP: Non-erosive oral lichen planus | ||
| OSCC: Oral squamous cell carcinoma |
| ∗log2FC in expression of this searched gene in stem-like cells from each diseased tissue sample relative to stem-like cells in normal samples in each tissue plotted against the malignancy continuum. Samples are colored based on if they are from different disease stage. |
Top |
Malignant transformation related pathway analysis |
| Find out the enriched GO biological processes and KEGG pathways involved in transition from healthy to precancer to cancer |
| Tissue | Disease Stage | Enriched GO biological Processes |
| Colorectum | AD |  |
| Colorectum | SER |  |
| Colorectum | MSS |  |
| Colorectum | MSI-H |  |
| Colorectum | FAP |  |
| ∗Top 15 enriched GO BP terms are showed in the bar plot of each disease state in each tissue. Each row represents a significant GO biological process which is colored according to the -log10(p.adjust). |
| Page: 1 2 3 4 5 6 7 8 9 |
| GO ID | Tissue | Disease Stage | Description | Gene Ratio | Bg Ratio | pvalue | p.adjust | Count |
| GO:0019932 | Lung | AIS | second-messenger-mediated signaling | 46/1849 | 312/18723 | 3.79e-03 | 3.52e-02 | 46 |
| Page: 1 |
| Pathway ID | Tissue | Disease Stage | Description | Gene Ratio | Bg Ratio | pvalue | p.adjust | qvalue | Count |
| Page: 1 |
Top |
Cell-cell communication analysis |
| Identification of potential cell-cell interactions between two cell types and their ligand-receptor pairs for different disease states |
| Ligand | Receptor | LRpair | Pathway | Tissue | Disease Stage |
| Page: 1 |
Top |
Single-cell gene regulatory network inference analysis |
| Find out the significant the regulons (TFs) and the target genes of each regulon across cell types for different disease states |
| TF | Cell Type | Tissue | Disease Stage | Target Gene | RSS | Regulon Activity |
| ∗The dot plots of a searched regulon are shown for all cell subpopulations in each disease state of each tissue based on the regulon specific score inferred using pySCENIC and by calculating the average expression. |
| Page: 1 |
Top |
Somatic mutation of malignant transformation related genes |
| Annotation of somatic variants for genes involved in malignant transformation |
| Hugo Symbol | Variant Class | Variant Classification | dbSNP RS | HGVSc | HGVSp | HGVSp Short | SWISSPROT | BIOTYPE | SIFT | PolyPhen | Tumor Sample Barcode | Tissue | Histology | Sex | Age | Stage | Therapy Types | Drugs | Outcome |
| NCALD | SNV | Missense_Mutation | novel | c.255N>A | p.Phe85Leu | p.F85L | P61601 | protein_coding | deleterious(0) | probably_damaging(0.989) | TCGA-AN-A046-01 | Breast | breast invasive carcinoma | Female | >=65 | I/II | Unknown | Unknown | SD |
| NCALD | SNV | Missense_Mutation | novel | c.76G>A | p.Glu26Lys | p.E26K | P61601 | protein_coding | deleterious(0) | probably_damaging(1) | TCGA-VS-A94X-01 | Cervix | cervical & endocervical cancer | Female | <65 | I/II | Chemotherapy | cisplatin | PD |
| NCALD | SNV | Missense_Mutation | c.111N>A | p.Asp37Glu | p.D37E | P61601 | protein_coding | tolerated(0.11) | benign(0.023) | TCGA-AA-A02W-01 | Colorectum | colon adenocarcinoma | Female | >=65 | I/II | Unknown | Unknown | PD | |
| NCALD | SNV | Missense_Mutation | novel | c.493N>C | p.Ser165Pro | p.S165P | P61601 | protein_coding | deleterious(0) | probably_damaging(0.985) | TCGA-CA-6717-01 | Colorectum | colon adenocarcinoma | Male | <65 | I/II | Chemotherapy | oxaliplatin | CR |
| NCALD | SNV | Missense_Mutation | novel | c.235N>G | p.Thr79Ala | p.T79A | P61601 | protein_coding | tolerated(0.29) | benign(0.129) | TCGA-F5-6814-01 | Colorectum | rectum adenocarcinoma | Male | <65 | I/II | Unknown | Unknown | SD |
| NCALD | insertion | Frame_Shift_Ins | novel | c.117dupC | p.Ser40GlnfsTer10 | p.S40Qfs*10 | P61601 | protein_coding | TCGA-D5-6930-01 | Colorectum | colon adenocarcinoma | Male | >=65 | I/II | Unknown | Unknown | SD | ||
| NCALD | SNV | Missense_Mutation | novel | c.542G>A | p.Arg181His | p.R181H | P61601 | protein_coding | deleterious(0.04) | possibly_damaging(0.465) | TCGA-AJ-A8CW-01 | Endometrium | uterine corpus endometrioid carcinoma | Female | <65 | I/II | Unknown | Unknown | SD |
| NCALD | SNV | Missense_Mutation | novel | c.401N>A | p.Ser134Tyr | p.S134Y | P61601 | protein_coding | deleterious(0) | benign(0.022) | TCGA-AP-A059-01 | Endometrium | uterine corpus endometrioid carcinoma | Female | >=65 | I/II | Unknown | Unknown | SD |
| NCALD | SNV | Missense_Mutation | novel | c.241G>T | p.Asp81Tyr | p.D81Y | P61601 | protein_coding | deleterious(0) | probably_damaging(0.996) | TCGA-AP-A1DV-01 | Endometrium | uterine corpus endometrioid carcinoma | Female | <65 | I/II | Unknown | Unknown | SD |
| NCALD | SNV | Missense_Mutation | novel | c.414N>A | p.Met138Ile | p.M138I | P61601 | protein_coding | tolerated(0.07) | benign(0.007) | TCGA-AX-A06F-01 | Endometrium | uterine corpus endometrioid carcinoma | Female | <65 | III/IV | Chemotherapy | carboplatin | SD |
| Page: 1 2 3 4 |
Top |
Related drugs of malignant transformation related genes |
| Identification of chemicals and drugs interact with genes involved in malignant transfromation |
| (DGIdb 4.0) |
| Entrez ID | Symbol | Category | Interaction Types | Drug Claim Name | Drug Name | PMIDs |
| Page: 1 |

Copyright 2023-Present -The University of Texas Health Science Center at Houston |