
|
|||||
|
 | |
| |
| |
| |
| |
| |
|
Gene: NBPF26 |
Gene summary for NBPF26 |
| Gene information | Species | Human | Gene symbol | NBPF26 | Gene ID | 101060684 |
| Gene name | NBPF member 26 | |
| Gene Alias | NBPF26 | |
| Cytomap | 1p11.2 | |
| Gene Type | protein-coding | GO ID | GO:0005575 | UniProtAcc | NA |
Top |
Malignant transformation analysis |
| Identification of the aberrant gene expression in precancerous and cancerous lesions by comparing the gene expression of stem-like cells in diseased tissues with normal stem cells |
| Entrez ID | Symbol | Replicates | Species | Organ | Tissue | Adj P-value | Log2FC | Malignancy |
| 101060684 | NBPF26 | HTA11_347_2000001011 | Human | Colorectum | AD | 1.31e-10 | 6.22e-01 | -0.1954 |
| 101060684 | NBPF26 | HTA11_99999965104_69814 | Human | Colorectum | MSS | 7.95e-04 | 1.99e-01 | 0.281 |
| 101060684 | NBPF26 | LZE2T | Human | Esophagus | ESCC | 1.07e-06 | 6.75e-01 | 0.082 |
| 101060684 | NBPF26 | LZE4T | Human | Esophagus | ESCC | 5.58e-17 | 4.86e-01 | 0.0811 |
| 101060684 | NBPF26 | LZE5T | Human | Esophagus | ESCC | 1.50e-07 | 6.10e-01 | 0.0514 |
| 101060684 | NBPF26 | LZE7T | Human | Esophagus | ESCC | 1.09e-06 | 3.79e-01 | 0.0667 |
| 101060684 | NBPF26 | LZE20T | Human | Esophagus | ESCC | 3.29e-07 | 2.51e-01 | 0.0662 |
| 101060684 | NBPF26 | LZE21D1 | Human | Esophagus | HGIN | 3.17e-05 | 3.42e-01 | 0.0632 |
| 101060684 | NBPF26 | LZE22D1 | Human | Esophagus | HGIN | 2.41e-04 | 2.17e-01 | 0.0595 |
| 101060684 | NBPF26 | LZE22T | Human | Esophagus | ESCC | 1.17e-04 | 4.45e-01 | 0.068 |
| 101060684 | NBPF26 | LZE24T | Human | Esophagus | ESCC | 2.80e-16 | 4.53e-01 | 0.0596 |
| 101060684 | NBPF26 | LZE21T | Human | Esophagus | ESCC | 6.73e-06 | 3.45e-01 | 0.0655 |
| 101060684 | NBPF26 | LZE6T | Human | Esophagus | ESCC | 1.34e-03 | 2.61e-01 | 0.0845 |
| 101060684 | NBPF26 | P1T-E | Human | Esophagus | ESCC | 6.40e-18 | 8.18e-01 | 0.0875 |
| 101060684 | NBPF26 | P2T-E | Human | Esophagus | ESCC | 7.53e-45 | 8.60e-01 | 0.1177 |
| 101060684 | NBPF26 | P4T-E | Human | Esophagus | ESCC | 7.74e-08 | 2.21e-01 | 0.1323 |
| 101060684 | NBPF26 | P5T-E | Human | Esophagus | ESCC | 1.14e-09 | 1.80e-01 | 0.1327 |
| 101060684 | NBPF26 | P8T-E | Human | Esophagus | ESCC | 1.38e-26 | 3.86e-01 | 0.0889 |
| 101060684 | NBPF26 | P9T-E | Human | Esophagus | ESCC | 1.79e-06 | 1.95e-01 | 0.1131 |
| 101060684 | NBPF26 | P10T-E | Human | Esophagus | ESCC | 2.00e-18 | 3.59e-01 | 0.116 |
| Page: 1 2 3 4 |
| Tissue | Expression Dynamics | Abbreviation |
| Colorectum (GSE201348) |  | FAP: Familial adenomatous polyposis |
| CRC: Colorectal cancer | ||
| Colorectum (HTA11) |  | AD: Adenomas |
| SER: Sessile serrated lesions | ||
| MSI-H: Microsatellite-high colorectal cancer | ||
| MSS: Microsatellite stable colorectal cancer | ||
| Esophagus | 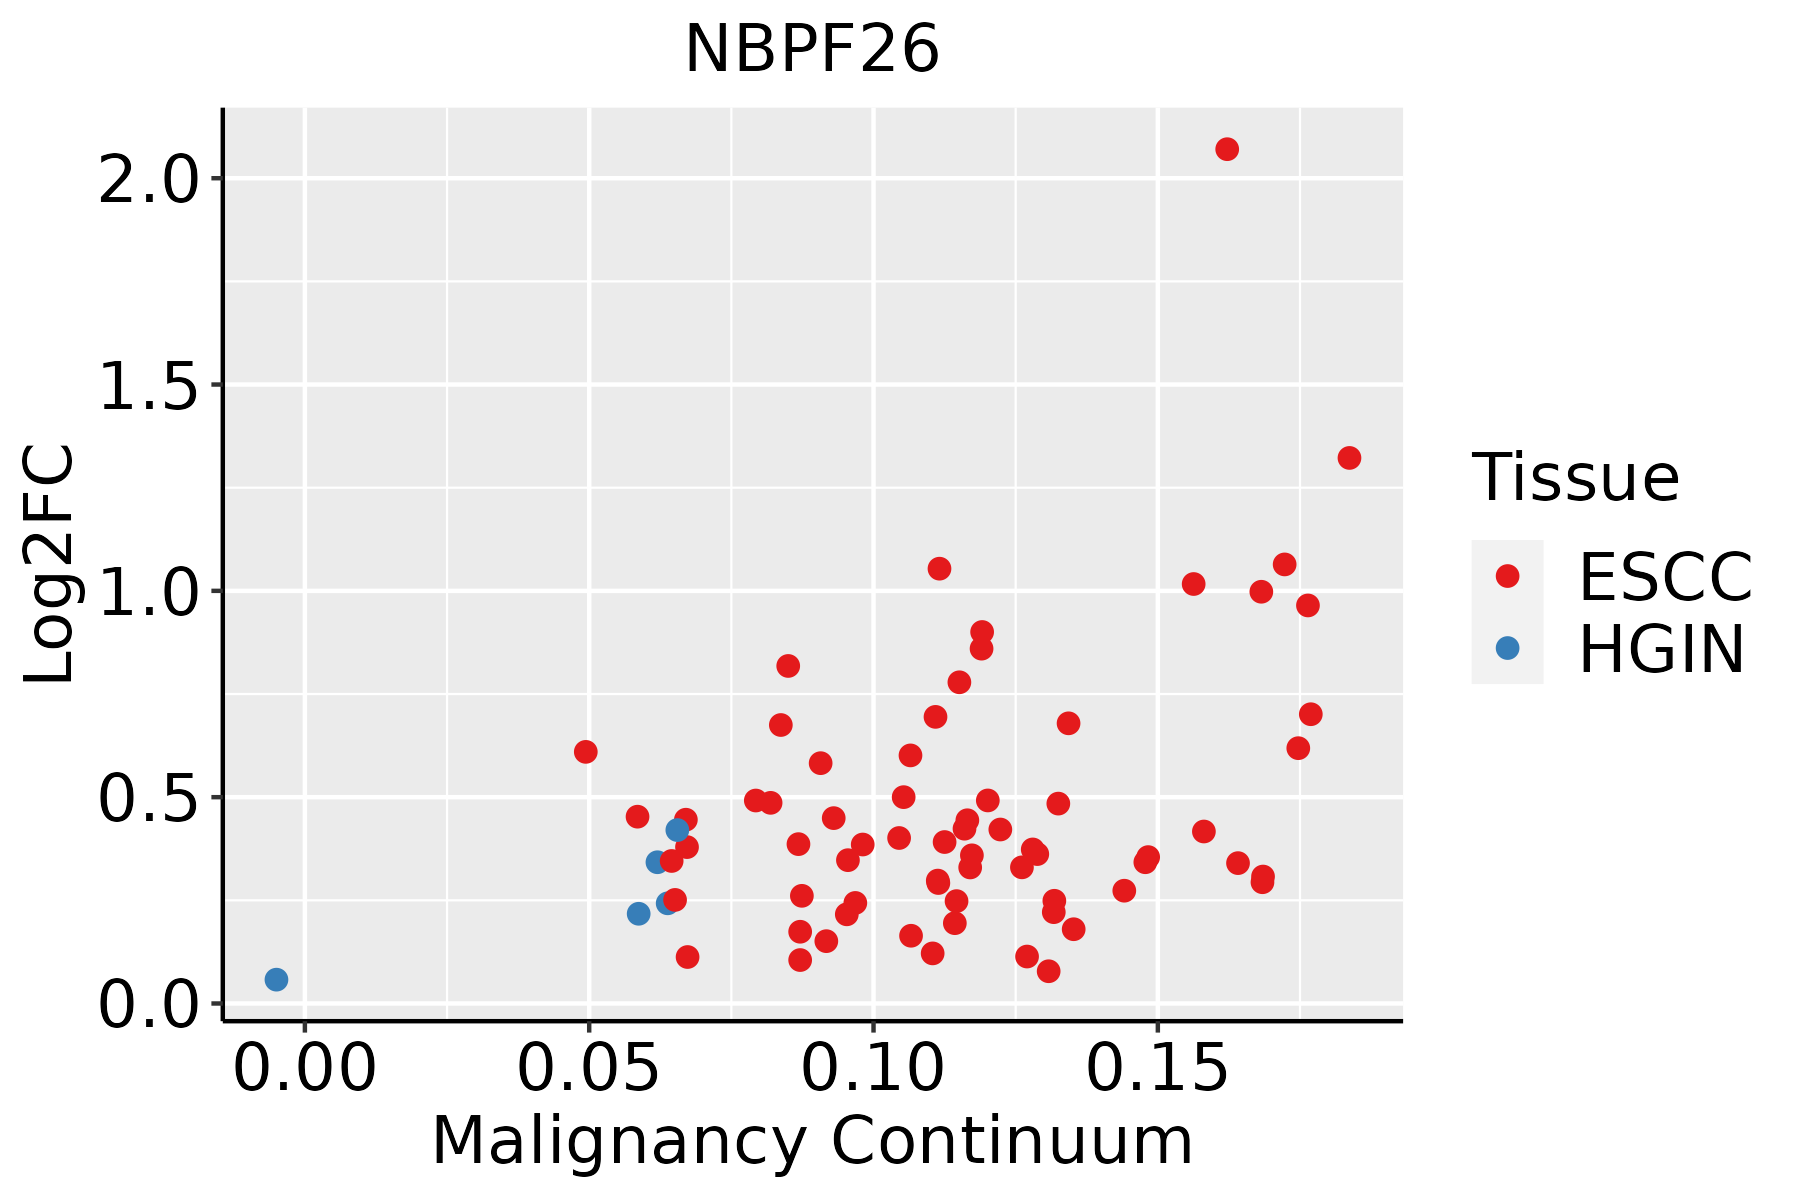 | ESCC: Esophageal squamous cell carcinoma |
| HGIN: High-grade intraepithelial neoplasias | ||
| LGIN: Low-grade intraepithelial neoplasias |
| ∗log2FC in expression of this searched gene in stem-like cells from each diseased tissue sample relative to stem-like cells in normal samples in each tissue plotted against the malignancy continuum. Samples are colored based on if they are from different disease stage. |
Top |
Malignant transformation related pathway analysis |
| Find out the enriched GO biological processes and KEGG pathways involved in transition from healthy to precancer to cancer |
| Tissue | Disease Stage | Enriched GO biological Processes |
| Colorectum | AD |  |
| Colorectum | SER |  |
| Colorectum | MSS |  |
| Colorectum | MSI-H |  |
| Colorectum | FAP |  |
| ∗Top 15 enriched GO BP terms are showed in the bar plot of each disease state in each tissue. Each row represents a significant GO biological process which is colored according to the -log10(p.adjust). |
| Page: 1 2 3 4 5 6 7 8 9 |
| GO ID | Tissue | Disease Stage | Description | Gene Ratio | Bg Ratio | pvalue | p.adjust | Count |
| Page: 1 |
| Pathway ID | Tissue | Disease Stage | Description | Gene Ratio | Bg Ratio | pvalue | p.adjust | qvalue | Count |
| Page: 1 |
Top |
Cell-cell communication analysis |
| Identification of potential cell-cell interactions between two cell types and their ligand-receptor pairs for different disease states |
| Ligand | Receptor | LRpair | Pathway | Tissue | Disease Stage |
| Page: 1 |
Top |
Single-cell gene regulatory network inference analysis |
| Find out the significant the regulons (TFs) and the target genes of each regulon across cell types for different disease states |
| TF | Cell Type | Tissue | Disease Stage | Target Gene | RSS | Regulon Activity |
| ∗The dot plots of a searched regulon are shown for all cell subpopulations in each disease state of each tissue based on the regulon specific score inferred using pySCENIC and by calculating the average expression. |
| Page: 1 |
Top |
Somatic mutation of malignant transformation related genes |
| Annotation of somatic variants for genes involved in malignant transformation |
| Hugo Symbol | Variant Class | Variant Classification | dbSNP RS | HGVSc | HGVSp | HGVSp Short | SWISSPROT | BIOTYPE | SIFT | PolyPhen | Tumor Sample Barcode | Tissue | Histology | Sex | Age | Stage | Therapy Types | Drugs | Outcome |
| NBPF26 | SNV | Missense_Mutation | rs782095139 | c.2500N>T | p.Pro834Ser | p.P834S | protein_coding | tolerated(0.38) | possibly_damaging(0.708) | TCGA-A2-A04Y-01 | Breast | breast invasive carcinoma | Female | <65 | I/II | Chemotherapy | cytoxan | SD | |
| NBPF26 | SNV | Missense_Mutation | novel | c.4214N>C | p.His1405Pro | p.H1405P | protein_coding | tolerated_low_confidence(0.95) | benign(0.017) | TCGA-A2-A0YH-01 | Breast | breast invasive carcinoma | Female | <65 | III/IV | Chemotherapy | adriamycin | SD | |
| NBPF26 | SNV | Missense_Mutation | novel | c.1415N>G | p.Thr472Ser | p.T472S | protein_coding | tolerated(0.12) | possibly_damaging(0.497) | TCGA-A2-A3Y0-01 | Breast | breast invasive carcinoma | Female | <65 | I/II | Chemotherapy | adriamycin | CR | |
| NBPF26 | SNV | Missense_Mutation | novel | c.3773N>C | p.Ile1258Thr | p.I1258T | protein_coding | tolerated(0.4) | benign(0.158) | TCGA-A7-A0CE-01 | Breast | breast invasive carcinoma | Female | <65 | I/II | Chemotherapy | adriamycin | SD | |
| NBPF26 | SNV | Missense_Mutation | novel | c.3773T>C | p.Ile1258Thr | p.I1258T | protein_coding | tolerated(0.4) | benign(0.158) | TCGA-A7-A0CJ-01 | Breast | breast invasive carcinoma | Female | <65 | I/II | Chemotherapy | cytoxan | SD | |
| NBPF26 | SNV | Missense_Mutation | novel | c.1516N>G | p.Arg506Gly | p.R506G | protein_coding | tolerated(0.64) | benign(0.3) | TCGA-A7-A6VY-01 | Breast | breast invasive carcinoma | Female | <65 | I/II | Chemotherapy | cyclophosphamide | CR | |
| NBPF26 | SNV | Missense_Mutation | novel | c.1558C>T | p.Leu520Phe | p.L520F | protein_coding | tolerated(0.07) | possibly_damaging(0.773) | TCGA-AN-A046-01 | Breast | breast invasive carcinoma | Female | >=65 | I/II | Unknown | Unknown | SD | |
| NBPF26 | SNV | Missense_Mutation | novel | c.4298N>A | p.Val1433Glu | p.V1433E | protein_coding | deleterious_low_confidence(0) | benign(0.155) | TCGA-AO-A124-01 | Breast | breast invasive carcinoma | Female | <65 | I/II | Chemotherapy | doxorubicin | SD | |
| NBPF26 | SNV | Missense_Mutation | novel | c.691G>A | p.Val231Ile | p.V231I | protein_coding | deleterious_low_confidence(0) | benign(0.013) | TCGA-2W-A8YY-01 | Cervix | cervical & endocervical cancer | Female | <65 | I/II | Chemotherapy | cisplatin | CR | |
| NBPF26 | SNV | Missense_Mutation | novel | c.853A>G | p.Thr285Ala | p.T285A | protein_coding | deleterious(0.02) | benign(0.202) | TCGA-2W-A8YY-01 | Cervix | cervical & endocervical cancer | Female | <65 | I/II | Chemotherapy | cisplatin | CR |
| Page: 1 2 3 4 5 6 7 8 |
Top |
Related drugs of malignant transformation related genes |
| Identification of chemicals and drugs interact with genes involved in malignant transfromation |
| (DGIdb 4.0) |
| Entrez ID | Symbol | Category | Interaction Types | Drug Claim Name | Drug Name | PMIDs |
| Page: 1 |

Copyright 2023-Present -The University of Texas Health Science Center at Houston |