
|
|||||
|
 | |
| |
| |
| |
| |
| |
|
Gene: NBN |
Gene summary for NBN |
| Gene information | Species | Human | Gene symbol | NBN | Gene ID | 4683 |
| Gene name | nibrin | |
| Gene Alias | AT-V1 | |
| Cytomap | 8q21.3 | |
| Gene Type | protein-coding | GO ID | GO:0000003 | UniProtAcc | A0A0C4DG07 |
Top |
Malignant transformation analysis |
| Identification of the aberrant gene expression in precancerous and cancerous lesions by comparing the gene expression of stem-like cells in diseased tissues with normal stem cells |
| Entrez ID | Symbol | Replicates | Species | Organ | Tissue | Adj P-value | Log2FC | Malignancy |
| 4683 | NBN | LZE4T | Human | Esophagus | ESCC | 6.49e-13 | 4.01e-01 | 0.0811 |
| 4683 | NBN | LZE5T | Human | Esophagus | ESCC | 2.30e-02 | 3.07e-01 | 0.0514 |
| 4683 | NBN | LZE7T | Human | Esophagus | ESCC | 2.56e-07 | 3.33e-01 | 0.0667 |
| 4683 | NBN | LZE8T | Human | Esophagus | ESCC | 6.01e-05 | 1.73e-01 | 0.067 |
| 4683 | NBN | LZE20T | Human | Esophagus | ESCC | 1.29e-03 | 1.48e-01 | 0.0662 |
| 4683 | NBN | LZE22D1 | Human | Esophagus | HGIN | 1.59e-02 | 1.56e-01 | 0.0595 |
| 4683 | NBN | LZE24T | Human | Esophagus | ESCC | 1.05e-17 | 4.19e-01 | 0.0596 |
| 4683 | NBN | P1T-E | Human | Esophagus | ESCC | 6.58e-04 | 3.82e-01 | 0.0875 |
| 4683 | NBN | P2T-E | Human | Esophagus | ESCC | 1.70e-42 | 8.83e-01 | 0.1177 |
| 4683 | NBN | P4T-E | Human | Esophagus | ESCC | 9.00e-33 | 8.25e-01 | 0.1323 |
| 4683 | NBN | P5T-E | Human | Esophagus | ESCC | 3.02e-11 | 2.58e-01 | 0.1327 |
| 4683 | NBN | P8T-E | Human | Esophagus | ESCC | 2.35e-23 | 4.13e-01 | 0.0889 |
| 4683 | NBN | P9T-E | Human | Esophagus | ESCC | 1.78e-15 | 4.08e-01 | 0.1131 |
| 4683 | NBN | P10T-E | Human | Esophagus | ESCC | 2.93e-26 | 4.82e-01 | 0.116 |
| 4683 | NBN | P11T-E | Human | Esophagus | ESCC | 5.01e-18 | 7.83e-01 | 0.1426 |
| 4683 | NBN | P12T-E | Human | Esophagus | ESCC | 3.85e-29 | 6.43e-01 | 0.1122 |
| 4683 | NBN | P15T-E | Human | Esophagus | ESCC | 5.73e-09 | 2.18e-01 | 0.1149 |
| 4683 | NBN | P16T-E | Human | Esophagus | ESCC | 1.05e-57 | 1.05e+00 | 0.1153 |
| 4683 | NBN | P17T-E | Human | Esophagus | ESCC | 7.40e-12 | 4.91e-01 | 0.1278 |
| 4683 | NBN | P19T-E | Human | Esophagus | ESCC | 1.80e-10 | 5.92e-01 | 0.1662 |
| Page: 1 2 3 4 5 6 |
| Tissue | Expression Dynamics | Abbreviation |
| Esophagus | 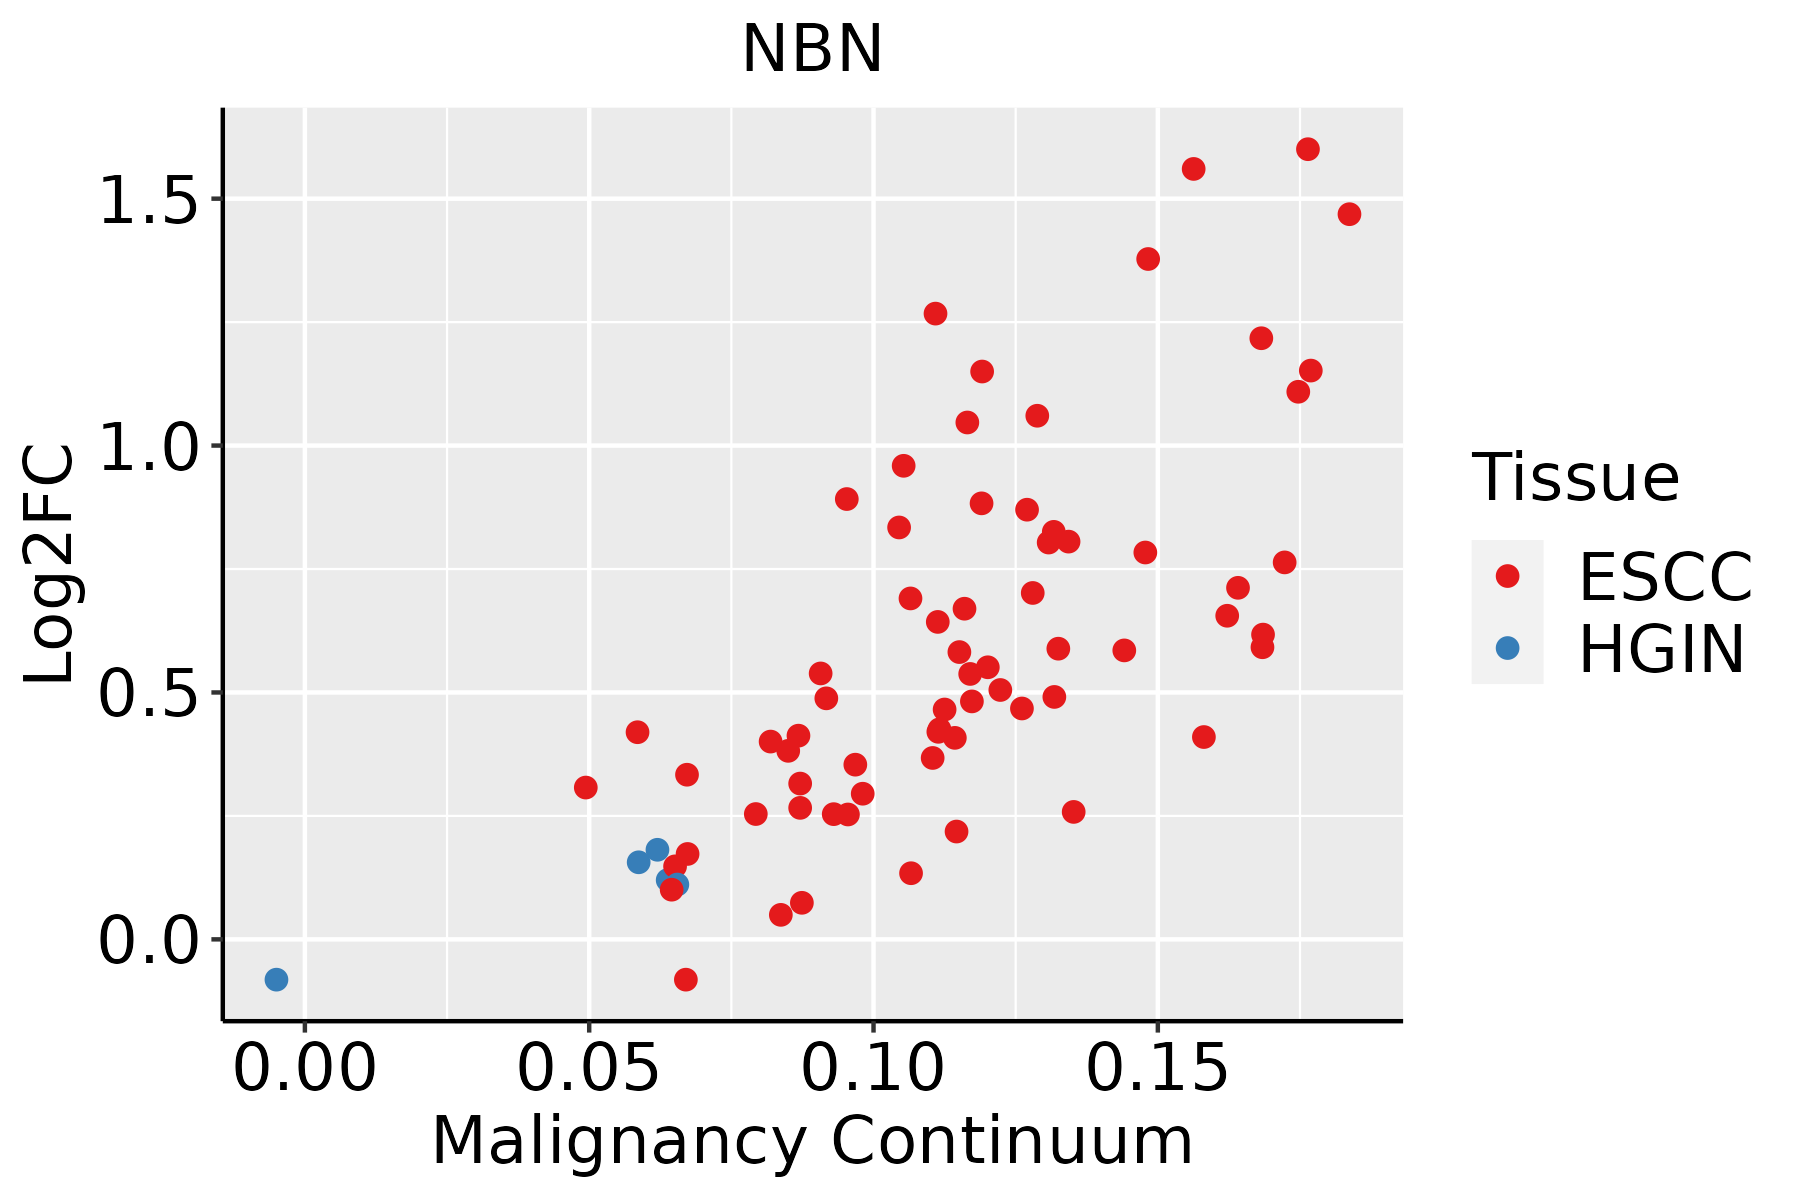 | ESCC: Esophageal squamous cell carcinoma |
| HGIN: High-grade intraepithelial neoplasias | ||
| LGIN: Low-grade intraepithelial neoplasias | ||
| Liver |  | HCC: Hepatocellular carcinoma |
| NAFLD: Non-alcoholic fatty liver disease | ||
| Oral Cavity |  | EOLP: Erosive Oral lichen planus |
| LP: leukoplakia | ||
| NEOLP: Non-erosive oral lichen planus | ||
| OSCC: Oral squamous cell carcinoma | ||
| Skin |  | AK: Actinic keratosis |
| cSCC: Cutaneous squamous cell carcinoma | ||
| SCCIS:squamous cell carcinoma in situ | ||
| Thyroid | 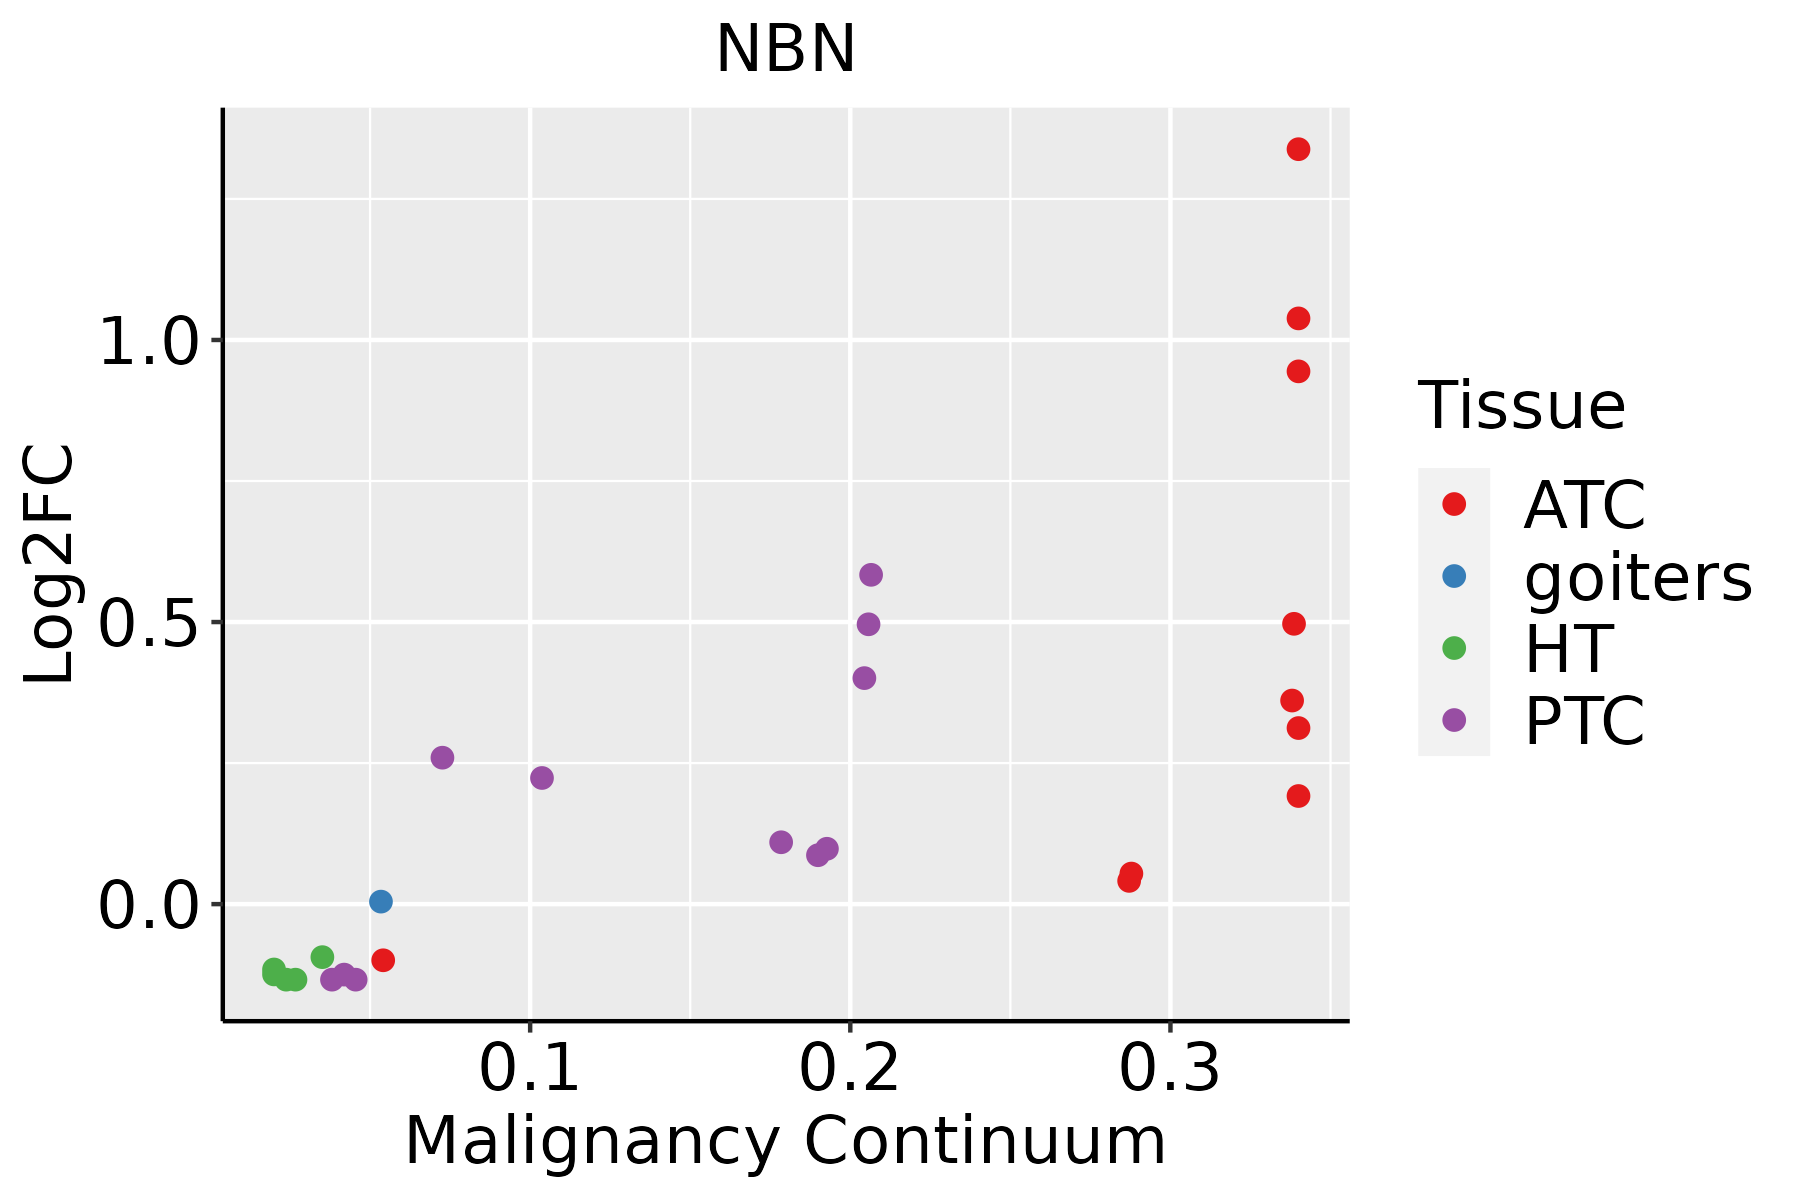 | ATC: Anaplastic thyroid cancer |
| HT: Hashimoto's thyroiditis | ||
| PTC: Papillary thyroid cancer |
| ∗log2FC in expression of this searched gene in stem-like cells from each diseased tissue sample relative to stem-like cells in normal samples in each tissue plotted against the malignancy continuum. Samples are colored based on if they are from different disease stage. |
Top |
Malignant transformation related pathway analysis |
| Find out the enriched GO biological processes and KEGG pathways involved in transition from healthy to precancer to cancer |
| Tissue | Disease Stage | Enriched GO biological Processes |
| Colorectum | AD |  |
| Colorectum | SER |  |
| Colorectum | MSS |  |
| Colorectum | MSI-H |  |
| Colorectum | FAP |  |
| ∗Top 15 enriched GO BP terms are showed in the bar plot of each disease state in each tissue. Each row represents a significant GO biological process which is colored according to the -log10(p.adjust). |
| Page: 1 2 3 4 5 6 7 8 9 |
| GO ID | Tissue | Disease Stage | Description | Gene Ratio | Bg Ratio | pvalue | p.adjust | Count |
| GO:009719327 | Esophagus | HGIN | intrinsic apoptotic signaling pathway | 90/2587 | 288/18723 | 1.50e-14 | 2.80e-12 | 90 |
| GO:007233127 | Esophagus | HGIN | signal transduction by p53 class mediator | 49/2587 | 163/18723 | 5.71e-08 | 3.06e-06 | 49 |
| GO:200125218 | Esophagus | HGIN | positive regulation of chromosome organization | 30/2587 | 82/18723 | 2.00e-07 | 9.68e-06 | 30 |
| GO:00330449 | Esophagus | HGIN | regulation of chromosome organization | 51/2587 | 187/18723 | 8.91e-07 | 3.61e-05 | 51 |
| GO:001063920 | Esophagus | HGIN | negative regulation of organelle organization | 79/2587 | 348/18723 | 4.12e-06 | 1.37e-04 | 79 |
| GO:000072318 | Esophagus | HGIN | telomere maintenance | 38/2587 | 131/18723 | 4.38e-06 | 1.42e-04 | 38 |
| GO:000734610 | Esophagus | HGIN | regulation of mitotic cell cycle | 98/2587 | 457/18723 | 4.39e-06 | 1.42e-04 | 98 |
| GO:003220416 | Esophagus | HGIN | regulation of telomere maintenance | 27/2587 | 80/18723 | 4.83e-06 | 1.56e-04 | 27 |
| GO:003220617 | Esophagus | HGIN | positive regulation of telomere maintenance | 20/2587 | 52/18723 | 8.82e-06 | 2.64e-04 | 20 |
| GO:005105214 | Esophagus | HGIN | regulation of DNA metabolic process | 79/2587 | 359/18723 | 1.38e-05 | 3.85e-04 | 79 |
| GO:003033020 | Esophagus | HGIN | DNA damage response, signal transduction by p53 class mediator | 24/2587 | 72/18723 | 2.03e-05 | 5.43e-04 | 24 |
| GO:00447729 | Esophagus | HGIN | mitotic cell cycle phase transition | 89/2587 | 424/18723 | 2.80e-05 | 7.21e-04 | 89 |
| GO:000170118 | Esophagus | HGIN | in utero embryonic development | 77/2587 | 367/18723 | 9.56e-05 | 2.05e-03 | 77 |
| GO:19019906 | Esophagus | HGIN | regulation of mitotic cell cycle phase transition | 65/2587 | 299/18723 | 1.12e-04 | 2.36e-03 | 65 |
| GO:005105416 | Esophagus | HGIN | positive regulation of DNA metabolic process | 47/2587 | 201/18723 | 1.65e-04 | 3.21e-03 | 47 |
| GO:00323926 | Esophagus | HGIN | DNA geometric change | 25/2587 | 90/18723 | 3.77e-04 | 5.85e-03 | 25 |
| GO:00322007 | Esophagus | HGIN | telomere organization | 38/2587 | 159/18723 | 4.23e-04 | 6.39e-03 | 38 |
| GO:00018244 | Esophagus | HGIN | blastocyst development | 28/2587 | 106/18723 | 4.30e-04 | 6.47e-03 | 28 |
| GO:00427708 | Esophagus | HGIN | signal transduction in response to DNA damage | 39/2587 | 172/18723 | 1.07e-03 | 1.32e-02 | 39 |
| GO:00459305 | Esophagus | HGIN | negative regulation of mitotic cell cycle | 49/2587 | 235/18723 | 1.88e-03 | 2.01e-02 | 49 |
| Page: 1 2 3 4 5 6 7 8 9 10 11 12 13 14 15 16 17 18 19 |
| Pathway ID | Tissue | Disease Stage | Description | Gene Ratio | Bg Ratio | pvalue | p.adjust | qvalue | Count |
| hsa0421828 | Esophagus | HGIN | Cellular senescence | 42/1383 | 156/8465 | 4.94e-04 | 5.03e-03 | 4.00e-03 | 42 |
| hsa04218111 | Esophagus | HGIN | Cellular senescence | 42/1383 | 156/8465 | 4.94e-04 | 5.03e-03 | 4.00e-03 | 42 |
| hsa0421829 | Esophagus | ESCC | Cellular senescence | 119/4205 | 156/8465 | 5.89e-12 | 9.40e-11 | 4.81e-11 | 119 |
| hsa0421838 | Esophagus | ESCC | Cellular senescence | 119/4205 | 156/8465 | 5.89e-12 | 9.40e-11 | 4.81e-11 | 119 |
| hsa0421822 | Liver | HCC | Cellular senescence | 102/4020 | 156/8465 | 4.18e-06 | 3.59e-05 | 2.00e-05 | 102 |
| hsa0421832 | Liver | HCC | Cellular senescence | 102/4020 | 156/8465 | 4.18e-06 | 3.59e-05 | 2.00e-05 | 102 |
| hsa0421820 | Oral cavity | OSCC | Cellular senescence | 112/3704 | 156/8465 | 8.04e-13 | 1.42e-11 | 7.21e-12 | 112 |
| hsa04218110 | Oral cavity | OSCC | Cellular senescence | 112/3704 | 156/8465 | 8.04e-13 | 1.42e-11 | 7.21e-12 | 112 |
| hsa0421827 | Oral cavity | LP | Cellular senescence | 71/2418 | 156/8465 | 4.17e-06 | 3.75e-05 | 2.42e-05 | 71 |
| hsa0421837 | Oral cavity | LP | Cellular senescence | 71/2418 | 156/8465 | 4.17e-06 | 3.75e-05 | 2.42e-05 | 71 |
| Page: 1 |
Top |
Cell-cell communication analysis |
| Identification of potential cell-cell interactions between two cell types and their ligand-receptor pairs for different disease states |
| Ligand | Receptor | LRpair | Pathway | Tissue | Disease Stage |
| Page: 1 |
Top |
Single-cell gene regulatory network inference analysis |
| Find out the significant the regulons (TFs) and the target genes of each regulon across cell types for different disease states |
| TF | Cell Type | Tissue | Disease Stage | Target Gene | RSS | Regulon Activity |
| ∗The dot plots of a searched regulon are shown for all cell subpopulations in each disease state of each tissue based on the regulon specific score inferred using pySCENIC and by calculating the average expression. |
| Page: 1 |
Top |
Somatic mutation of malignant transformation related genes |
| Annotation of somatic variants for genes involved in malignant transformation |
| Hugo Symbol | Variant Class | Variant Classification | dbSNP RS | HGVSc | HGVSp | HGVSp Short | SWISSPROT | BIOTYPE | SIFT | PolyPhen | Tumor Sample Barcode | Tissue | Histology | Sex | Age | Stage | Therapy Types | Drugs | Outcome |
| NBN | SNV | Missense_Mutation | novel | c.638N>T | p.Ser213Leu | p.S213L | O60934 | protein_coding | deleterious(0) | probably_damaging(0.948) | TCGA-A2-A04T-01 | Breast | breast invasive carcinoma | Female | <65 | I/II | Chemotherapy | cyclophosphamide | SD |
| NBN | SNV | Missense_Mutation | novel | c.593N>A | p.Pro198Gln | p.P198Q | O60934 | protein_coding | deleterious(0) | probably_damaging(1) | TCGA-A7-A6VY-01 | Breast | breast invasive carcinoma | Female | <65 | I/II | Chemotherapy | cyclophosphamide | CR |
| NBN | SNV | Missense_Mutation | c.1618N>A | p.His540Asn | p.H540N | O60934 | protein_coding | tolerated(0.55) | benign(0.003) | TCGA-D8-A27G-01 | Breast | breast invasive carcinoma | Female | >=65 | I/II | Unknown | Unknown | SD | |
| NBN | SNV | Missense_Mutation | c.1828N>A | p.Glu610Lys | p.E610K | O60934 | protein_coding | tolerated(0.1) | benign(0.017) | TCGA-GM-A2D9-01 | Breast | breast invasive carcinoma | Female | >=65 | I/II | Hormone Therapy | arimidex | SD | |
| NBN | SNV | Missense_Mutation | c.1618C>T | p.His540Tyr | p.H540Y | O60934 | protein_coding | tolerated(0.9) | benign(0.001) | TCGA-GM-A5PV-01 | Breast | breast invasive carcinoma | Female | <65 | I/II | Chemotherapy | taxotere | CR | |
| NBN | insertion | Nonsense_Mutation | novel | c.2136_2137insTAGGCAAATAATATAAAAGGGGAA | p.His712_Ala713insTer | p.H712_A713ins* | O60934 | protein_coding | TCGA-AR-A0U0-01 | Breast | breast invasive carcinoma | Female | >=65 | I/II | Unknown | Unknown | SD | ||
| NBN | SNV | Missense_Mutation | novel | c.960N>C | p.Lys320Asn | p.K320N | O60934 | protein_coding | deleterious(0.05) | benign(0.048) | TCGA-C5-A8YQ-01 | Cervix | cervical & endocervical cancer | Female | >=65 | I/II | Chemotherapy | cisplatin | PD |
| NBN | SNV | Missense_Mutation | novel | c.403N>A | p.Leu135Ile | p.L135I | O60934 | protein_coding | deleterious(0) | probably_damaging(0.997) | TCGA-C5-A902-01 | Cervix | cervical & endocervical cancer | Female | <65 | I/II | Chemotherapy | cisplatin | SD |
| NBN | SNV | Missense_Mutation | c.631N>C | p.Asp211His | p.D211H | O60934 | protein_coding | deleterious(0) | probably_damaging(1) | TCGA-HM-A4S6-01 | Cervix | cervical & endocervical cancer | Female | <65 | III/IV | Chemotherapy | cisplatin | CR | |
| NBN | SNV | Missense_Mutation | novel | c.593N>A | p.Pro198Gln | p.P198Q | O60934 | protein_coding | deleterious(0) | probably_damaging(1) | TCGA-Q1-A73R-01 | Cervix | cervical & endocervical cancer | Female | <65 | I/II | Unknown | Unknown | SD |
| Page: 1 2 3 4 5 6 7 8 9 10 |
Top |
Related drugs of malignant transformation related genes |
| Identification of chemicals and drugs interact with genes involved in malignant transfromation |
| (DGIdb 4.0) |
| Entrez ID | Symbol | Category | Interaction Types | Drug Claim Name | Drug Name | PMIDs |
| 4683 | NBN | CLINICALLY ACTIONABLE, KINASE, TUMOR SUPPRESSOR | GPI-15427 | 25324139 |
| Page: 1 |

Copyright 2023-Present -The University of Texas Health Science Center at Houston |