
|
|||||
|
 | |
| |
| |
| |
| |
| |
|
Gene: NBEAL1 |
Gene summary for NBEAL1 |
| Gene information | Species | Human | Gene symbol | NBEAL1 | Gene ID | 65065 |
| Gene name | neurobeachin like 1 | |
| Gene Alias | A530083I02Rik | |
| Cytomap | 2q33.2 | |
| Gene Type | protein-coding | GO ID | GO:0008104 | UniProtAcc | Q6ZS30 |
Top |
Malignant transformation analysis |
| Identification of the aberrant gene expression in precancerous and cancerous lesions by comparing the gene expression of stem-like cells in diseased tissues with normal stem cells |
| Entrez ID | Symbol | Replicates | Species | Organ | Tissue | Adj P-value | Log2FC | Malignancy |
| 65065 | NBEAL1 | GSM4909281 | Human | Breast | IDC | 3.59e-06 | 3.66e-01 | 0.21 |
| 65065 | NBEAL1 | GSM4909285 | Human | Breast | IDC | 7.37e-06 | -2.37e-01 | 0.21 |
| 65065 | NBEAL1 | GSM4909286 | Human | Breast | IDC | 7.05e-04 | -4.41e-02 | 0.1081 |
| 65065 | NBEAL1 | GSM4909287 | Human | Breast | IDC | 1.35e-14 | -4.45e-01 | 0.2057 |
| 65065 | NBEAL1 | GSM4909288 | Human | Breast | IDC | 2.86e-05 | -4.80e-01 | 0.0988 |
| 65065 | NBEAL1 | GSM4909293 | Human | Breast | IDC | 1.72e-06 | -2.40e-01 | 0.1581 |
| 65065 | NBEAL1 | GSM4909294 | Human | Breast | IDC | 3.03e-10 | -3.23e-01 | 0.2022 |
| 65065 | NBEAL1 | GSM4909296 | Human | Breast | IDC | 1.18e-15 | -3.67e-01 | 0.1524 |
| 65065 | NBEAL1 | GSM4909297 | Human | Breast | IDC | 4.68e-30 | 3.36e-01 | 0.1517 |
| 65065 | NBEAL1 | GSM4909299 | Human | Breast | IDC | 2.87e-06 | 4.31e-01 | 0.035 |
| 65065 | NBEAL1 | GSM4909301 | Human | Breast | IDC | 3.82e-03 | -2.13e-01 | 0.1577 |
| 65065 | NBEAL1 | GSM4909304 | Human | Breast | IDC | 1.14e-08 | -4.21e-01 | 0.1636 |
| 65065 | NBEAL1 | GSM4909309 | Human | Breast | IDC | 2.06e-05 | -2.88e-01 | 0.0483 |
| 65065 | NBEAL1 | GSM4909311 | Human | Breast | IDC | 2.69e-36 | -2.82e-01 | 0.1534 |
| 65065 | NBEAL1 | GSM4909312 | Human | Breast | IDC | 1.24e-23 | -4.90e-01 | 0.1552 |
| 65065 | NBEAL1 | GSM4909313 | Human | Breast | IDC | 1.27e-12 | -4.07e-01 | 0.0391 |
| 65065 | NBEAL1 | GSM4909316 | Human | Breast | IDC | 8.50e-03 | -4.01e-01 | 0.21 |
| 65065 | NBEAL1 | GSM4909317 | Human | Breast | IDC | 5.41e-06 | -3.38e-01 | 0.1355 |
| 65065 | NBEAL1 | GSM4909319 | Human | Breast | IDC | 1.34e-38 | -5.92e-01 | 0.1563 |
| 65065 | NBEAL1 | GSM4909320 | Human | Breast | IDC | 2.89e-09 | 8.71e-02 | 0.1575 |
| Page: 1 2 3 4 5 6 7 8 9 10 11 12 13 14 15 16 17 |
| Tissue | Expression Dynamics | Abbreviation |
| Breast |  | IDC: Invasive ductal carcinoma |
| DCIS: Ductal carcinoma in situ | ||
| Precancer(BRCA1-mut): Precancerous lesion from BRCA1 mutation carriers | ||
| Cervix | 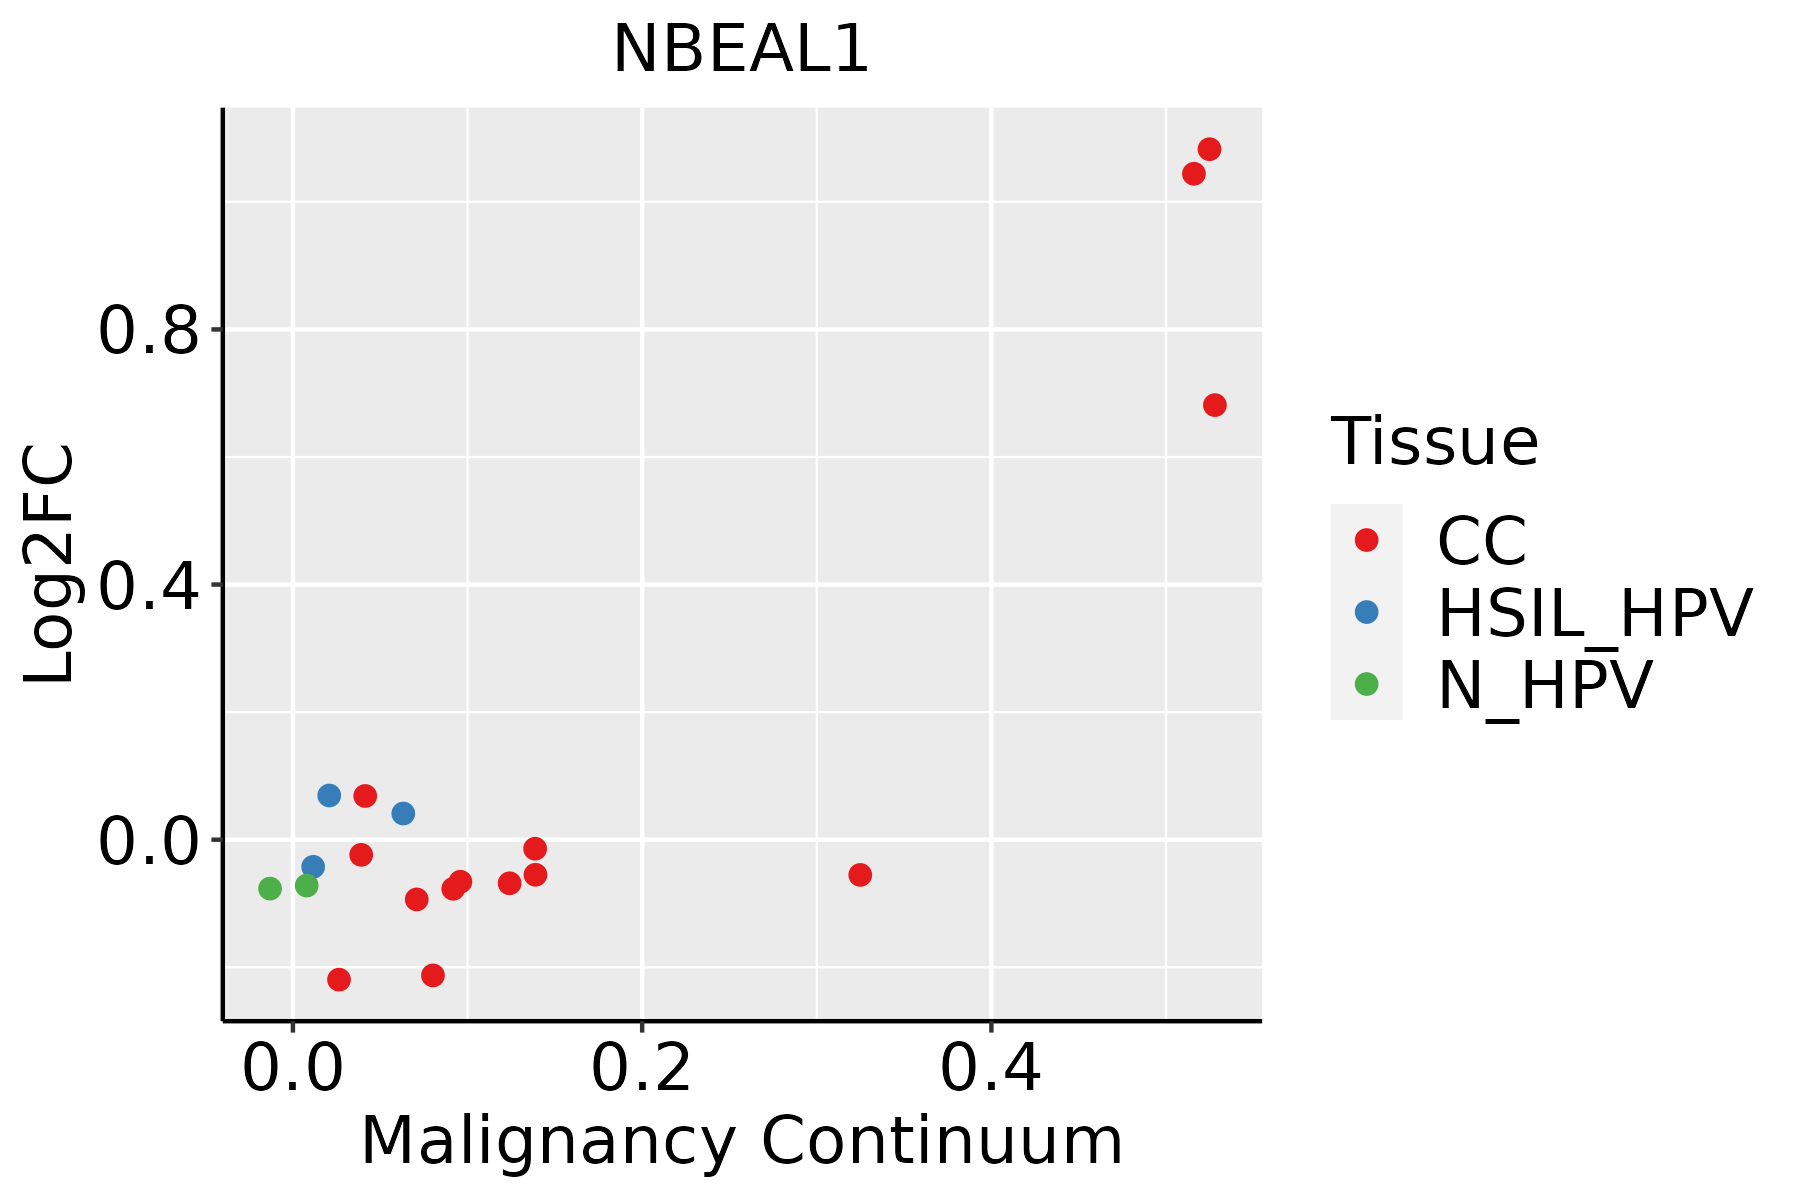 | CC: Cervix cancer |
| HSIL_HPV: HPV-infected high-grade squamous intraepithelial lesions | ||
| N_HPV: HPV-infected normal cervix | ||
| Colorectum (GSE201348) |  | FAP: Familial adenomatous polyposis |
| CRC: Colorectal cancer | ||
| Colorectum (HTA11) |  | AD: Adenomas |
| SER: Sessile serrated lesions | ||
| MSI-H: Microsatellite-high colorectal cancer | ||
| MSS: Microsatellite stable colorectal cancer | ||
| Endometrium | 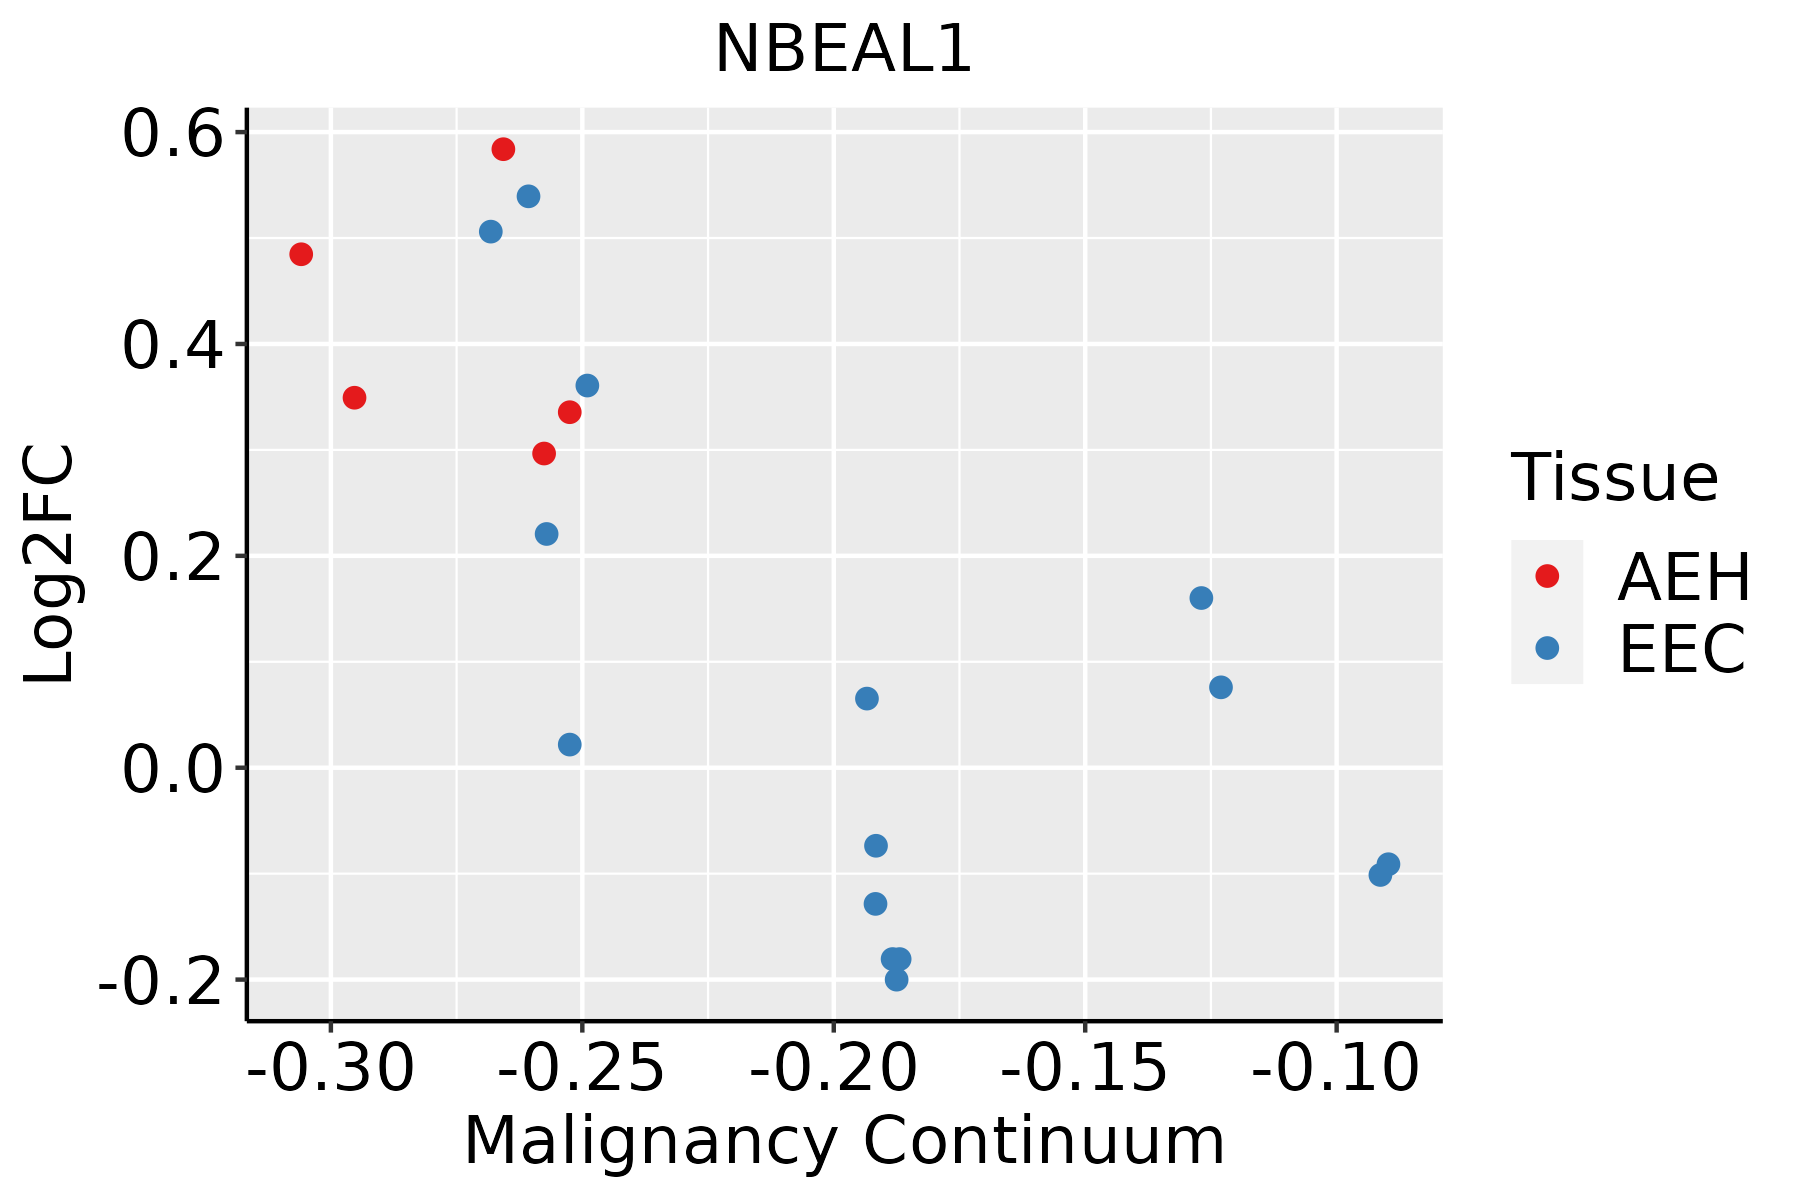 | AEH: Atypical endometrial hyperplasia |
| EEC: Endometrioid Cancer | ||
| Esophagus | 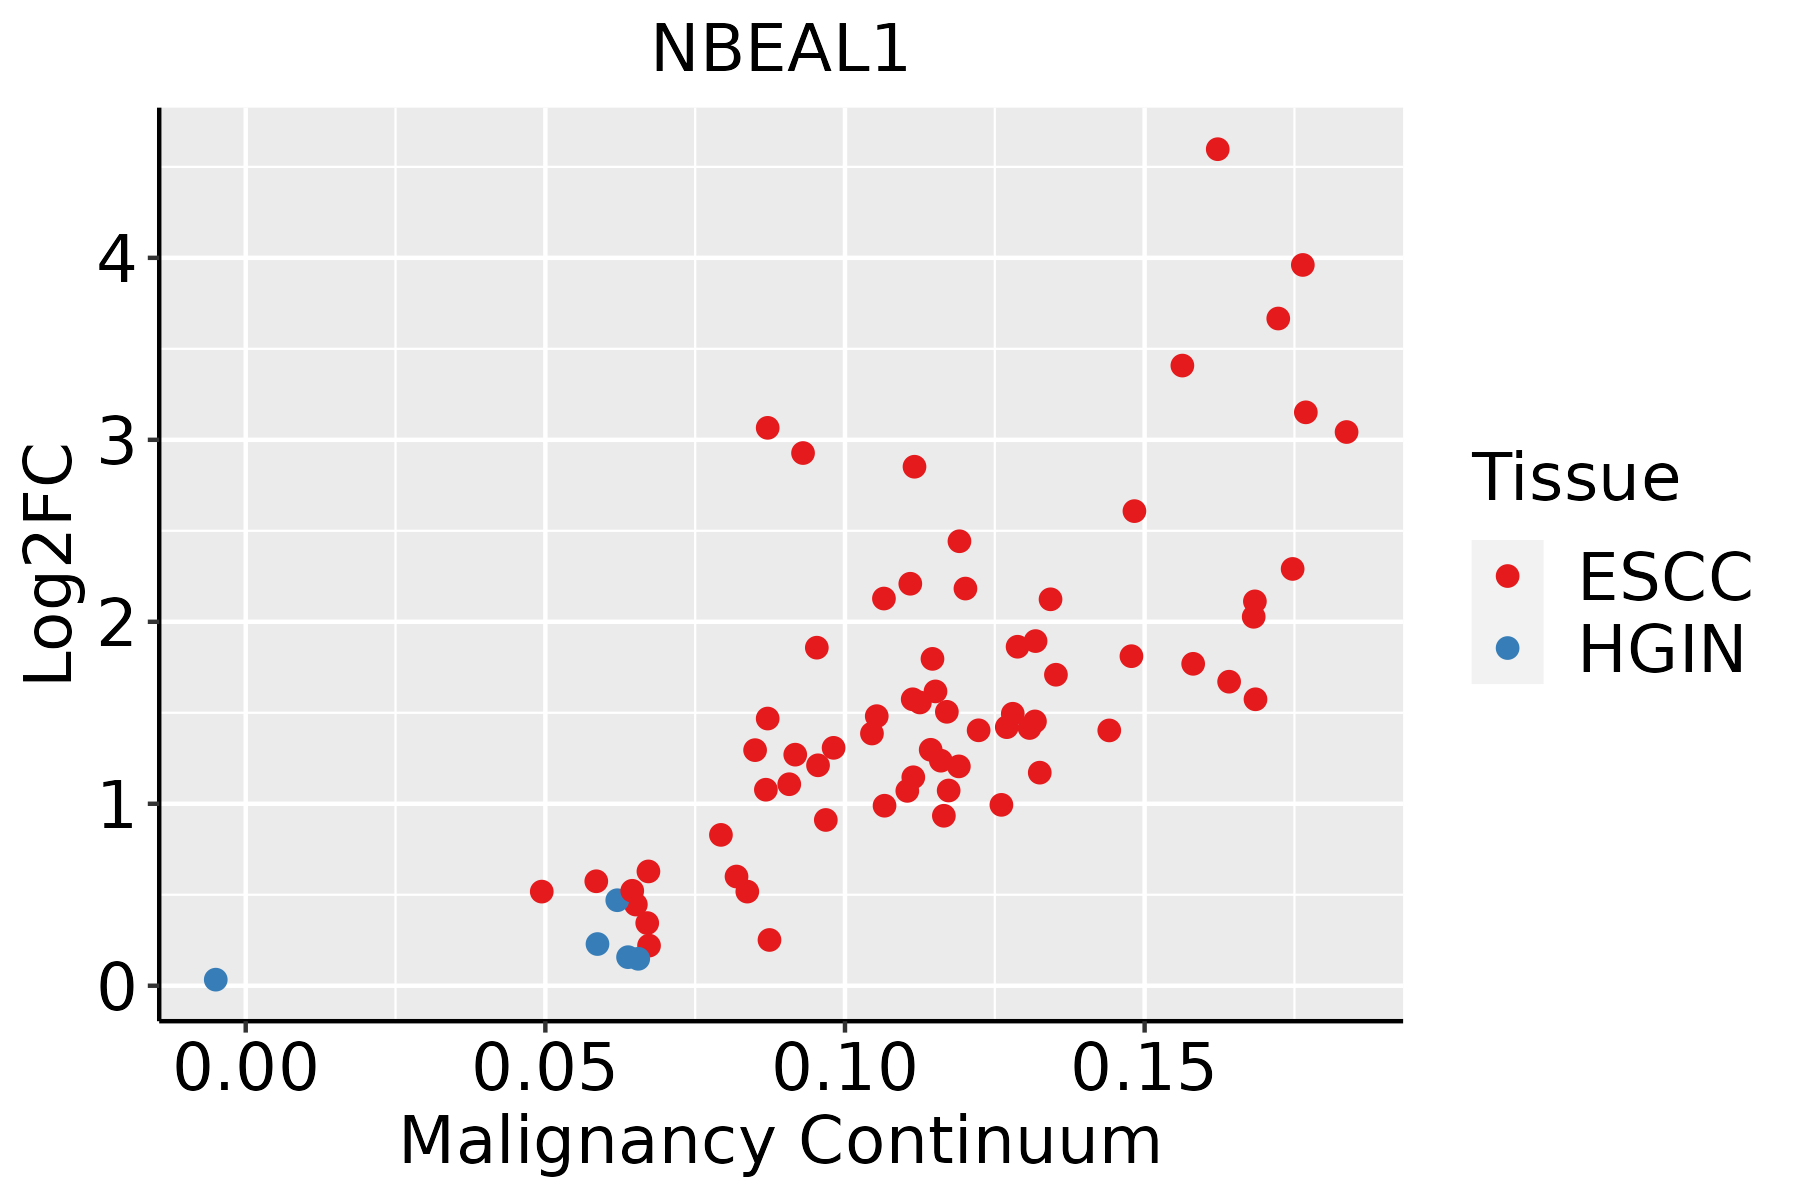 | ESCC: Esophageal squamous cell carcinoma |
| HGIN: High-grade intraepithelial neoplasias | ||
| LGIN: Low-grade intraepithelial neoplasias | ||
| GC |  | CAG: Chronic atrophic gastritis |
| CAG with IM: Chronic atrophic gastritis with intestinal metaplasia | ||
| CSG: Chronic superficial gastritis | ||
| GC: Gastric cancer | ||
| SIM: Severe intestinal metaplasia | ||
| WIM: Wild intestinal metaplasia | ||
| Liver | 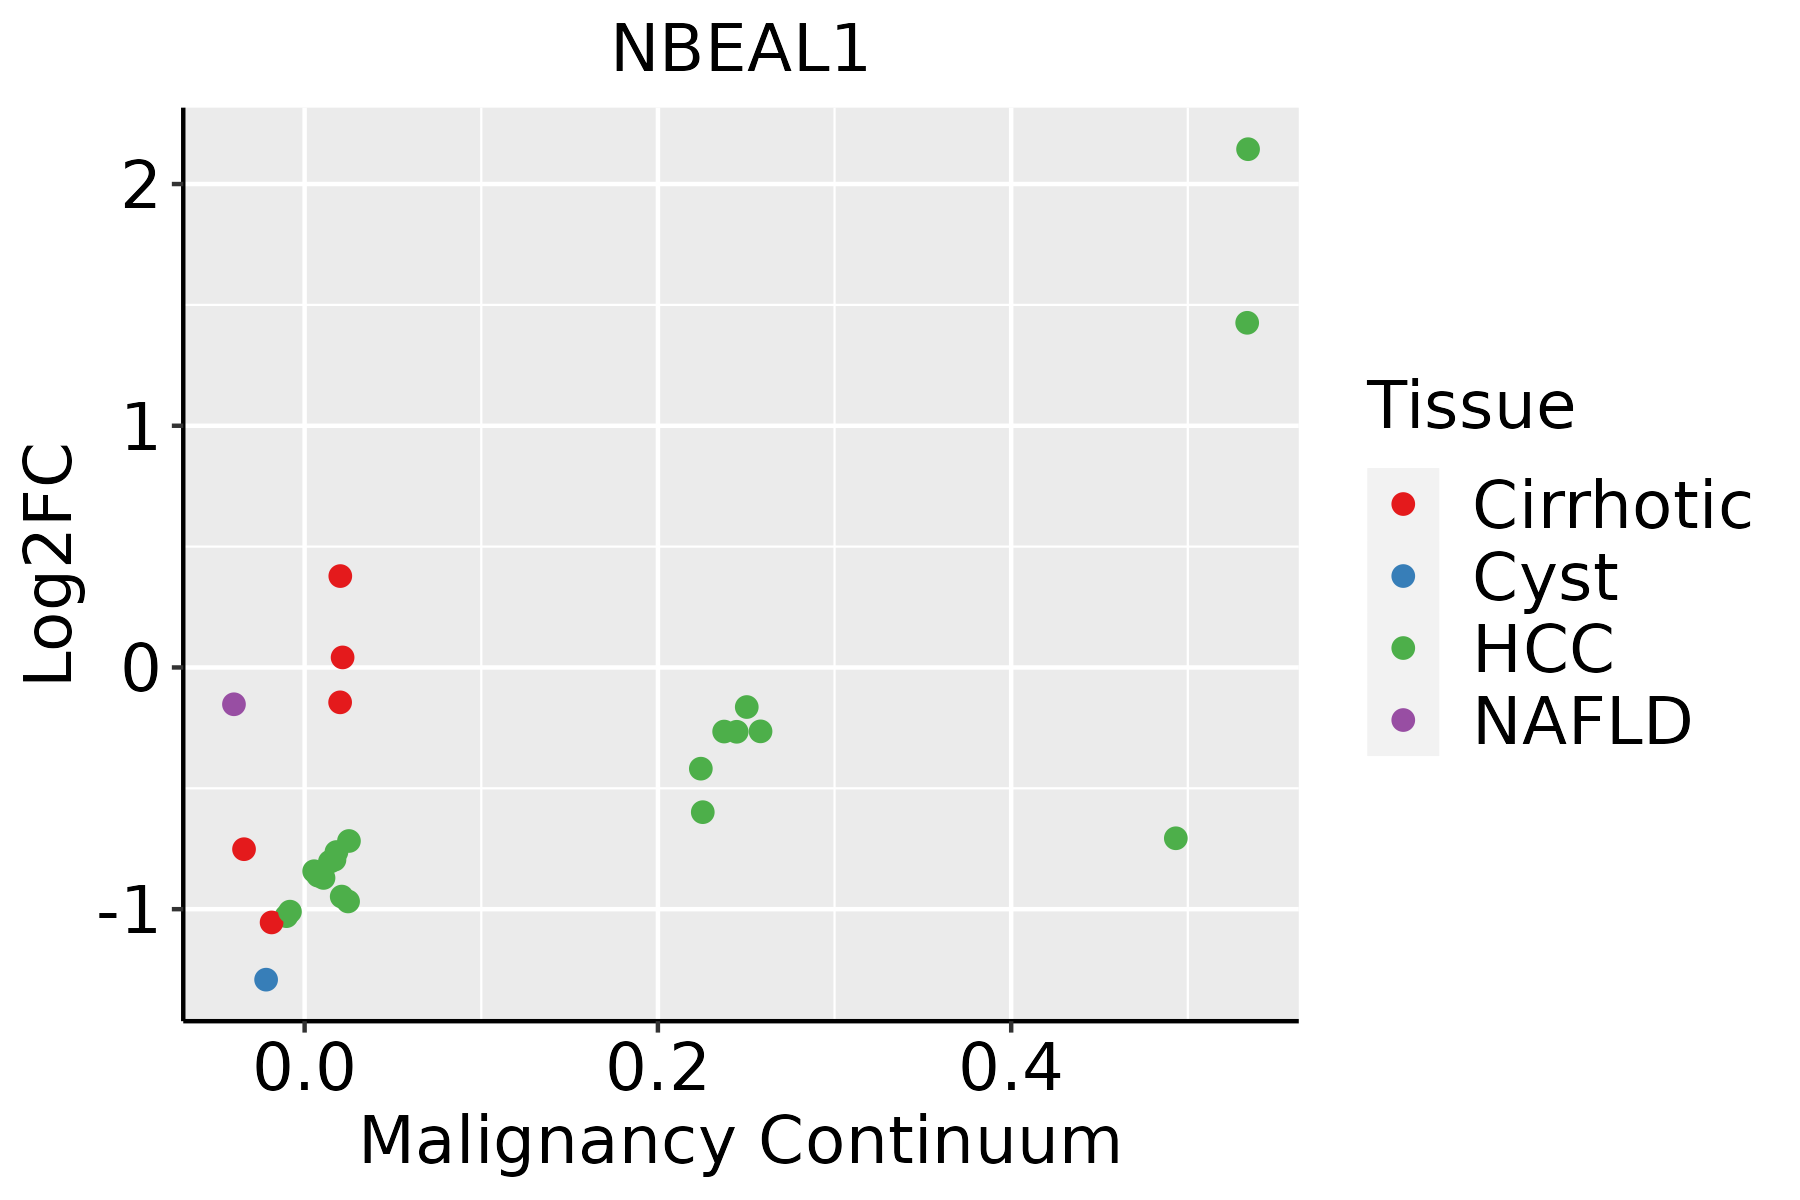 | HCC: Hepatocellular carcinoma |
| NAFLD: Non-alcoholic fatty liver disease | ||
| Lung | 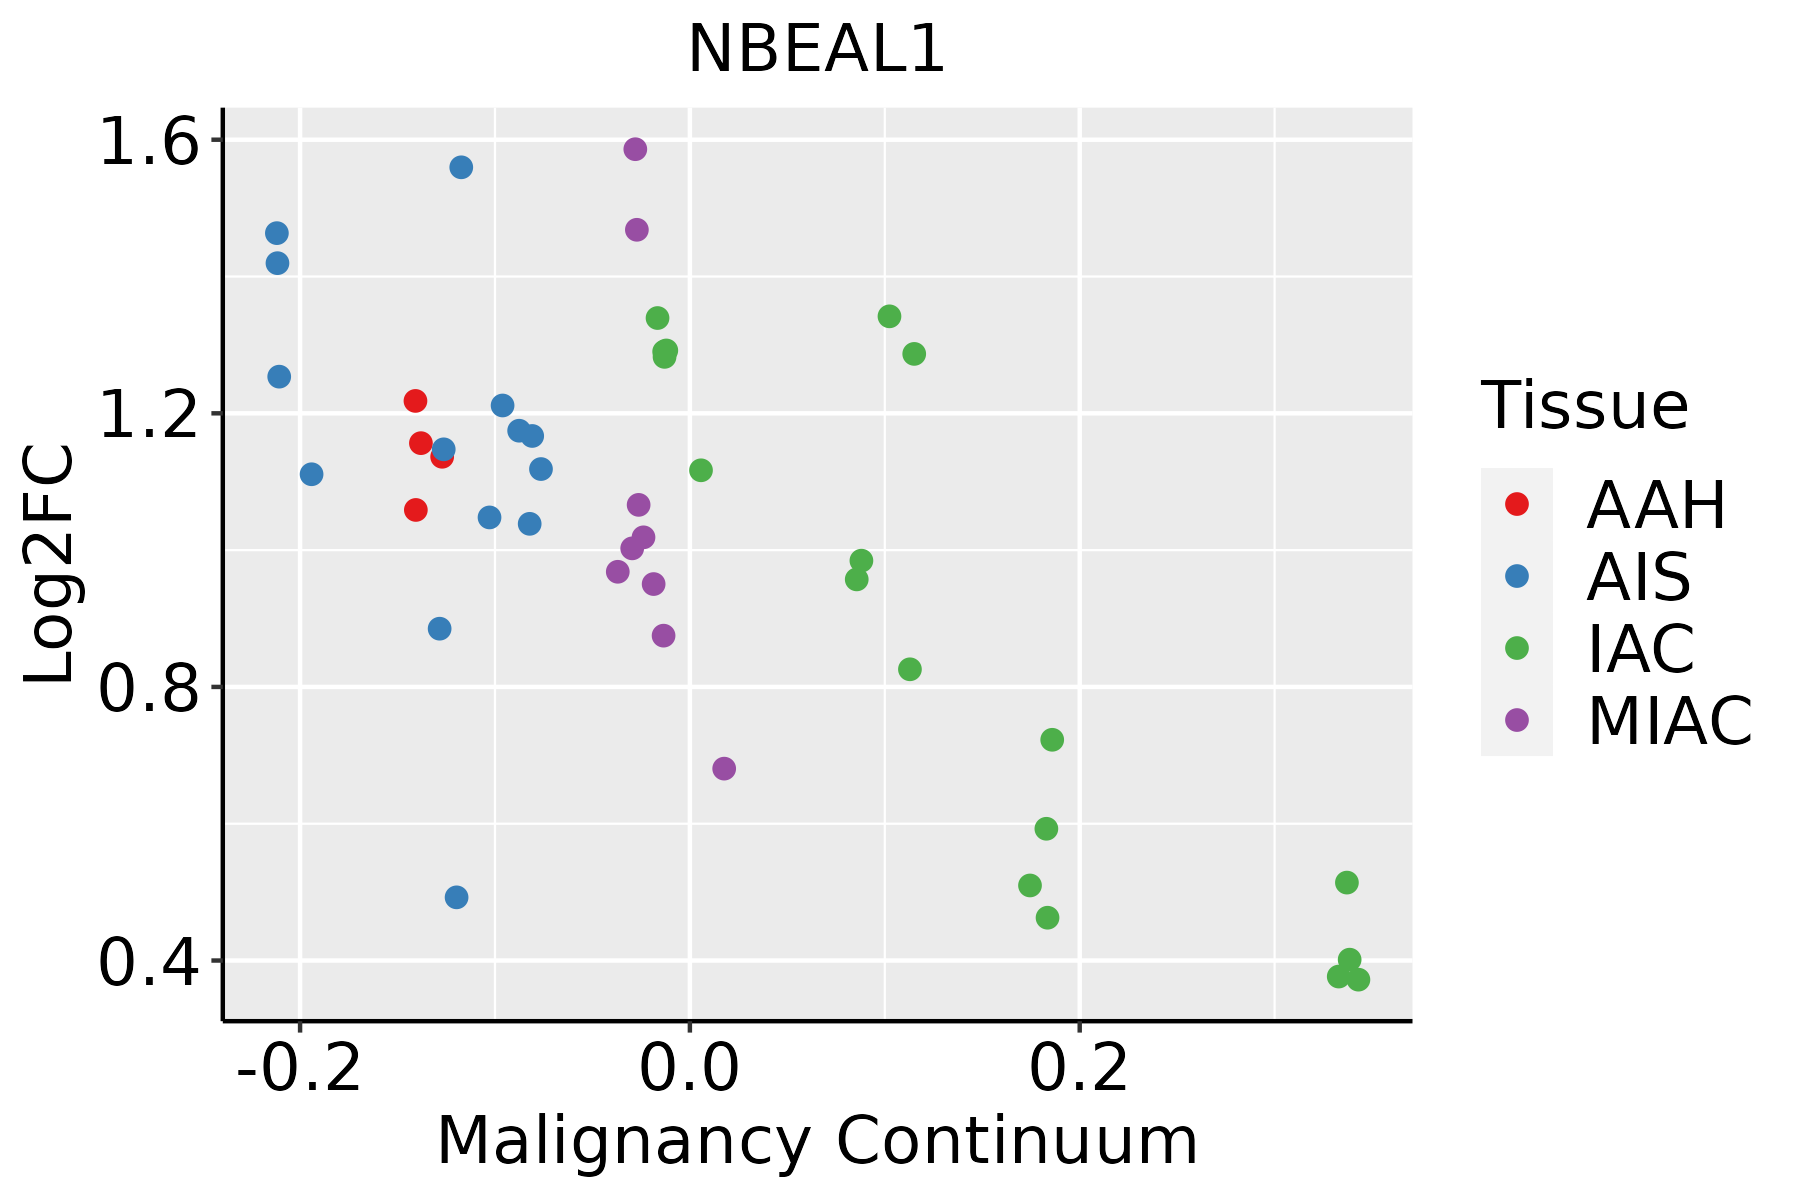 | AAH: Atypical adenomatous hyperplasia |
| AIS: Adenocarcinoma in situ | ||
| IAC: Invasive lung adenocarcinoma | ||
| MIA: Minimally invasive adenocarcinoma | ||
| Oral Cavity | 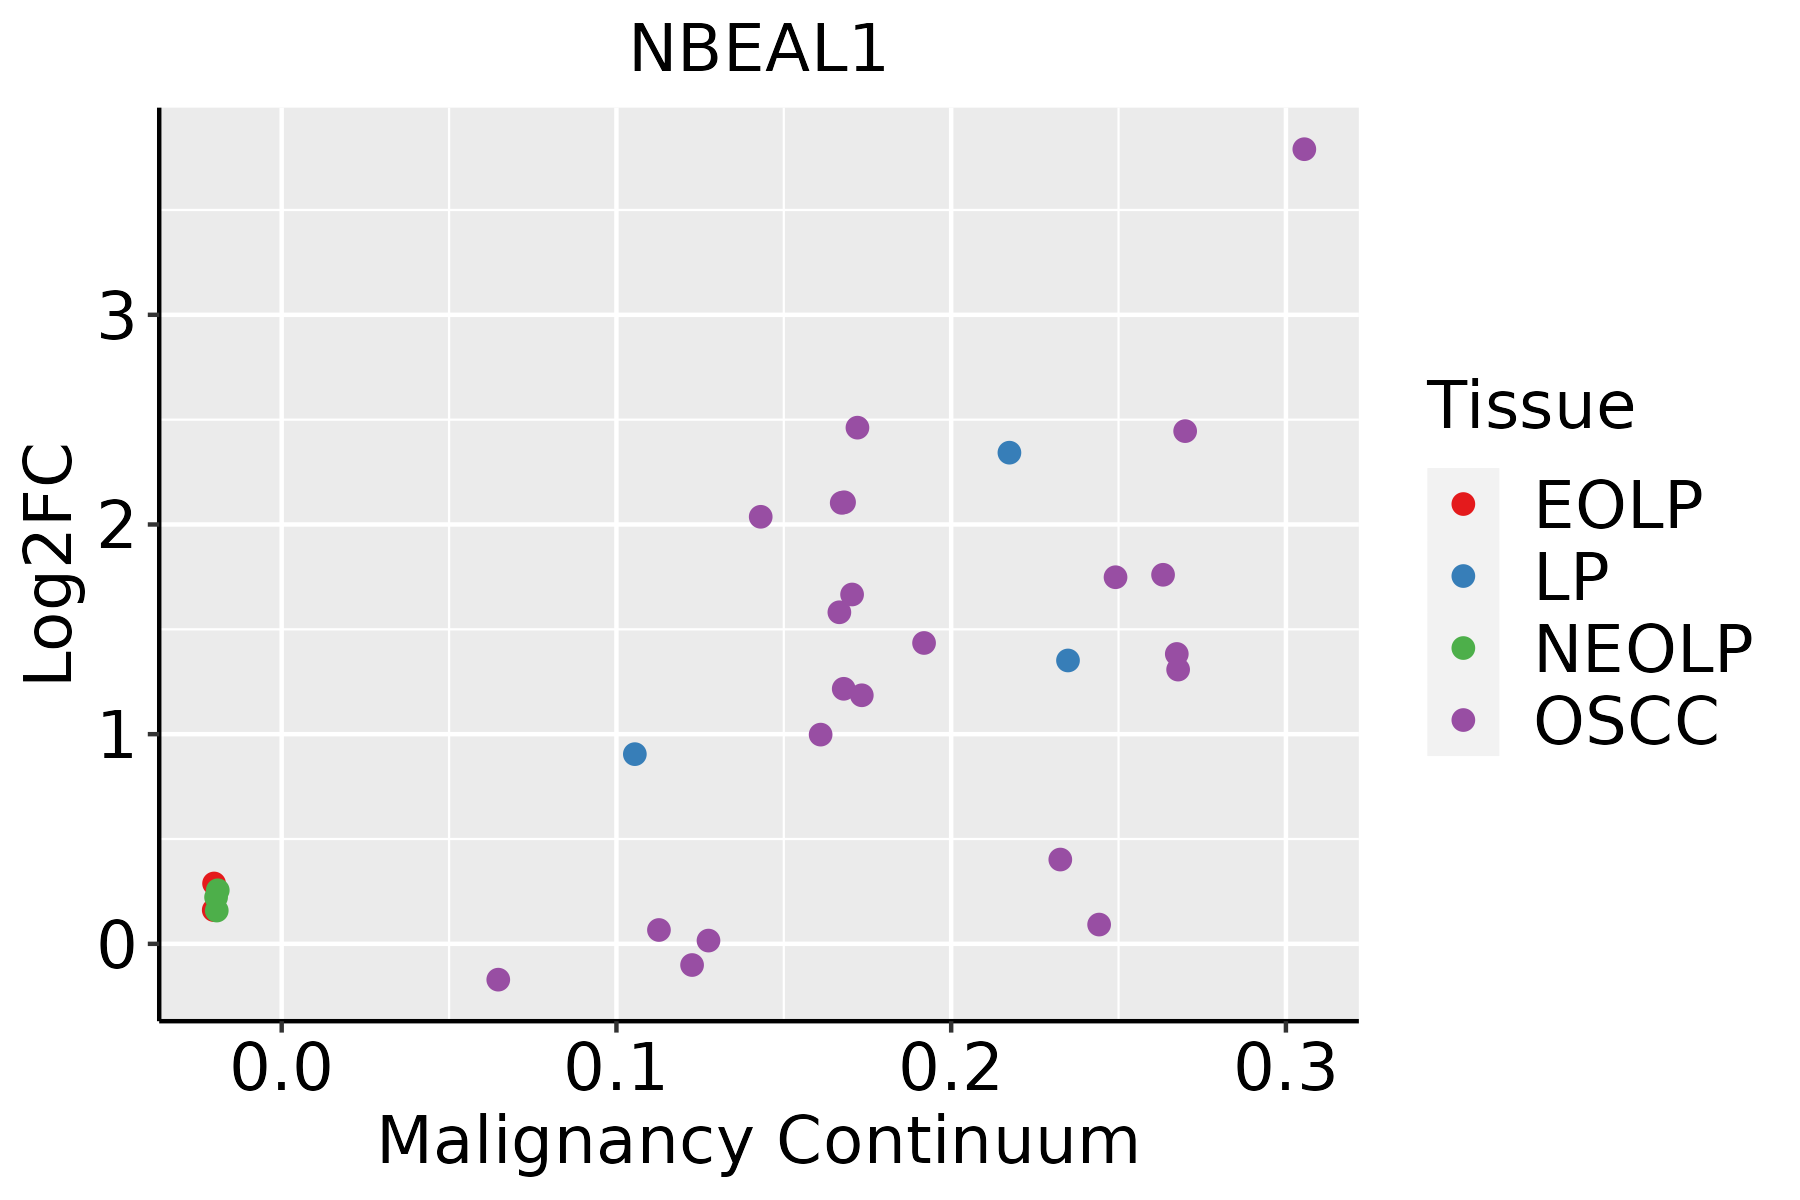 | EOLP: Erosive Oral lichen planus |
| LP: leukoplakia | ||
| NEOLP: Non-erosive oral lichen planus | ||
| OSCC: Oral squamous cell carcinoma | ||
| Prostate |  | BPH: Benign Prostatic Hyperplasia |
| Skin |  | AK: Actinic keratosis |
| cSCC: Cutaneous squamous cell carcinoma | ||
| SCCIS:squamous cell carcinoma in situ | ||
| Thyroid |  | ATC: Anaplastic thyroid cancer |
| HT: Hashimoto's thyroiditis | ||
| PTC: Papillary thyroid cancer |
| ∗log2FC in expression of this searched gene in stem-like cells from each diseased tissue sample relative to stem-like cells in normal samples in each tissue plotted against the malignancy continuum. Samples are colored based on if they are from different disease stage. |
Top |
Malignant transformation related pathway analysis |
| Find out the enriched GO biological processes and KEGG pathways involved in transition from healthy to precancer to cancer |
| Tissue | Disease Stage | Enriched GO biological Processes |
| Colorectum | AD |  |
| Colorectum | SER |  |
| Colorectum | MSS |  |
| Colorectum | MSI-H |  |
| Colorectum | FAP |  |
| ∗Top 15 enriched GO BP terms are showed in the bar plot of each disease state in each tissue. Each row represents a significant GO biological process which is colored according to the -log10(p.adjust). |
| Page: 1 2 3 4 5 6 7 8 9 |
| GO ID | Tissue | Disease Stage | Description | Gene Ratio | Bg Ratio | pvalue | p.adjust | Count |
| Page: 1 |
| Pathway ID | Tissue | Disease Stage | Description | Gene Ratio | Bg Ratio | pvalue | p.adjust | qvalue | Count |
| Page: 1 |
Top |
Cell-cell communication analysis |
| Identification of potential cell-cell interactions between two cell types and their ligand-receptor pairs for different disease states |
| Ligand | Receptor | LRpair | Pathway | Tissue | Disease Stage |
| Page: 1 |
Top |
Single-cell gene regulatory network inference analysis |
| Find out the significant the regulons (TFs) and the target genes of each regulon across cell types for different disease states |
| TF | Cell Type | Tissue | Disease Stage | Target Gene | RSS | Regulon Activity |
| ∗The dot plots of a searched regulon are shown for all cell subpopulations in each disease state of each tissue based on the regulon specific score inferred using pySCENIC and by calculating the average expression. |
| Page: 1 |
Top |
Somatic mutation of malignant transformation related genes |
| Annotation of somatic variants for genes involved in malignant transformation |
| Hugo Symbol | Variant Class | Variant Classification | dbSNP RS | HGVSc | HGVSp | HGVSp Short | SWISSPROT | BIOTYPE | SIFT | PolyPhen | Tumor Sample Barcode | Tissue | Histology | Sex | Age | Stage | Therapy Types | Drugs | Outcome |
| NBEAL1 | SNV | Missense_Mutation | c.4429N>A | p.Pro1477Thr | p.P1477T | Q6ZS30 | protein_coding | deleterious(0.01) | benign(0.024) | TCGA-A1-A0SN-01 | Breast | breast invasive carcinoma | Female | <65 | I/II | Chemotherapy | ac | SD | |
| NBEAL1 | SNV | Missense_Mutation | c.4433N>T | p.Gly1478Val | p.G1478V | Q6ZS30 | protein_coding | deleterious(0.01) | benign(0.005) | TCGA-A2-A0D4-01 | Breast | breast invasive carcinoma | Female | <65 | I/II | Chemotherapy | adriamycin | SD | |
| NBEAL1 | SNV | Missense_Mutation | rs762648838 | c.703A>T | p.Ile235Phe | p.I235F | Q6ZS30 | protein_coding | deleterious(0.01) | benign(0.178) | TCGA-A7-A26G-01 | Breast | breast invasive carcinoma | Female | <65 | I/II | Chemotherapy | taxotere | SD |
| NBEAL1 | SNV | Missense_Mutation | rs767658754 | c.5003N>T | p.Ser1668Leu | p.S1668L | Q6ZS30 | protein_coding | deleterious(0) | probably_damaging(0.991) | TCGA-A8-A08L-01 | Breast | breast invasive carcinoma | Female | >=65 | III/IV | Unknown | Unknown | SD |
| NBEAL1 | SNV | Missense_Mutation | rs776997008 | c.6484N>G | p.Pro2162Ala | p.P2162A | Q6ZS30 | protein_coding | deleterious(0.01) | probably_damaging(0.999) | TCGA-A8-A099-01 | Breast | breast invasive carcinoma | Female | >=65 | III/IV | Hormone Therapy | exemestane | SD |
| NBEAL1 | SNV | Missense_Mutation | c.2456N>G | p.Ser819Cys | p.S819C | Q6ZS30 | protein_coding | deleterious(0.04) | benign(0.003) | TCGA-AC-A23H-01 | Breast | breast invasive carcinoma | Female | >=65 | I/II | Unknown | Unknown | PD | |
| NBEAL1 | SNV | Missense_Mutation | c.4878N>G | p.Ile1626Met | p.I1626M | Q6ZS30 | protein_coding | deleterious(0.04) | benign(0.01) | TCGA-AC-A23H-01 | Breast | breast invasive carcinoma | Female | >=65 | I/II | Unknown | Unknown | PD | |
| NBEAL1 | SNV | Missense_Mutation | c.5489N>C | p.Arg1830Thr | p.R1830T | Q6ZS30 | protein_coding | deleterious(0) | probably_damaging(0.991) | TCGA-AC-A23H-01 | Breast | breast invasive carcinoma | Female | >=65 | I/II | Unknown | Unknown | PD | |
| NBEAL1 | SNV | Missense_Mutation | rs368351172 | c.3977N>T | p.Ser1326Leu | p.S1326L | Q6ZS30 | protein_coding | tolerated(0.68) | benign(0) | TCGA-AN-A046-01 | Breast | breast invasive carcinoma | Female | >=65 | I/II | Unknown | Unknown | SD |
| NBEAL1 | SNV | Missense_Mutation | c.2673G>C | p.Gln891His | p.Q891H | Q6ZS30 | protein_coding | deleterious(0.02) | benign(0.17) | TCGA-AN-A0XW-01 | Breast | breast invasive carcinoma | Female | <65 | III/IV | Unknown | Unknown | SD |
| Page: 1 2 3 4 5 6 7 8 9 10 11 12 13 14 15 16 17 18 19 20 21 |
Top |
Related drugs of malignant transformation related genes |
| Identification of chemicals and drugs interact with genes involved in malignant transfromation |
| (DGIdb 4.0) |
| Entrez ID | Symbol | Category | Interaction Types | Drug Claim Name | Drug Name | PMIDs |
| Page: 1 |

Copyright 2023-Present -The University of Texas Health Science Center at Houston |