
|
|||||
|
 | |
| |
| |
| |
| |
| |
|
Gene: NAXE |
Gene summary for NAXE |
| Gene information | Species | Human | Gene symbol | NAXE | Gene ID | 128240 |
| Gene name | NAD(P)HX epimerase | |
| Gene Alias | AIBP | |
| Cytomap | 1q22 | |
| Gene Type | protein-coding | GO ID | GO:0001525 | UniProtAcc | Q8NCW5 |
Top |
Malignant transformation analysis |
| Identification of the aberrant gene expression in precancerous and cancerous lesions by comparing the gene expression of stem-like cells in diseased tissues with normal stem cells |
| Entrez ID | Symbol | Replicates | Species | Organ | Tissue | Adj P-value | Log2FC | Malignancy |
| 128240 | NAXE | GSM4909281 | Human | Breast | IDC | 1.02e-11 | 4.93e-01 | 0.21 |
| 128240 | NAXE | GSM4909285 | Human | Breast | IDC | 3.38e-04 | 1.87e-01 | 0.21 |
| 128240 | NAXE | GSM4909287 | Human | Breast | IDC | 2.55e-03 | 3.17e-01 | 0.2057 |
| 128240 | NAXE | GSM4909291 | Human | Breast | IDC | 5.01e-09 | 4.95e-01 | 0.1753 |
| 128240 | NAXE | GSM4909293 | Human | Breast | IDC | 8.10e-10 | 4.28e-01 | 0.1581 |
| 128240 | NAXE | GSM4909295 | Human | Breast | IDC | 1.25e-02 | 3.91e-01 | 0.0898 |
| 128240 | NAXE | GSM4909297 | Human | Breast | IDC | 8.80e-04 | 5.66e-02 | 0.1517 |
| 128240 | NAXE | GSM4909302 | Human | Breast | IDC | 9.05e-03 | 3.10e-01 | 0.1545 |
| 128240 | NAXE | GSM4909304 | Human | Breast | IDC | 1.47e-03 | 3.91e-01 | 0.1636 |
| 128240 | NAXE | GSM4909306 | Human | Breast | IDC | 1.06e-16 | 6.30e-01 | 0.1564 |
| 128240 | NAXE | GSM4909307 | Human | Breast | IDC | 6.63e-14 | 6.01e-01 | 0.1569 |
| 128240 | NAXE | GSM4909308 | Human | Breast | IDC | 2.58e-43 | 8.32e-01 | 0.158 |
| 128240 | NAXE | GSM4909311 | Human | Breast | IDC | 1.61e-13 | 1.26e-01 | 0.1534 |
| 128240 | NAXE | GSM4909312 | Human | Breast | IDC | 3.88e-05 | 3.33e-01 | 0.1552 |
| 128240 | NAXE | GSM4909313 | Human | Breast | IDC | 3.07e-03 | 3.21e-01 | 0.0391 |
| 128240 | NAXE | GSM4909317 | Human | Breast | IDC | 7.24e-03 | 2.44e-01 | 0.1355 |
| 128240 | NAXE | GSM4909319 | Human | Breast | IDC | 3.54e-20 | 1.96e-01 | 0.1563 |
| 128240 | NAXE | GSM4909320 | Human | Breast | IDC | 8.35e-05 | 4.42e-01 | 0.1575 |
| 128240 | NAXE | GSM4909321 | Human | Breast | IDC | 8.98e-08 | 3.11e-01 | 0.1559 |
| 128240 | NAXE | brca1 | Human | Breast | Precancer | 6.13e-14 | -2.03e-01 | -0.0338 |
| Page: 1 2 3 4 5 |
| Tissue | Expression Dynamics | Abbreviation |
| Breast |  | IDC: Invasive ductal carcinoma |
| DCIS: Ductal carcinoma in situ | ||
| Precancer(BRCA1-mut): Precancerous lesion from BRCA1 mutation carriers | ||
| Colorectum (GSE201348) |  | FAP: Familial adenomatous polyposis |
| CRC: Colorectal cancer | ||
| Colorectum (HTA11) |  | AD: Adenomas |
| SER: Sessile serrated lesions | ||
| MSI-H: Microsatellite-high colorectal cancer | ||
| MSS: Microsatellite stable colorectal cancer | ||
| Esophagus | 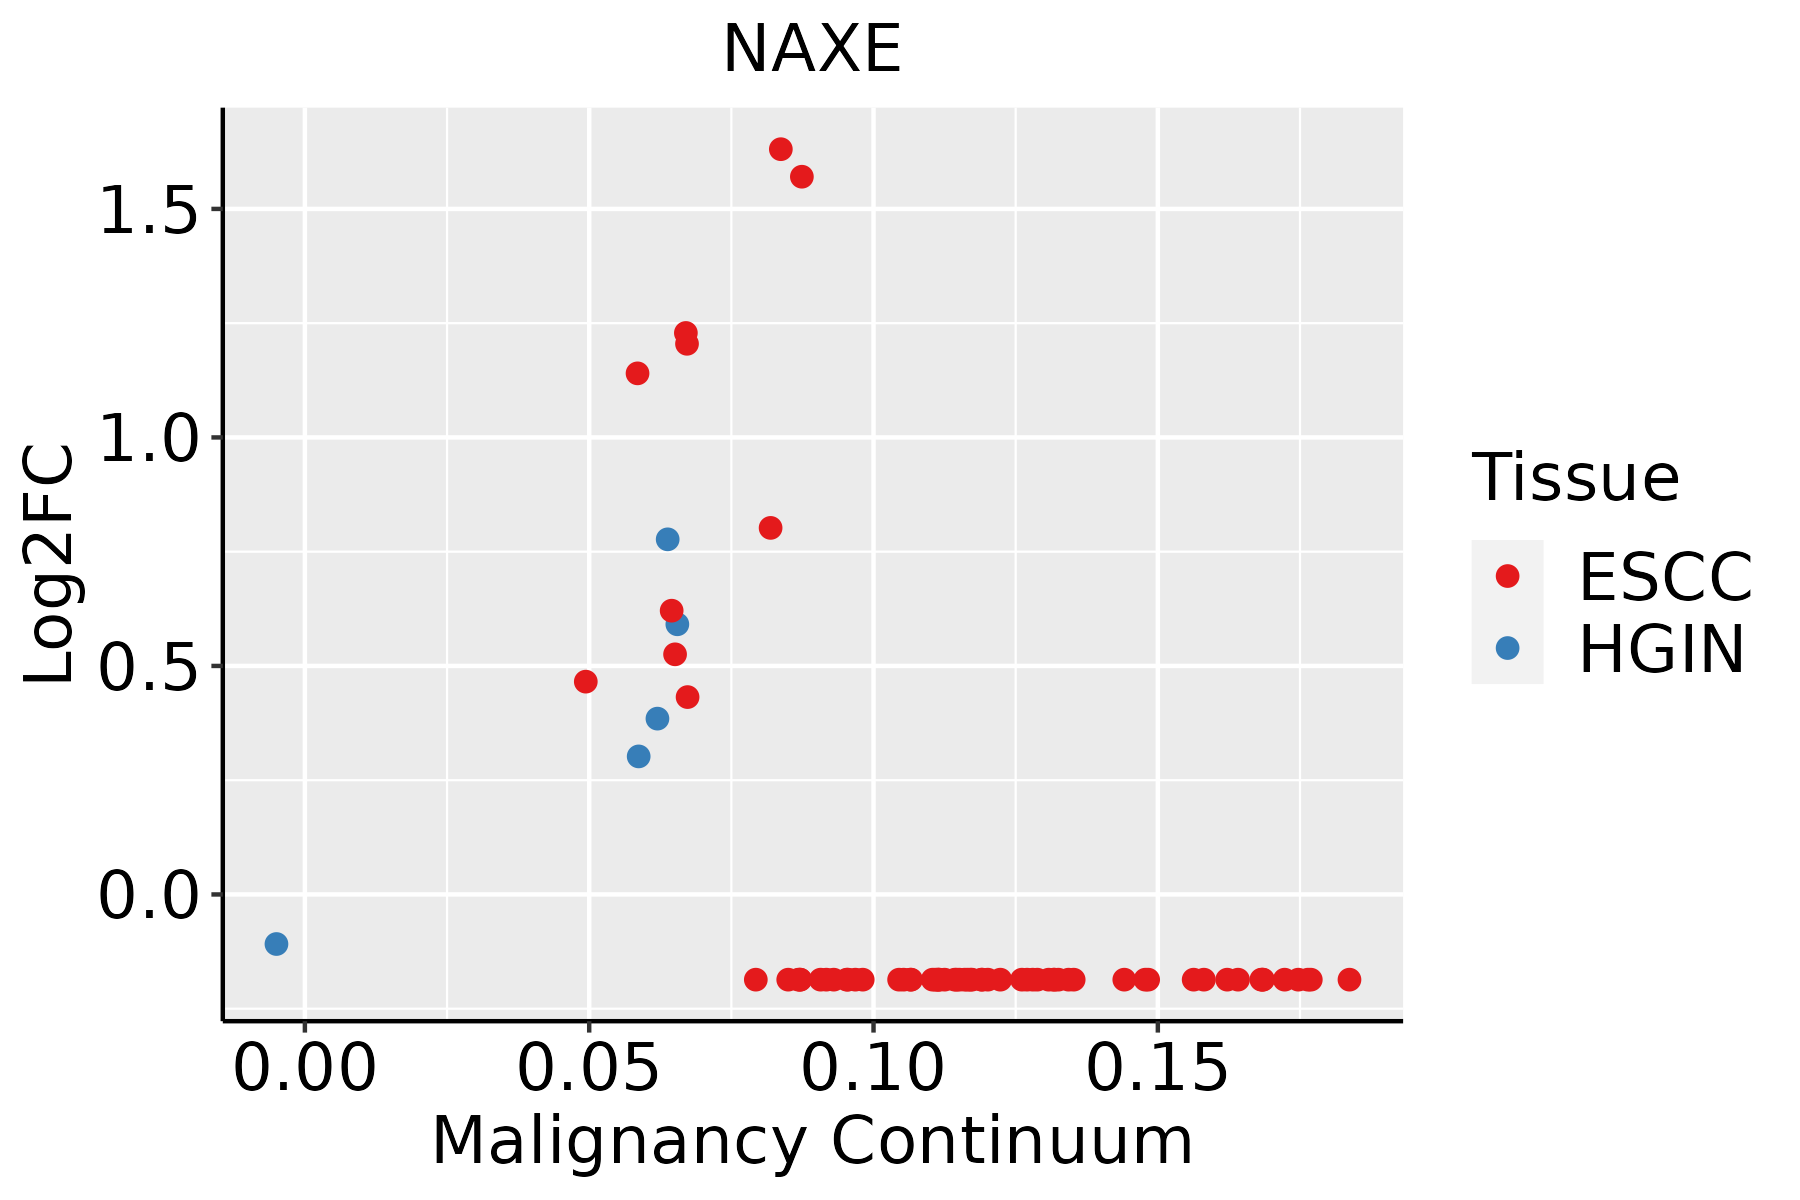 | ESCC: Esophageal squamous cell carcinoma |
| HGIN: High-grade intraepithelial neoplasias | ||
| LGIN: Low-grade intraepithelial neoplasias | ||
| Liver | 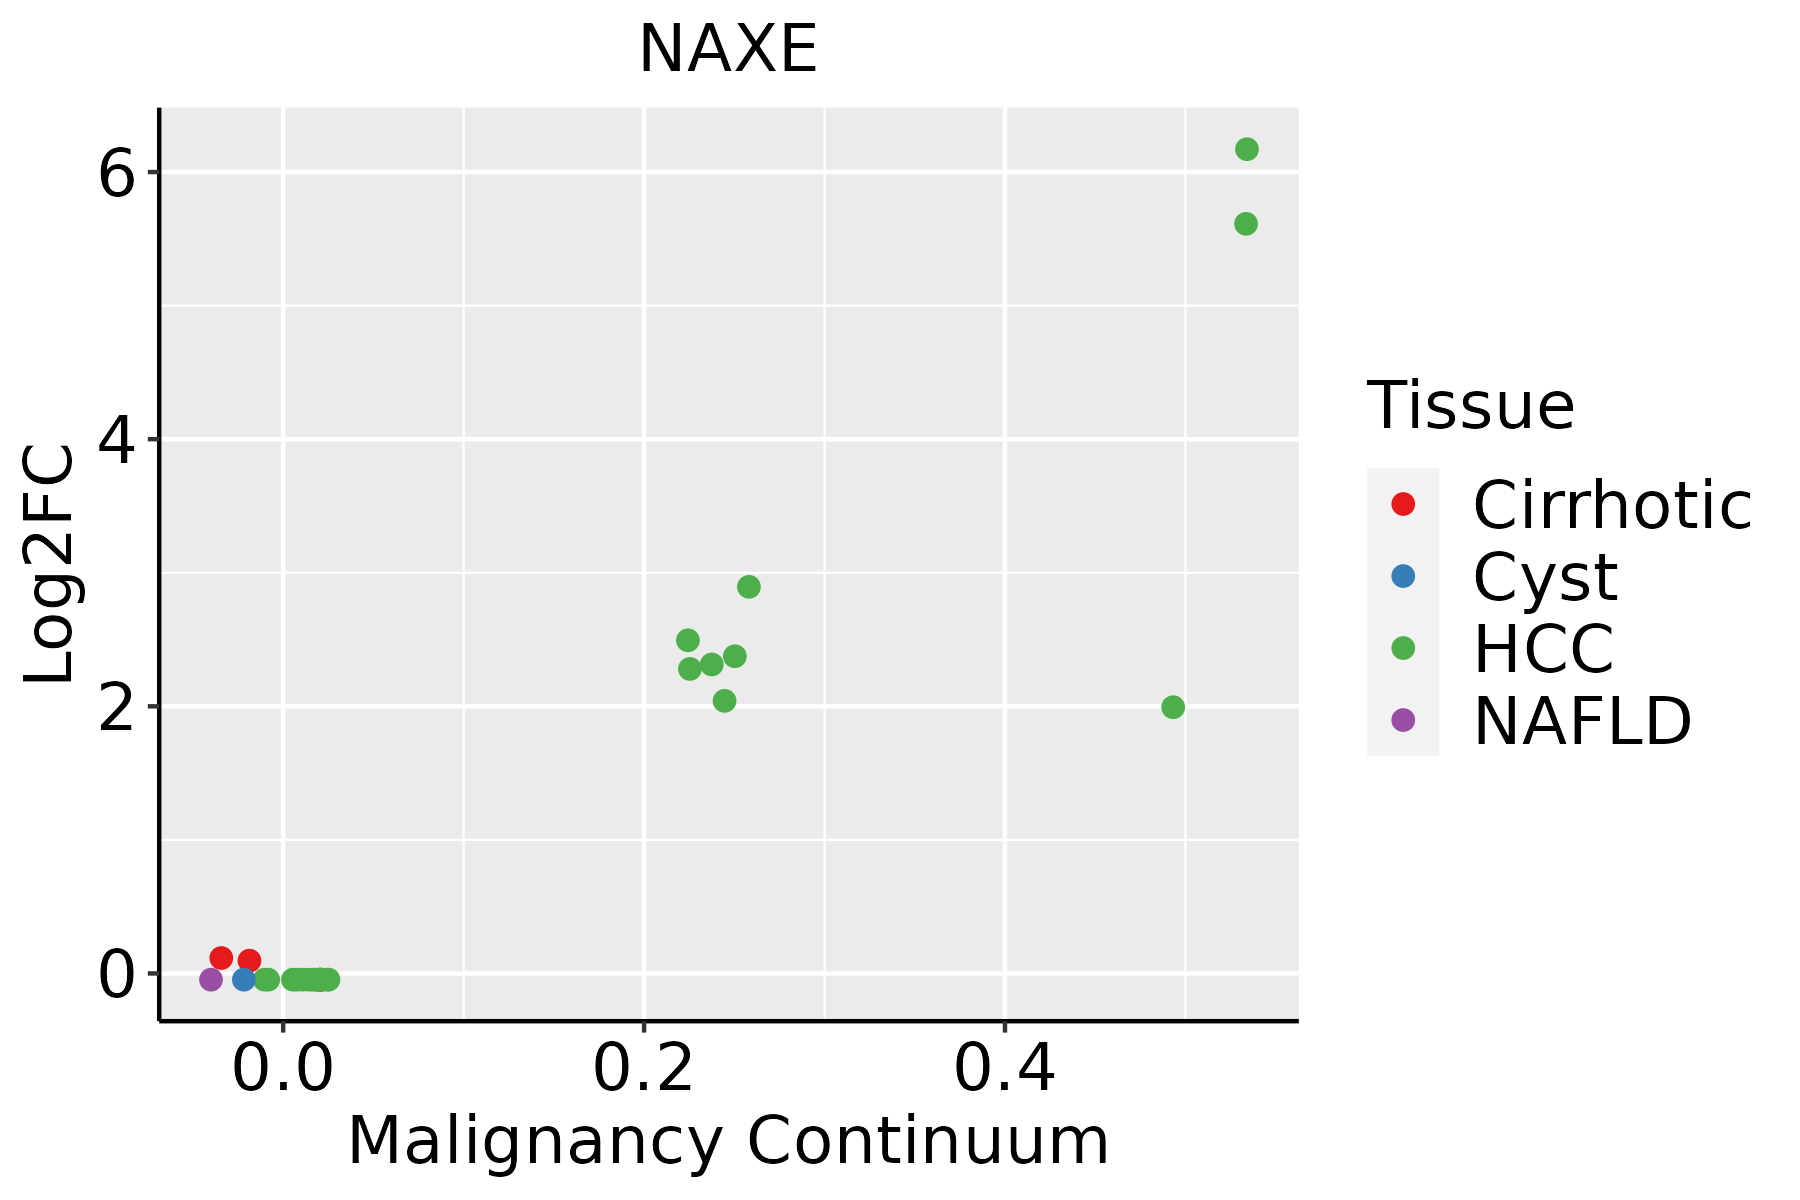 | HCC: Hepatocellular carcinoma |
| NAFLD: Non-alcoholic fatty liver disease | ||
| Thyroid | 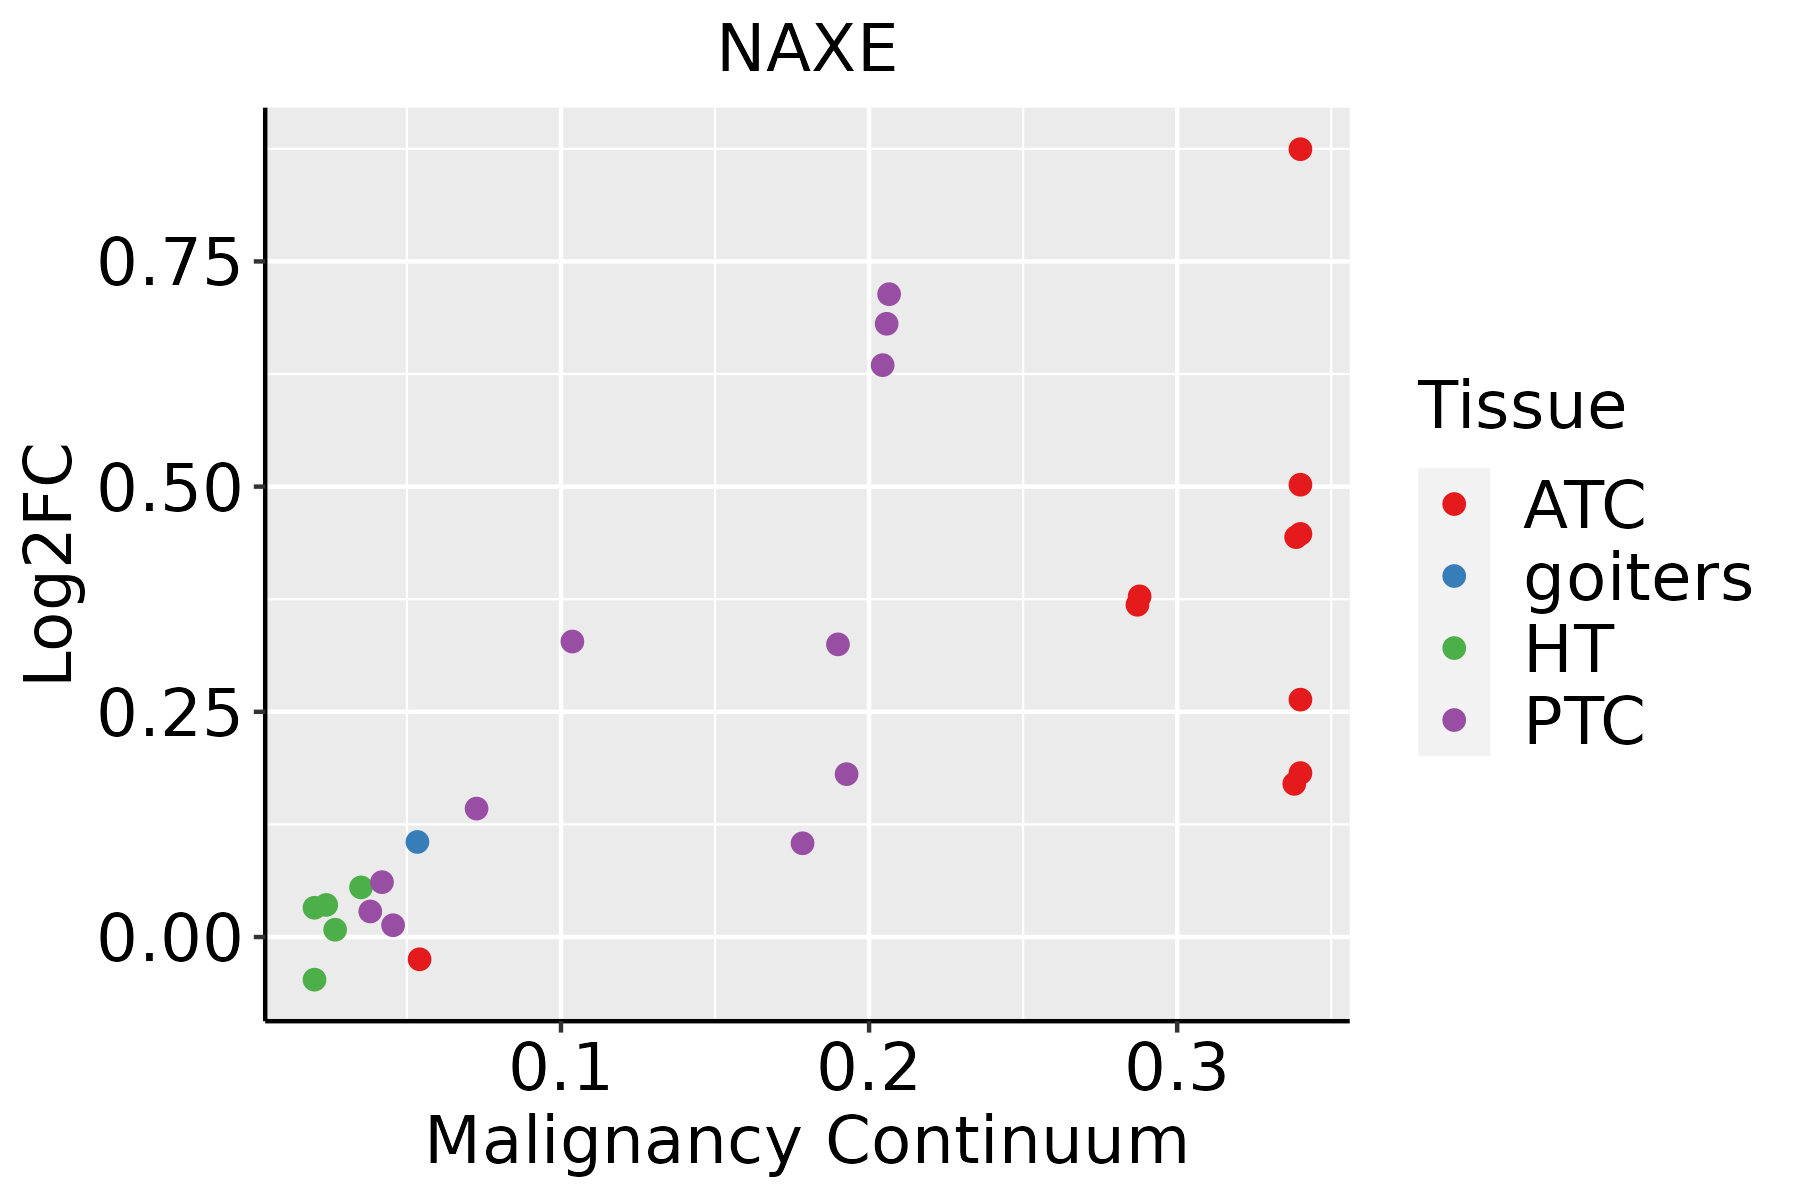 | ATC: Anaplastic thyroid cancer |
| HT: Hashimoto's thyroiditis | ||
| PTC: Papillary thyroid cancer |
| ∗log2FC in expression of this searched gene in stem-like cells from each diseased tissue sample relative to stem-like cells in normal samples in each tissue plotted against the malignancy continuum. Samples are colored based on if they are from different disease stage. |
Top |
Malignant transformation related pathway analysis |
| Find out the enriched GO biological processes and KEGG pathways involved in transition from healthy to precancer to cancer |
| Tissue | Disease Stage | Enriched GO biological Processes |
| Colorectum | AD |  |
| Colorectum | SER |  |
| Colorectum | MSS |  |
| Colorectum | MSI-H |  |
| Colorectum | FAP |  |
| ∗Top 15 enriched GO BP terms are showed in the bar plot of each disease state in each tissue. Each row represents a significant GO biological process which is colored according to the -log10(p.adjust). |
| Page: 1 2 3 4 5 6 7 8 9 |
| GO ID | Tissue | Disease Stage | Description | Gene Ratio | Bg Ratio | pvalue | p.adjust | Count |
| GO:00091179 | Breast | Precancer | nucleotide metabolic process | 56/1080 | 489/18723 | 7.40e-07 | 3.00e-05 | 56 |
| GO:00067539 | Breast | Precancer | nucleoside phosphate metabolic process | 56/1080 | 497/18723 | 1.24e-06 | 4.70e-05 | 56 |
| GO:0045765 | Breast | Precancer | regulation of angiogenesis | 35/1080 | 342/18723 | 7.35e-04 | 8.80e-03 | 35 |
| GO:1901342 | Breast | Precancer | regulation of vasculature development | 35/1080 | 348/18723 | 1.00e-03 | 1.12e-02 | 35 |
| GO:00315794 | Breast | Precancer | membrane raft organization | 6/1080 | 25/18723 | 2.49e-03 | 2.28e-02 | 6 |
| GO:000675313 | Breast | IDC | nucleoside phosphate metabolic process | 68/1434 | 497/18723 | 2.01e-06 | 8.23e-05 | 68 |
| GO:000911713 | Breast | IDC | nucleotide metabolic process | 67/1434 | 489/18723 | 2.28e-06 | 9.05e-05 | 67 |
| GO:00457651 | Breast | IDC | regulation of angiogenesis | 45/1434 | 342/18723 | 2.57e-04 | 3.98e-03 | 45 |
| GO:19013421 | Breast | IDC | regulation of vasculature development | 45/1434 | 348/18723 | 3.78e-04 | 5.38e-03 | 45 |
| GO:003157911 | Breast | IDC | membrane raft organization | 8/1434 | 25/18723 | 3.85e-04 | 5.40e-03 | 8 |
| GO:000911723 | Breast | DCIS | nucleotide metabolic process | 65/1390 | 489/18723 | 3.19e-06 | 1.03e-04 | 65 |
| GO:000675323 | Breast | DCIS | nucleoside phosphate metabolic process | 65/1390 | 497/18723 | 5.51e-06 | 1.59e-04 | 65 |
| GO:00457652 | Breast | DCIS | regulation of angiogenesis | 44/1390 | 342/18723 | 2.50e-04 | 3.87e-03 | 44 |
| GO:19013422 | Breast | DCIS | regulation of vasculature development | 44/1390 | 348/18723 | 3.67e-04 | 5.17e-03 | 44 |
| GO:003157921 | Breast | DCIS | membrane raft organization | 7/1390 | 25/18723 | 1.79e-03 | 1.73e-02 | 7 |
| GO:0009117 | Colorectum | AD | nucleotide metabolic process | 168/3918 | 489/18723 | 2.20e-12 | 3.36e-10 | 168 |
| GO:0006753 | Colorectum | AD | nucleoside phosphate metabolic process | 169/3918 | 497/18723 | 4.99e-12 | 6.98e-10 | 169 |
| GO:0010876 | Colorectum | AD | lipid localization | 120/3918 | 448/18723 | 1.59e-03 | 1.33e-02 | 120 |
| GO:0006869 | Colorectum | AD | lipid transport | 108/3918 | 398/18723 | 1.67e-03 | 1.39e-02 | 108 |
| GO:00091171 | Colorectum | SER | nucleotide metabolic process | 122/2897 | 489/18723 | 2.50e-08 | 1.76e-06 | 122 |
| Page: 1 2 3 |
| Pathway ID | Tissue | Disease Stage | Description | Gene Ratio | Bg Ratio | pvalue | p.adjust | qvalue | Count |
| Page: 1 |
Top |
Cell-cell communication analysis |
| Identification of potential cell-cell interactions between two cell types and their ligand-receptor pairs for different disease states |
| Ligand | Receptor | LRpair | Pathway | Tissue | Disease Stage |
| Page: 1 |
Top |
Single-cell gene regulatory network inference analysis |
| Find out the significant the regulons (TFs) and the target genes of each regulon across cell types for different disease states |
| TF | Cell Type | Tissue | Disease Stage | Target Gene | RSS | Regulon Activity |
| ∗The dot plots of a searched regulon are shown for all cell subpopulations in each disease state of each tissue based on the regulon specific score inferred using pySCENIC and by calculating the average expression. |
| Page: 1 |
Top |
Somatic mutation of malignant transformation related genes |
| Annotation of somatic variants for genes involved in malignant transformation |
| Hugo Symbol | Variant Class | Variant Classification | dbSNP RS | HGVSc | HGVSp | HGVSp Short | SWISSPROT | BIOTYPE | SIFT | PolyPhen | Tumor Sample Barcode | Tissue | Histology | Sex | Age | Stage | Therapy Types | Drugs | Outcome |
| NAXE | SNV | Missense_Mutation | rs375240595 | c.511G>A | p.Ala171Thr | p.A171T | Q8NCW5 | protein_coding | tolerated(0.61) | benign(0.021) | TCGA-2W-A8YY-01 | Cervix | cervical & endocervical cancer | Female | <65 | I/II | Chemotherapy | cisplatin | CR |
| NAXE | SNV | Missense_Mutation | rs781121474 | c.589N>T | p.Arg197Trp | p.R197W | Q8NCW5 | protein_coding | deleterious(0) | probably_damaging(1) | TCGA-AA-3952-01 | Colorectum | colon adenocarcinoma | Male | >=65 | III/IV | Unknown | Unknown | PD |
| NAXE | SNV | Missense_Mutation | c.785N>G | p.Phe262Cys | p.F262C | Q8NCW5 | protein_coding | deleterious(0) | probably_damaging(1) | TCGA-CA-6718-01 | Colorectum | colon adenocarcinoma | Male | <65 | I/II | Unknown | Unknown | PD | |
| NAXE | SNV | Missense_Mutation | c.826N>T | p.Pro276Ser | p.P276S | Q8NCW5 | protein_coding | deleterious(0.01) | possibly_damaging(0.795) | TCGA-CM-6171-01 | Colorectum | colon adenocarcinoma | Female | >=65 | I/II | Unknown | Unknown | SD | |
| NAXE | SNV | Missense_Mutation | c.412N>G | p.Pro138Ala | p.P138A | Q8NCW5 | protein_coding | deleterious(0.03) | possibly_damaging(0.711) | TCGA-AG-A00Y-01 | Colorectum | rectum adenocarcinoma | Male | >=65 | I/II | Unknown | Unknown | PD | |
| NAXE | insertion | Frame_Shift_Ins | novel | c.461_462insATTCCCC | p.Val155PhefsTer25 | p.V155Ffs*25 | Q8NCW5 | protein_coding | TCGA-AM-5820-01 | Colorectum | colon adenocarcinoma | Female | <65 | I/II | Unknown | Unknown | SD | ||
| NAXE | SNV | Missense_Mutation | novel | c.491N>A | p.Pro164His | p.P164H | Q8NCW5 | protein_coding | deleterious(0.03) | possibly_damaging(0.637) | TCGA-AP-A1DK-01 | Endometrium | uterine corpus endometrioid carcinoma | Female | <65 | I/II | Unknown | Unknown | SD |
| NAXE | SNV | Missense_Mutation | novel | c.643N>A | p.Ala215Thr | p.A215T | Q8NCW5 | protein_coding | tolerated(0.05) | benign(0.063) | TCGA-AP-A1DO-01 | Endometrium | uterine corpus endometrioid carcinoma | Female | <65 | I/II | Unknown | Unknown | SD |
| NAXE | SNV | Missense_Mutation | rs754557536 | c.150G>T | p.Glu50Asp | p.E50D | Q8NCW5 | protein_coding | tolerated(0.6) | benign(0.023) | TCGA-AP-A1E0-01 | Endometrium | uterine corpus endometrioid carcinoma | Female | <65 | III/IV | Chemotherapy | paclitaxel | SD |
| NAXE | SNV | Missense_Mutation | rs778355823 | c.761G>A | p.Arg254His | p.R254H | Q8NCW5 | protein_coding | deleterious(0.01) | benign(0.098) | TCGA-B5-A11E-01 | Endometrium | uterine corpus endometrioid carcinoma | Female | <65 | I/II | Unknown | Unknown | SD |
| Page: 1 2 3 |
Top |
Related drugs of malignant transformation related genes |
| Identification of chemicals and drugs interact with genes involved in malignant transfromation |
| (DGIdb 4.0) |
| Entrez ID | Symbol | Category | Interaction Types | Drug Claim Name | Drug Name | PMIDs |
| Page: 1 |

Copyright 2023-Present -The University of Texas Health Science Center at Houston |