
|
|||||
|
 | |
| |
| |
| |
| |
| |
|
Gene: NAV3 |
Gene summary for NAV3 |
| Gene information | Species | Human | Gene symbol | NAV3 | Gene ID | 89795 |
| Gene name | neuron navigator 3 | |
| Gene Alias | POMFIL1 | |
| Cytomap | 12q21.2 | |
| Gene Type | protein-coding | GO ID | GO:0000226 | UniProtAcc | Q8IVL0 |
Top |
Malignant transformation analysis |
| Identification of the aberrant gene expression in precancerous and cancerous lesions by comparing the gene expression of stem-like cells in diseased tissues with normal stem cells |
| Entrez ID | Symbol | Replicates | Species | Organ | Tissue | Adj P-value | Log2FC | Malignancy |
| 89795 | NAV3 | HTA12-15-2 | Human | Pancreas | PDAC | 1.28e-15 | 1.02e+00 | 0.2315 |
| 89795 | NAV3 | HTA12-16-2 | Human | Pancreas | PDAC | 1.71e-02 | 5.18e-01 | 0.0535 |
| 89795 | NAV3 | HTA12-23-1 | Human | Pancreas | PDAC | 1.06e-18 | 1.37e+00 | 0.3405 |
| 89795 | NAV3 | HTA12-25-1 | Human | Pancreas | PDAC | 3.74e-18 | 1.12e+00 | 0.313 |
| 89795 | NAV3 | HTA12-26-1 | Human | Pancreas | PDAC | 2.52e-43 | 1.58e+00 | 0.3728 |
| 89795 | NAV3 | HTA12-29-1 | Human | Pancreas | PDAC | 1.35e-93 | 1.63e+00 | 0.3722 |
| 89795 | NAV3 | HTA12-30-1 | Human | Pancreas | PDAC | 3.91e-06 | 1.22e+00 | 0.3671 |
| 89795 | NAV3 | HTA12-32-1 | Human | Pancreas | PDAC | 1.11e-06 | 1.05e+00 | 0.3624 |
| 89795 | NAV3 | HTA12-9-3 | Human | Pancreas | PDAC | 3.02e-08 | 9.14e-01 | 0.2045 |
| 89795 | NAV3 | GSM5252128_BPH327PrGF_Via | Human | Prostate | BPH | 1.12e-04 | 3.62e-01 | -0.1688 |
| 89795 | NAV3 | GSM5252130_BPH340PrGF_Via | Human | Prostate | BPH | 2.02e-16 | 6.38e-01 | -0.1972 |
| 89795 | NAV3 | GSM5252136_BPH556PrGA1_Fcol | Human | Prostate | BPH | 5.46e-11 | 5.11e-01 | -0.23 |
| 89795 | NAV3 | 047563_1562-all-cells | Human | Prostate | BPH | 2.92e-08 | 4.99e-01 | 0.0791 |
| 89795 | NAV3 | 048752_1579-all-cells | Human | Prostate | BPH | 3.04e-55 | 1.24e+00 | 0.1008 |
| 89795 | NAV3 | 052095_1628-all-cells | Human | Prostate | BPH | 2.13e-46 | 1.20e+00 | 0.1032 |
| 89795 | NAV3 | 052097_1595-all-cells | Human | Prostate | BPH | 3.76e-50 | 1.20e+00 | 0.0972 |
| 89795 | NAV3 | 052099_1652-all-cells | Human | Prostate | BPH | 3.78e-66 | 1.36e+00 | 0.1038 |
| 89795 | NAV3 | Dong_P5 | Human | Prostate | Tumor | 9.61e-03 | -8.09e-02 | 0.053 |
| 89795 | NAV3 | ATC09 | Human | Thyroid | ATC | 2.95e-02 | 1.47e-01 | 0.2871 |
| 89795 | NAV3 | ATC12 | Human | Thyroid | ATC | 1.19e-10 | 2.40e-01 | 0.34 |
| Page: 1 2 |
| Tissue | Expression Dynamics | Abbreviation |
| Prostate | 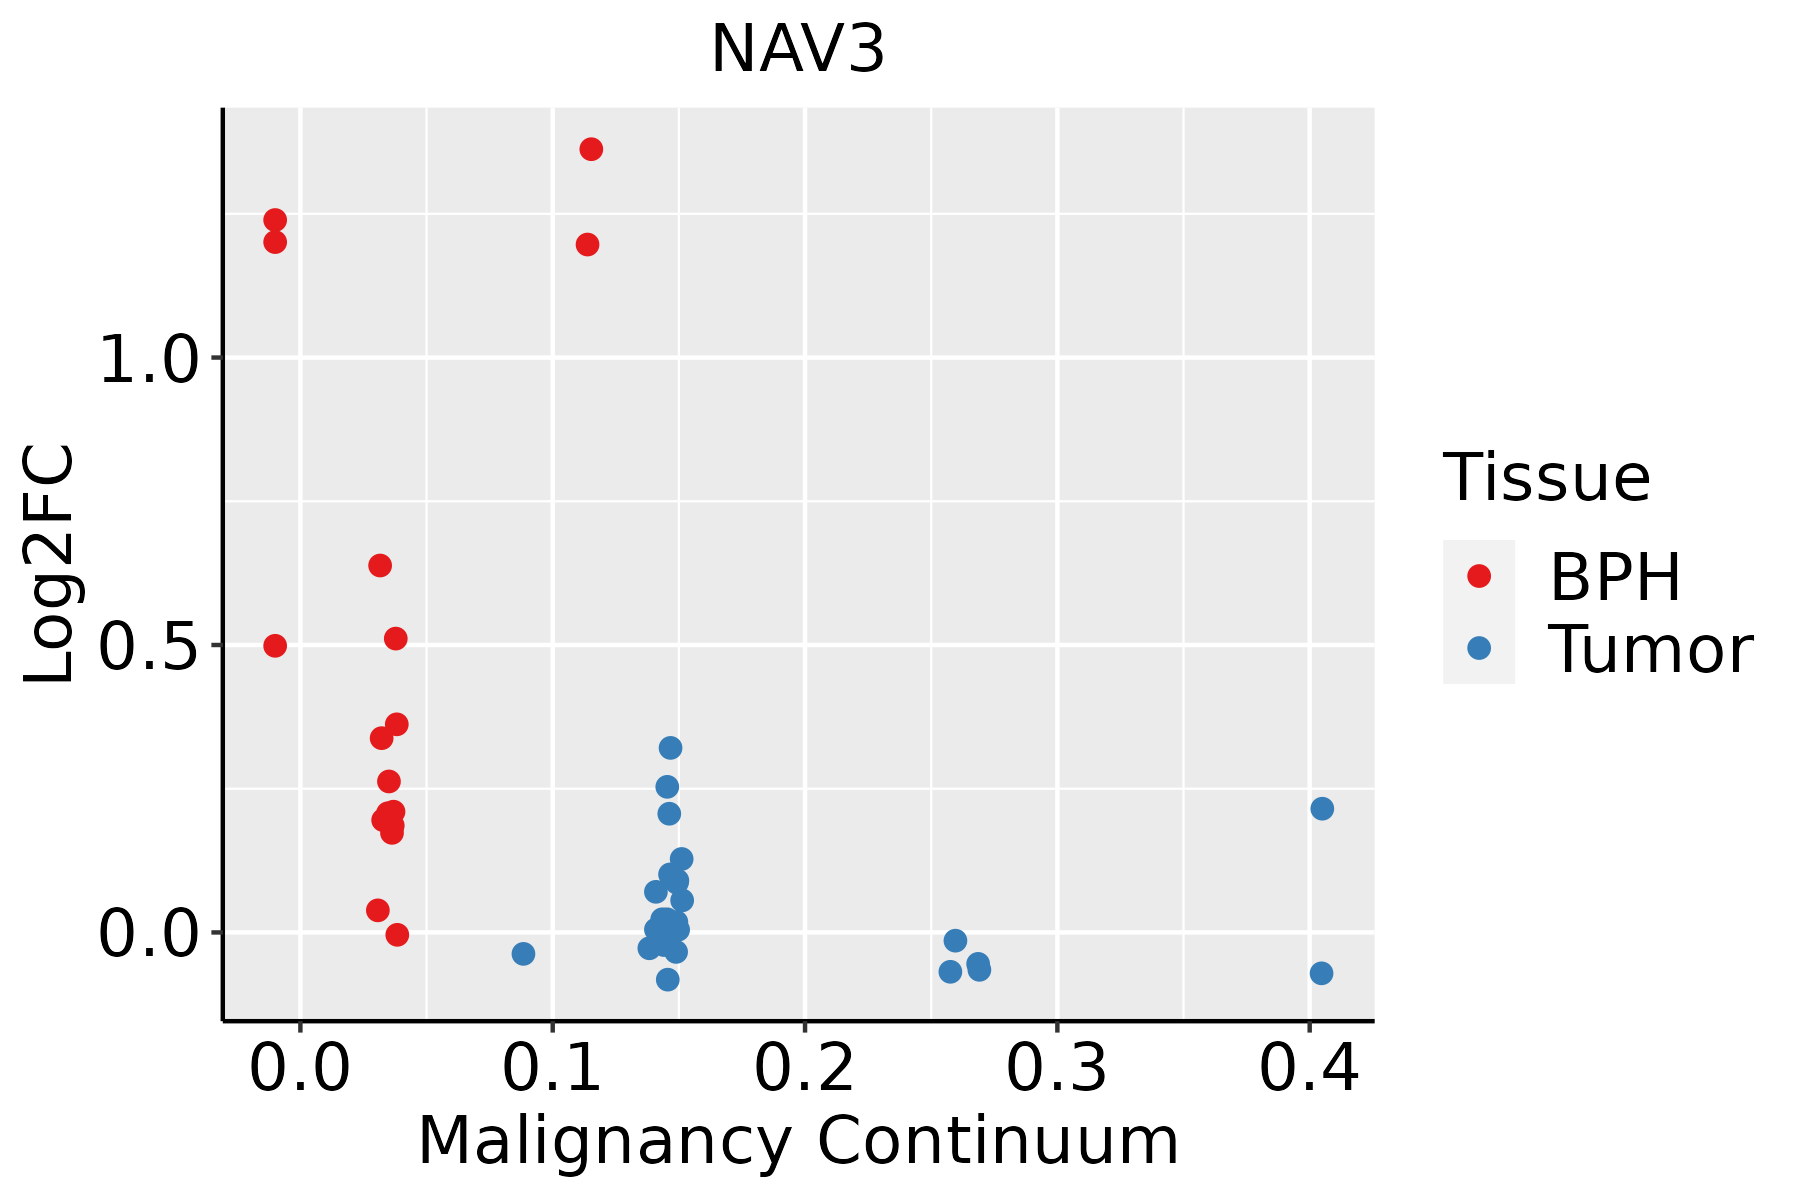 | BPH: Benign Prostatic Hyperplasia |
| Thyroid | 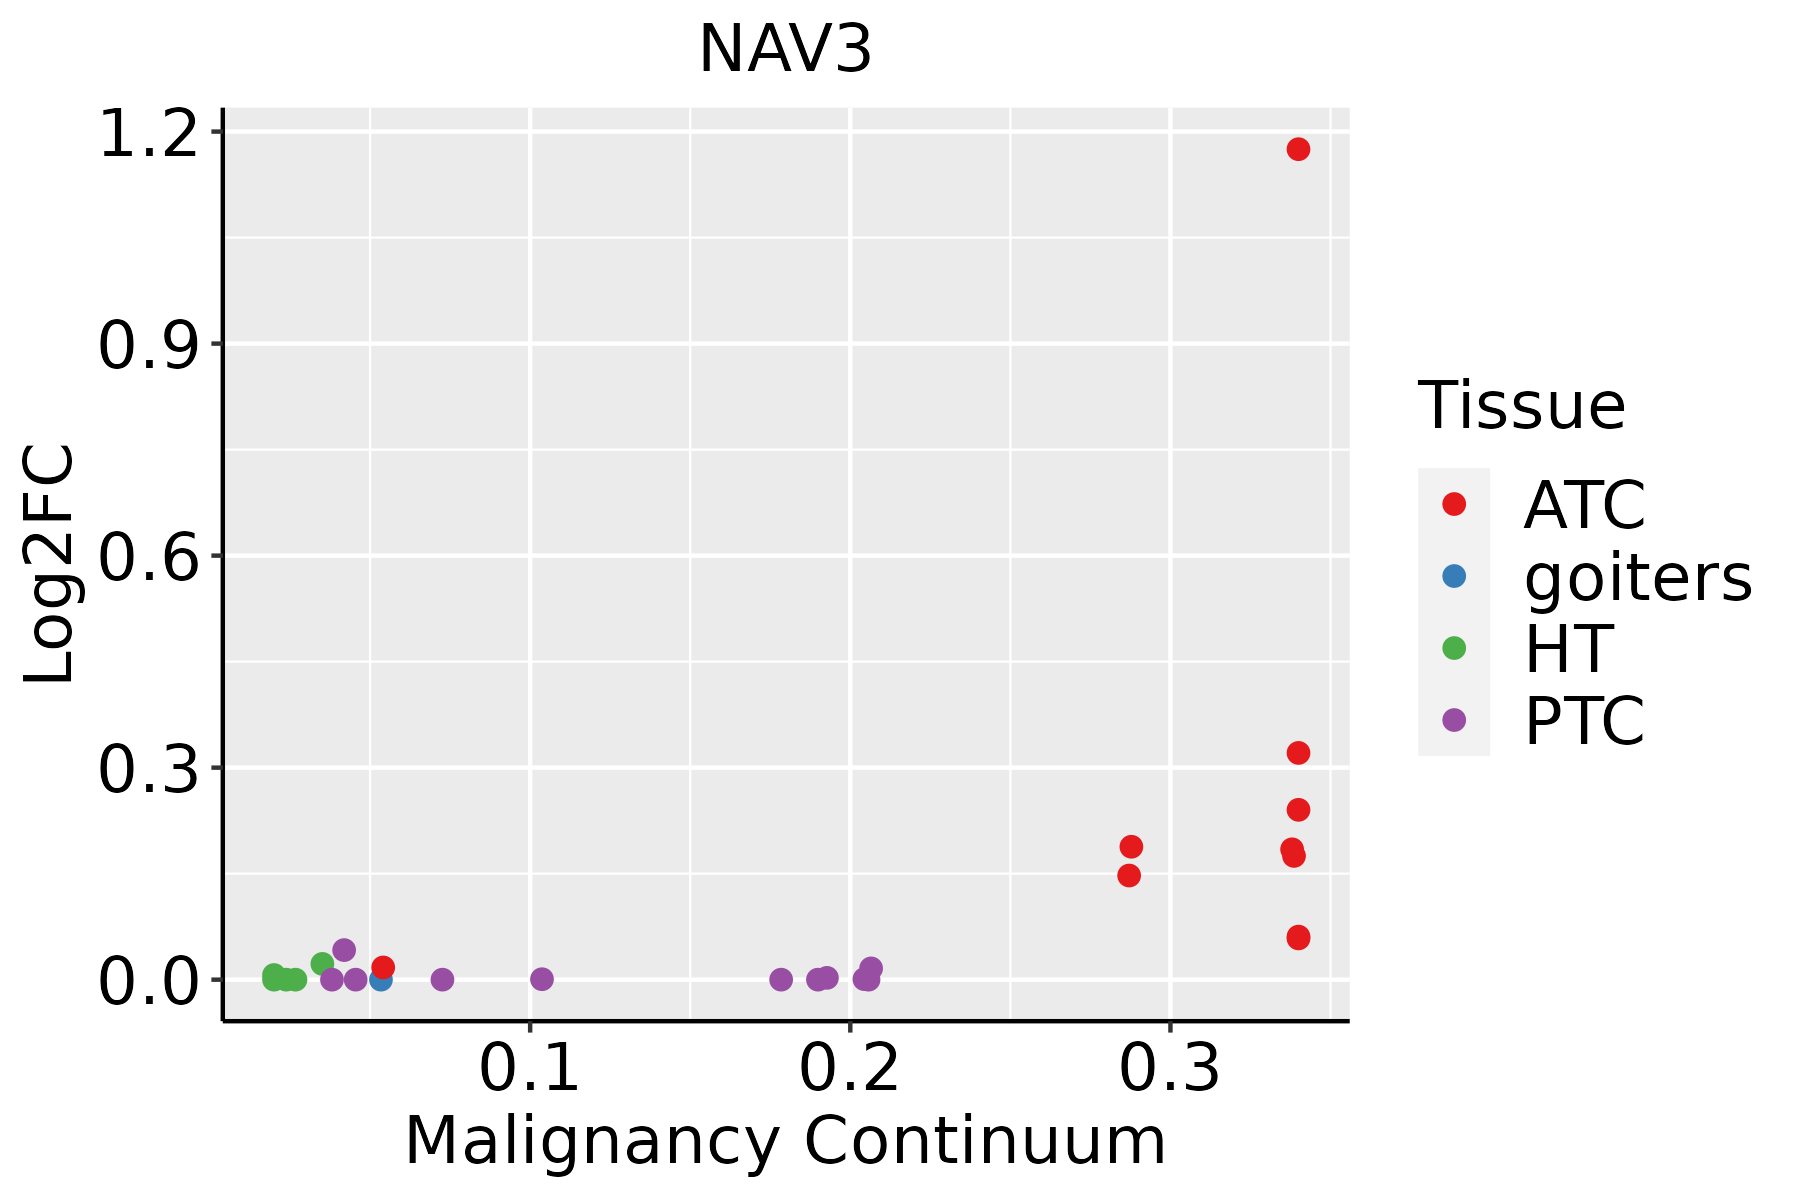 | ATC: Anaplastic thyroid cancer |
| HT: Hashimoto's thyroiditis | ||
| PTC: Papillary thyroid cancer |
| ∗log2FC in expression of this searched gene in stem-like cells from each diseased tissue sample relative to stem-like cells in normal samples in each tissue plotted against the malignancy continuum. Samples are colored based on if they are from different disease stage. |
Top |
Malignant transformation related pathway analysis |
| Find out the enriched GO biological processes and KEGG pathways involved in transition from healthy to precancer to cancer |
| Tissue | Disease Stage | Enriched GO biological Processes |
| Colorectum | AD |  |
| Colorectum | SER |  |
| Colorectum | MSS |  |
| Colorectum | MSI-H |  |
| Colorectum | FAP |  |
| ∗Top 15 enriched GO BP terms are showed in the bar plot of each disease state in each tissue. Each row represents a significant GO biological process which is colored according to the -log10(p.adjust). |
| Page: 1 2 3 4 5 6 7 8 9 |
| GO ID | Tissue | Disease Stage | Description | Gene Ratio | Bg Ratio | pvalue | p.adjust | Count |
| GO:190290318 | Prostate | BPH | regulation of supramolecular fiber organization | 133/3107 | 383/18723 | 2.40e-18 | 8.73e-16 | 133 |
| GO:190290518 | Prostate | BPH | positive regulation of supramolecular fiber organization | 84/3107 | 209/18723 | 3.00e-16 | 5.63e-14 | 84 |
| GO:004325418 | Prostate | BPH | regulation of protein-containing complex assembly | 133/3107 | 428/18723 | 5.40e-14 | 6.08e-12 | 133 |
| GO:005149516 | Prostate | BPH | positive regulation of cytoskeleton organization | 83/3107 | 226/18723 | 1.83e-13 | 1.86e-11 | 83 |
| GO:003133418 | Prostate | BPH | positive regulation of protein-containing complex assembly | 84/3107 | 237/18723 | 1.24e-12 | 1.04e-10 | 84 |
| GO:003227317 | Prostate | BPH | positive regulation of protein polymerization | 57/3107 | 138/18723 | 4.64e-12 | 3.68e-10 | 57 |
| GO:005125818 | Prostate | BPH | protein polymerization | 96/3107 | 297/18723 | 1.52e-11 | 1.10e-09 | 96 |
| GO:003227118 | Prostate | BPH | regulation of protein polymerization | 80/3107 | 233/18723 | 2.67e-11 | 1.78e-09 | 80 |
| GO:002241117 | Prostate | BPH | cellular component disassembly | 121/3107 | 443/18723 | 6.34e-09 | 2.25e-07 | 121 |
| GO:190290410 | Prostate | BPH | negative regulation of supramolecular fiber organization | 55/3107 | 167/18723 | 1.60e-07 | 3.63e-06 | 55 |
| GO:00705076 | Prostate | BPH | regulation of microtubule cytoskeleton organization | 48/3107 | 148/18723 | 1.57e-06 | 2.67e-05 | 48 |
| GO:00329849 | Prostate | BPH | protein-containing complex disassembly | 65/3107 | 224/18723 | 2.19e-06 | 3.60e-05 | 65 |
| GO:00512715 | Prostate | BPH | negative regulation of cellular component movement | 94/3107 | 367/18723 | 6.18e-06 | 9.00e-05 | 94 |
| GO:005149410 | Prostate | BPH | negative regulation of cytoskeleton organization | 49/3107 | 163/18723 | 1.32e-05 | 1.74e-04 | 49 |
| GO:20001465 | Prostate | BPH | negative regulation of cell motility | 91/3107 | 359/18723 | 1.34e-05 | 1.76e-04 | 91 |
| GO:00311166 | Prostate | BPH | positive regulation of microtubule polymerization | 16/3107 | 33/18723 | 2.15e-05 | 2.60e-04 | 16 |
| GO:00400135 | Prostate | BPH | negative regulation of locomotion | 96/3107 | 391/18723 | 3.11e-05 | 3.54e-04 | 96 |
| GO:001063916 | Prostate | BPH | negative regulation of organelle organization | 87/3107 | 348/18723 | 3.56e-05 | 3.90e-04 | 87 |
| GO:00303365 | Prostate | BPH | negative regulation of cell migration | 86/3107 | 344/18723 | 3.93e-05 | 4.25e-04 | 86 |
| GO:00328862 | Prostate | BPH | regulation of microtubule-based process | 64/3107 | 240/18723 | 4.93e-05 | 5.11e-04 | 64 |
| Page: 1 2 3 |
| Pathway ID | Tissue | Disease Stage | Description | Gene Ratio | Bg Ratio | pvalue | p.adjust | qvalue | Count |
| Page: 1 |
Top |
Cell-cell communication analysis |
| Identification of potential cell-cell interactions between two cell types and their ligand-receptor pairs for different disease states |
| Ligand | Receptor | LRpair | Pathway | Tissue | Disease Stage |
| Page: 1 |
Top |
Single-cell gene regulatory network inference analysis |
| Find out the significant the regulons (TFs) and the target genes of each regulon across cell types for different disease states |
| TF | Cell Type | Tissue | Disease Stage | Target Gene | RSS | Regulon Activity |
| ∗The dot plots of a searched regulon are shown for all cell subpopulations in each disease state of each tissue based on the regulon specific score inferred using pySCENIC and by calculating the average expression. |
| Page: 1 |
Top |
Somatic mutation of malignant transformation related genes |
| Annotation of somatic variants for genes involved in malignant transformation |
| Hugo Symbol | Variant Class | Variant Classification | dbSNP RS | HGVSc | HGVSp | HGVSp Short | SWISSPROT | BIOTYPE | SIFT | PolyPhen | Tumor Sample Barcode | Tissue | Histology | Sex | Age | Stage | Therapy Types | Drugs | Outcome |
| NAV3 | SNV | Missense_Mutation | novel | c.3628N>A | p.Glu1210Lys | p.E1210K | Q8IVL0 | protein_coding | deleterious(0.03) | benign(0.119) | TCGA-3C-AALI-01 | Breast | breast invasive carcinoma | Female | <65 | I/II | Unspecific | Poly E | Complete Response |
| NAV3 | SNV | Missense_Mutation | c.4994G>A | p.Arg1665Lys | p.R1665K | Q8IVL0 | protein_coding | tolerated(0.26) | probably_damaging(0.986) | TCGA-A1-A0SG-01 | Breast | breast invasive carcinoma | Female | <65 | I/II | Chemotherapy | SD | ||
| NAV3 | SNV | Missense_Mutation | rs771436482 | c.4304N>G | p.Ala1435Gly | p.A1435G | Q8IVL0 | protein_coding | tolerated(0.16) | benign(0.101) | TCGA-A2-A04P-01 | Breast | breast invasive carcinoma | Female | <65 | III/IV | Chemotherapy | taxol | PD |
| NAV3 | SNV | Missense_Mutation | c.6466N>G | p.Met2156Val | p.M2156V | Q8IVL0 | protein_coding | deleterious(0) | probably_damaging(0.989) | TCGA-A2-A04T-01 | Breast | breast invasive carcinoma | Female | <65 | I/II | Chemotherapy | cyclophosphamide | SD | |
| NAV3 | SNV | Missense_Mutation | rs781607195 | c.3746N>A | p.Arg1249Gln | p.R1249Q | Q8IVL0 | protein_coding | deleterious(0.04) | probably_damaging(0.994) | TCGA-AN-A046-01 | Breast | breast invasive carcinoma | Female | >=65 | I/II | Unknown | Unknown | SD |
| NAV3 | SNV | Missense_Mutation | c.5542N>A | p.Glu1848Lys | p.E1848K | Q8IVL0 | protein_coding | deleterious(0) | probably_damaging(0.993) | TCGA-AN-A0FZ-01 | Breast | breast invasive carcinoma | Female | <65 | III/IV | Unknown | Unknown | SD | |
| NAV3 | SNV | Missense_Mutation | c.6397T>C | p.Ser2133Pro | p.S2133P | Q8IVL0 | protein_coding | deleterious(0.01) | probably_damaging(0.999) | TCGA-AR-A256-01 | Breast | breast invasive carcinoma | Female | <65 | I/II | Chemotherapy | doxorubicin | PD | |
| NAV3 | SNV | Missense_Mutation | c.713N>C | p.Ile238Thr | p.I238T | Q8IVL0 | protein_coding | tolerated(0.09) | benign(0.068) | TCGA-BH-A0BT-01 | Breast | breast invasive carcinoma | Female | <65 | I/II | Chemotherapy | adriamycin | CR | |
| NAV3 | SNV | Missense_Mutation | c.1243G>A | p.Asp415Asn | p.D415N | Q8IVL0 | protein_coding | deleterious(0.02) | benign(0.118) | TCGA-BH-A0H5-01 | Breast | breast invasive carcinoma | Female | <65 | I/II | Chemotherapy | cytoxan | CR | |
| NAV3 | SNV | Missense_Mutation | c.3086T>A | p.Leu1029Gln | p.L1029Q | Q8IVL0 | protein_coding | deleterious(0.05) | possibly_damaging(0.68) | TCGA-BH-A0WA-01 | Breast | breast invasive carcinoma | Female | >=65 | I/II | Unknown | Unknown | SD |
| Page: 1 2 3 4 5 6 7 8 9 10 11 12 13 14 15 16 17 18 19 20 21 22 23 24 25 26 27 28 29 30 31 32 33 34 35 36 37 38 39 40 41 42 43 44 45 46 47 48 49 50 51 52 53 54 55 56 57 |
Top |
Related drugs of malignant transformation related genes |
| Identification of chemicals and drugs interact with genes involved in malignant transfromation |
| (DGIdb 4.0) |
| Entrez ID | Symbol | Category | Interaction Types | Drug Claim Name | Drug Name | PMIDs |
| Page: 1 |

Copyright 2023-Present -The University of Texas Health Science Center at Houston |