
|
|||||
|
 | |
| |
| |
| |
| |
| |
|
Gene: NAV2 |
Gene summary for NAV2 |
| Gene information | Species | Human | Gene symbol | NAV2 | Gene ID | 89797 |
| Gene name | neuron navigator 2 | |
| Gene Alias | HELAD1 | |
| Cytomap | 11p15.1 | |
| Gene Type | protein-coding | GO ID | GO:0001976 | UniProtAcc | A7E2D6 |
Top |
Malignant transformation analysis |
| Identification of the aberrant gene expression in precancerous and cancerous lesions by comparing the gene expression of stem-like cells in diseased tissues with normal stem cells |
| Entrez ID | Symbol | Replicates | Species | Organ | Tissue | Adj P-value | Log2FC | Malignancy |
| 89797 | NAV2 | CCI_2 | Human | Cervix | CC | 1.13e-02 | 6.01e-01 | 0.5249 |
| 89797 | NAV2 | CCI_3 | Human | Cervix | CC | 2.07e-08 | 8.18e-01 | 0.516 |
| 89797 | NAV2 | AEH-subject1 | Human | Endometrium | AEH | 2.56e-21 | 6.49e-01 | -0.3059 |
| 89797 | NAV2 | AEH-subject2 | Human | Endometrium | AEH | 1.42e-14 | 5.80e-01 | -0.2525 |
| 89797 | NAV2 | AEH-subject4 | Human | Endometrium | AEH | 5.58e-08 | 4.92e-01 | -0.2657 |
| 89797 | NAV2 | AEH-subject5 | Human | Endometrium | AEH | 9.17e-25 | 8.33e-01 | -0.2953 |
| 89797 | NAV2 | EEC-subject1 | Human | Endometrium | EEC | 5.47e-48 | 1.03e+00 | -0.2682 |
| 89797 | NAV2 | EEC-subject2 | Human | Endometrium | EEC | 1.65e-11 | 5.01e-01 | -0.2607 |
| 89797 | NAV2 | EEC-subject3 | Human | Endometrium | EEC | 5.93e-21 | 7.44e-01 | -0.2525 |
| 89797 | NAV2 | EEC-subject4 | Human | Endometrium | EEC | 7.20e-19 | 7.22e-01 | -0.2571 |
| 89797 | NAV2 | EEC-subject5 | Human | Endometrium | EEC | 1.06e-12 | 5.12e-01 | -0.249 |
| 89797 | NAV2 | GSM5276934 | Human | Endometrium | EEC | 2.05e-02 | 2.90e-01 | -0.0913 |
| 89797 | NAV2 | GSM6177620_NYU_UCEC1_lib1_lib1 | Human | Endometrium | EEC | 5.76e-05 | 1.53e-01 | -0.1869 |
| 89797 | NAV2 | GSM6177620_NYU_UCEC1_lib2_lib2 | Human | Endometrium | EEC | 5.44e-04 | 1.93e-01 | -0.1875 |
| 89797 | NAV2 | GSM6177620_NYU_UCEC1_lib3_lib3 | Human | Endometrium | EEC | 1.90e-05 | 2.13e-01 | -0.1883 |
| 89797 | NAV2 | GSM6177622_NYU_UCEC3_lib2_lib2 | Human | Endometrium | EEC | 3.99e-07 | 1.16e-01 | -0.1916 |
| 89797 | NAV2 | LZE4T | Human | Esophagus | ESCC | 2.31e-09 | 2.62e-01 | 0.0811 |
| 89797 | NAV2 | LZE5T | Human | Esophagus | ESCC | 1.57e-03 | 3.16e-01 | 0.0514 |
| 89797 | NAV2 | LZE7T | Human | Esophagus | ESCC | 2.39e-04 | 3.68e-01 | 0.0667 |
| 89797 | NAV2 | LZE8T | Human | Esophagus | ESCC | 1.37e-04 | 9.78e-02 | 0.067 |
| Page: 1 2 3 4 5 6 7 |
| Tissue | Expression Dynamics | Abbreviation |
| Cervix | 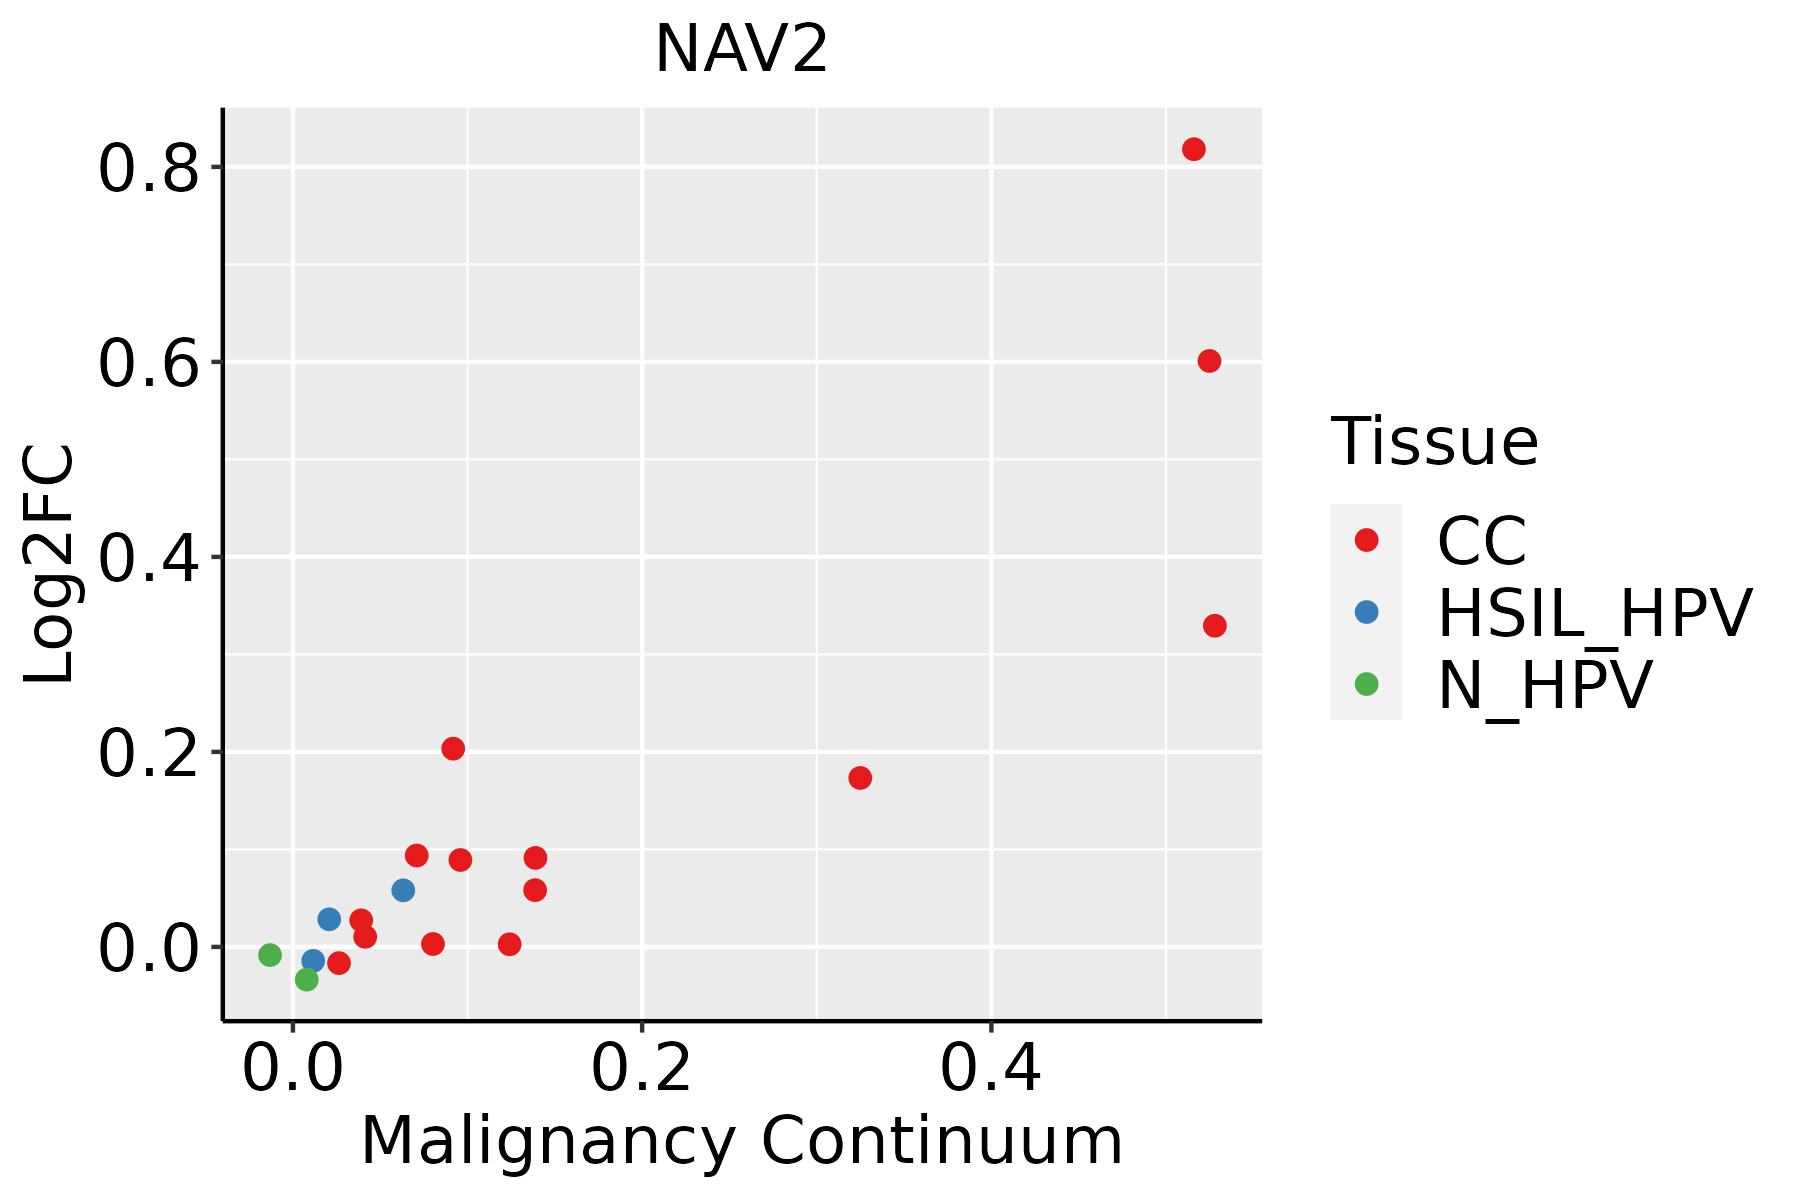 | CC: Cervix cancer |
| HSIL_HPV: HPV-infected high-grade squamous intraepithelial lesions | ||
| N_HPV: HPV-infected normal cervix | ||
| Endometrium | 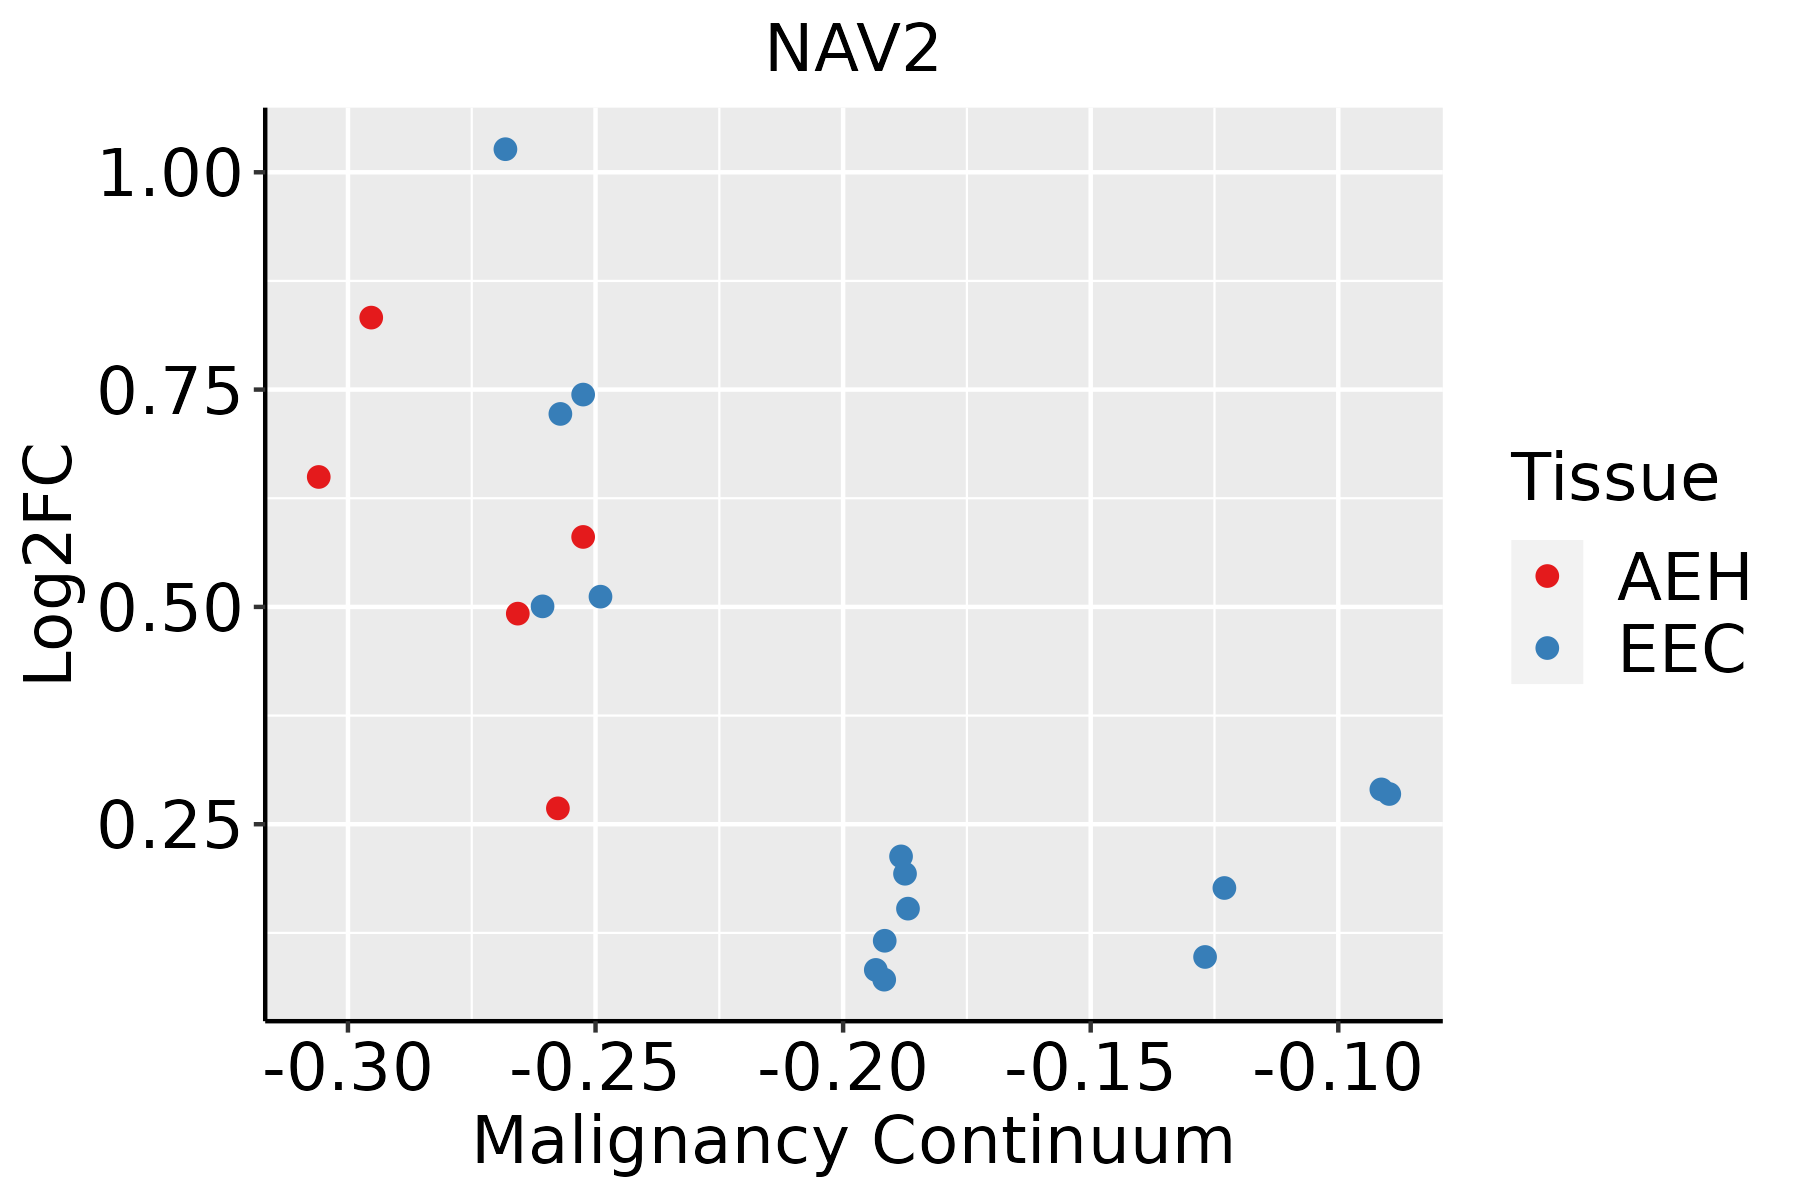 | AEH: Atypical endometrial hyperplasia |
| EEC: Endometrioid Cancer | ||
| Esophagus | 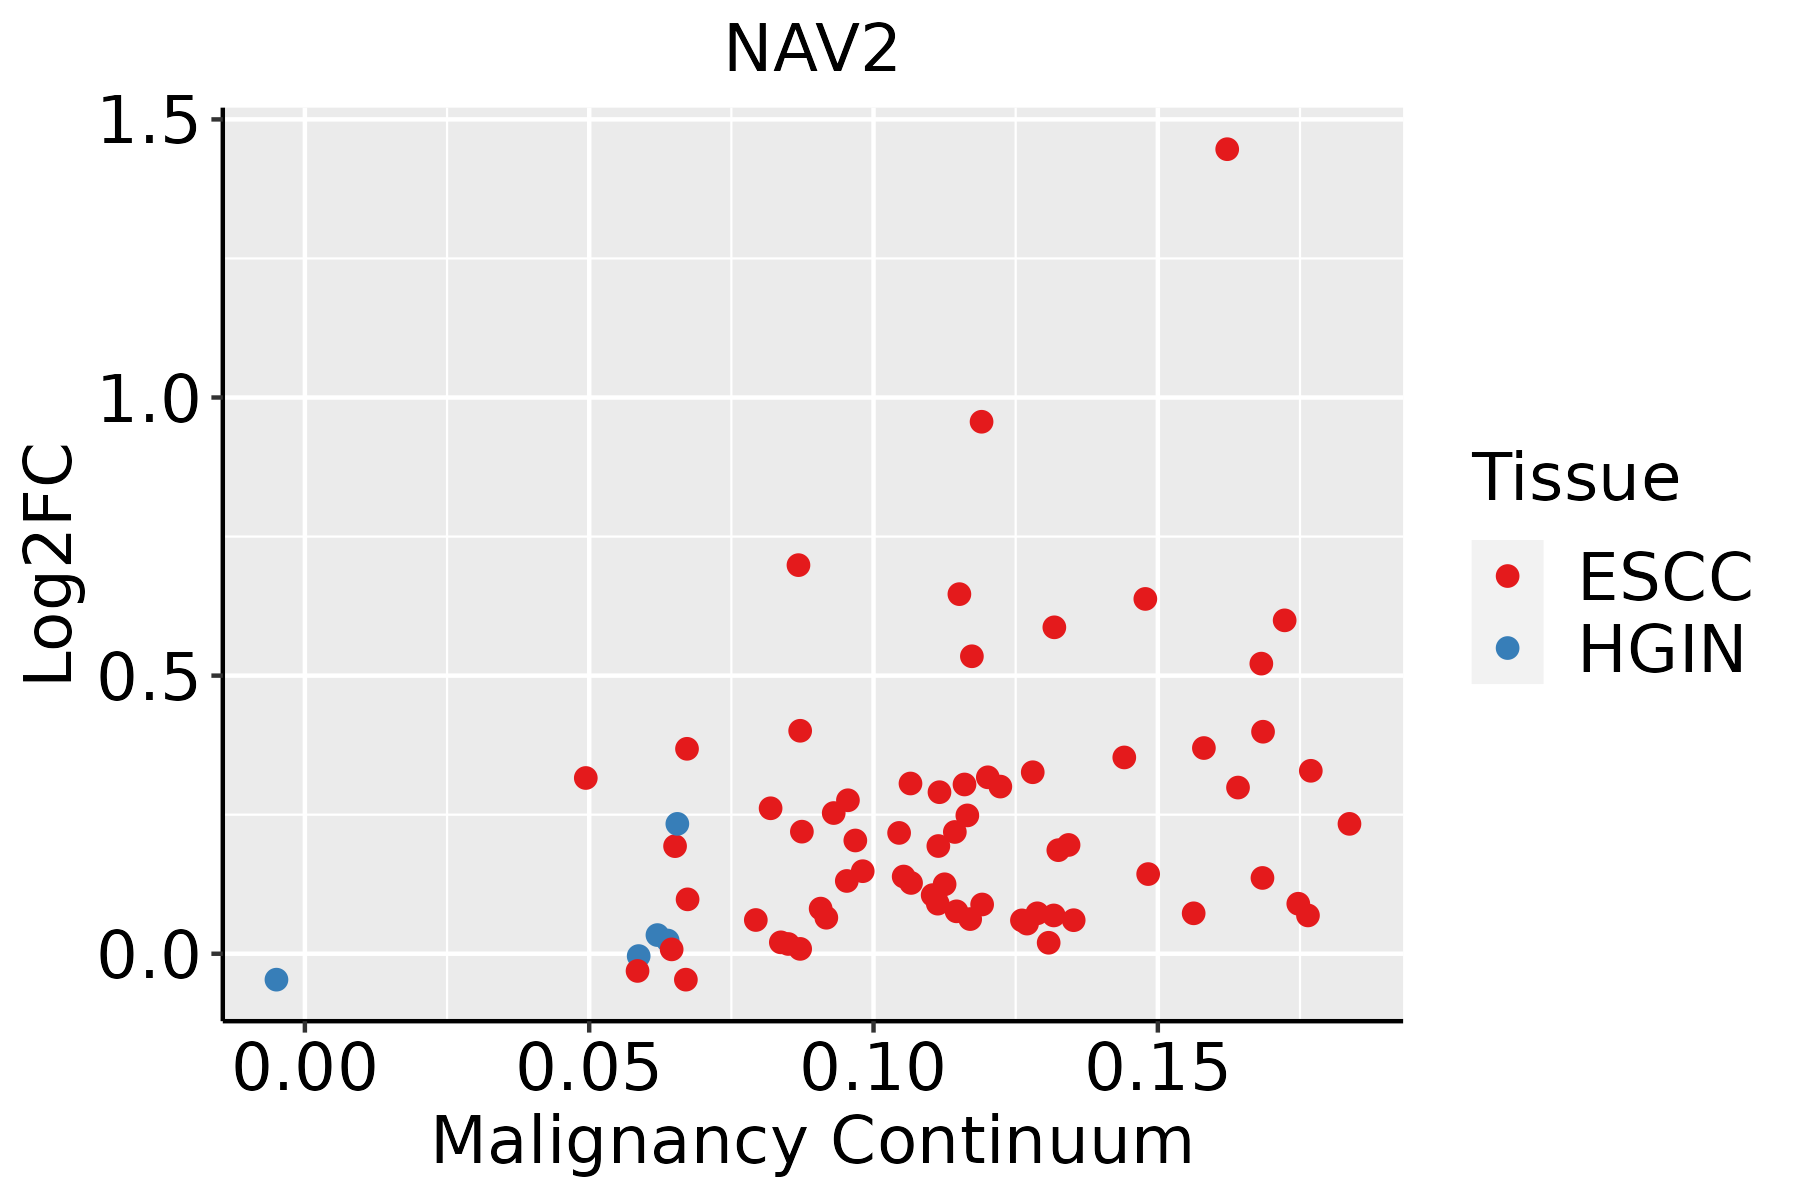 | ESCC: Esophageal squamous cell carcinoma |
| HGIN: High-grade intraepithelial neoplasias | ||
| LGIN: Low-grade intraepithelial neoplasias | ||
| Liver | 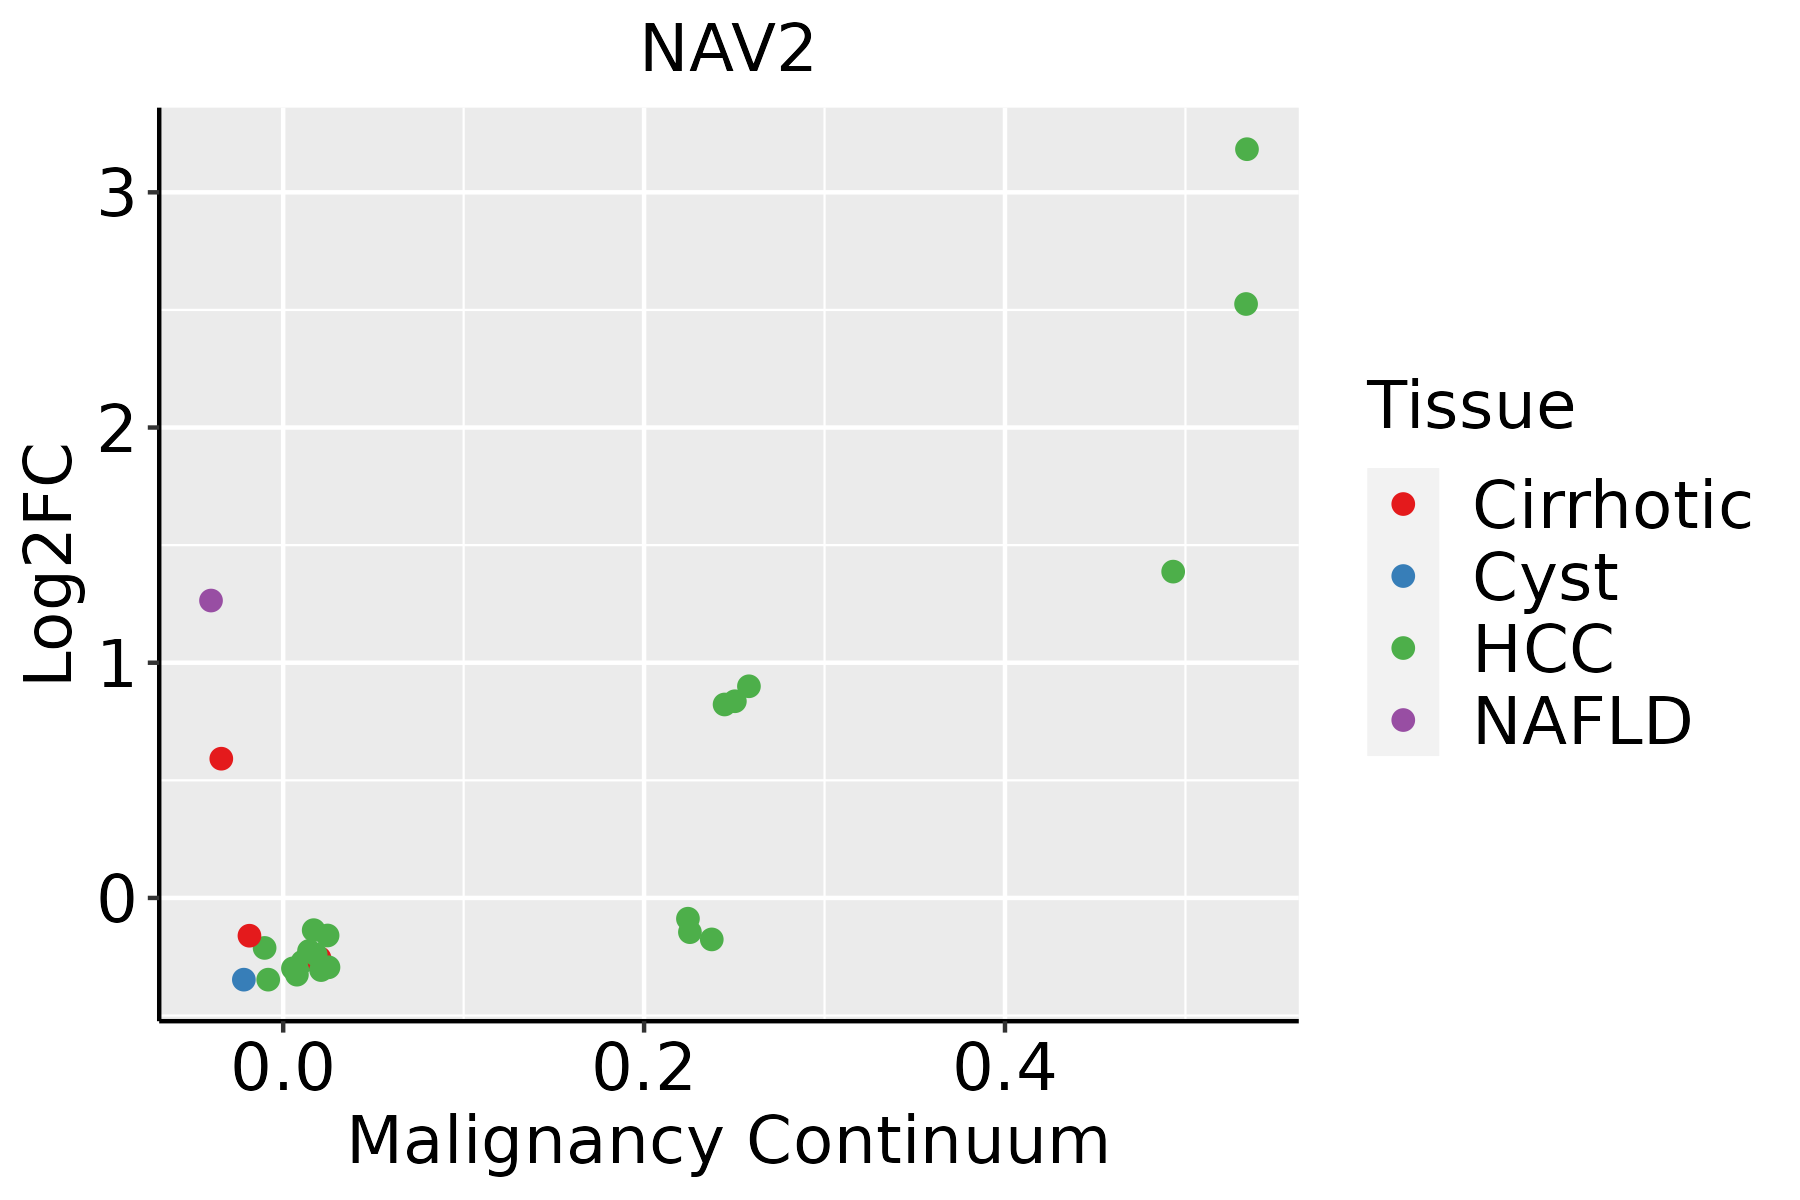 | HCC: Hepatocellular carcinoma |
| NAFLD: Non-alcoholic fatty liver disease | ||
| Lung | 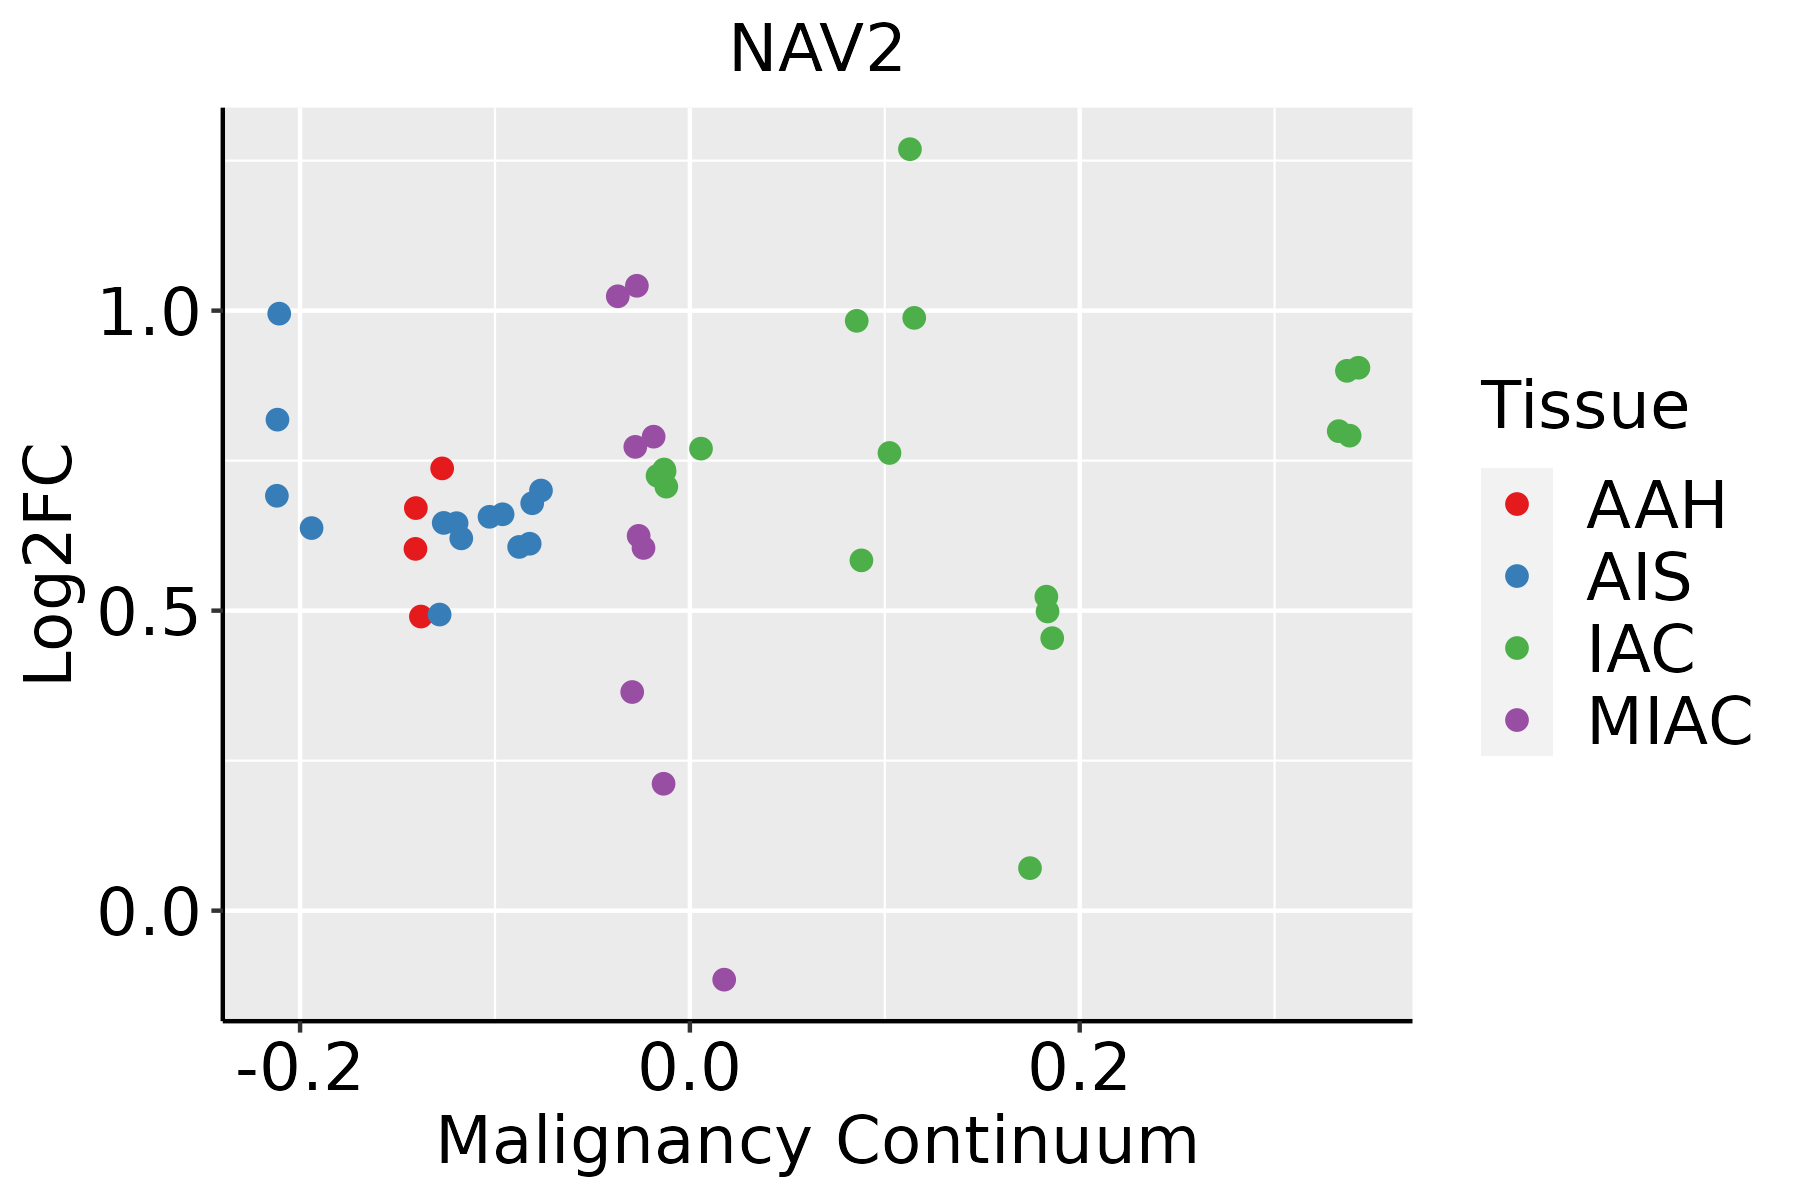 | AAH: Atypical adenomatous hyperplasia |
| AIS: Adenocarcinoma in situ | ||
| IAC: Invasive lung adenocarcinoma | ||
| MIA: Minimally invasive adenocarcinoma | ||
| Oral Cavity | 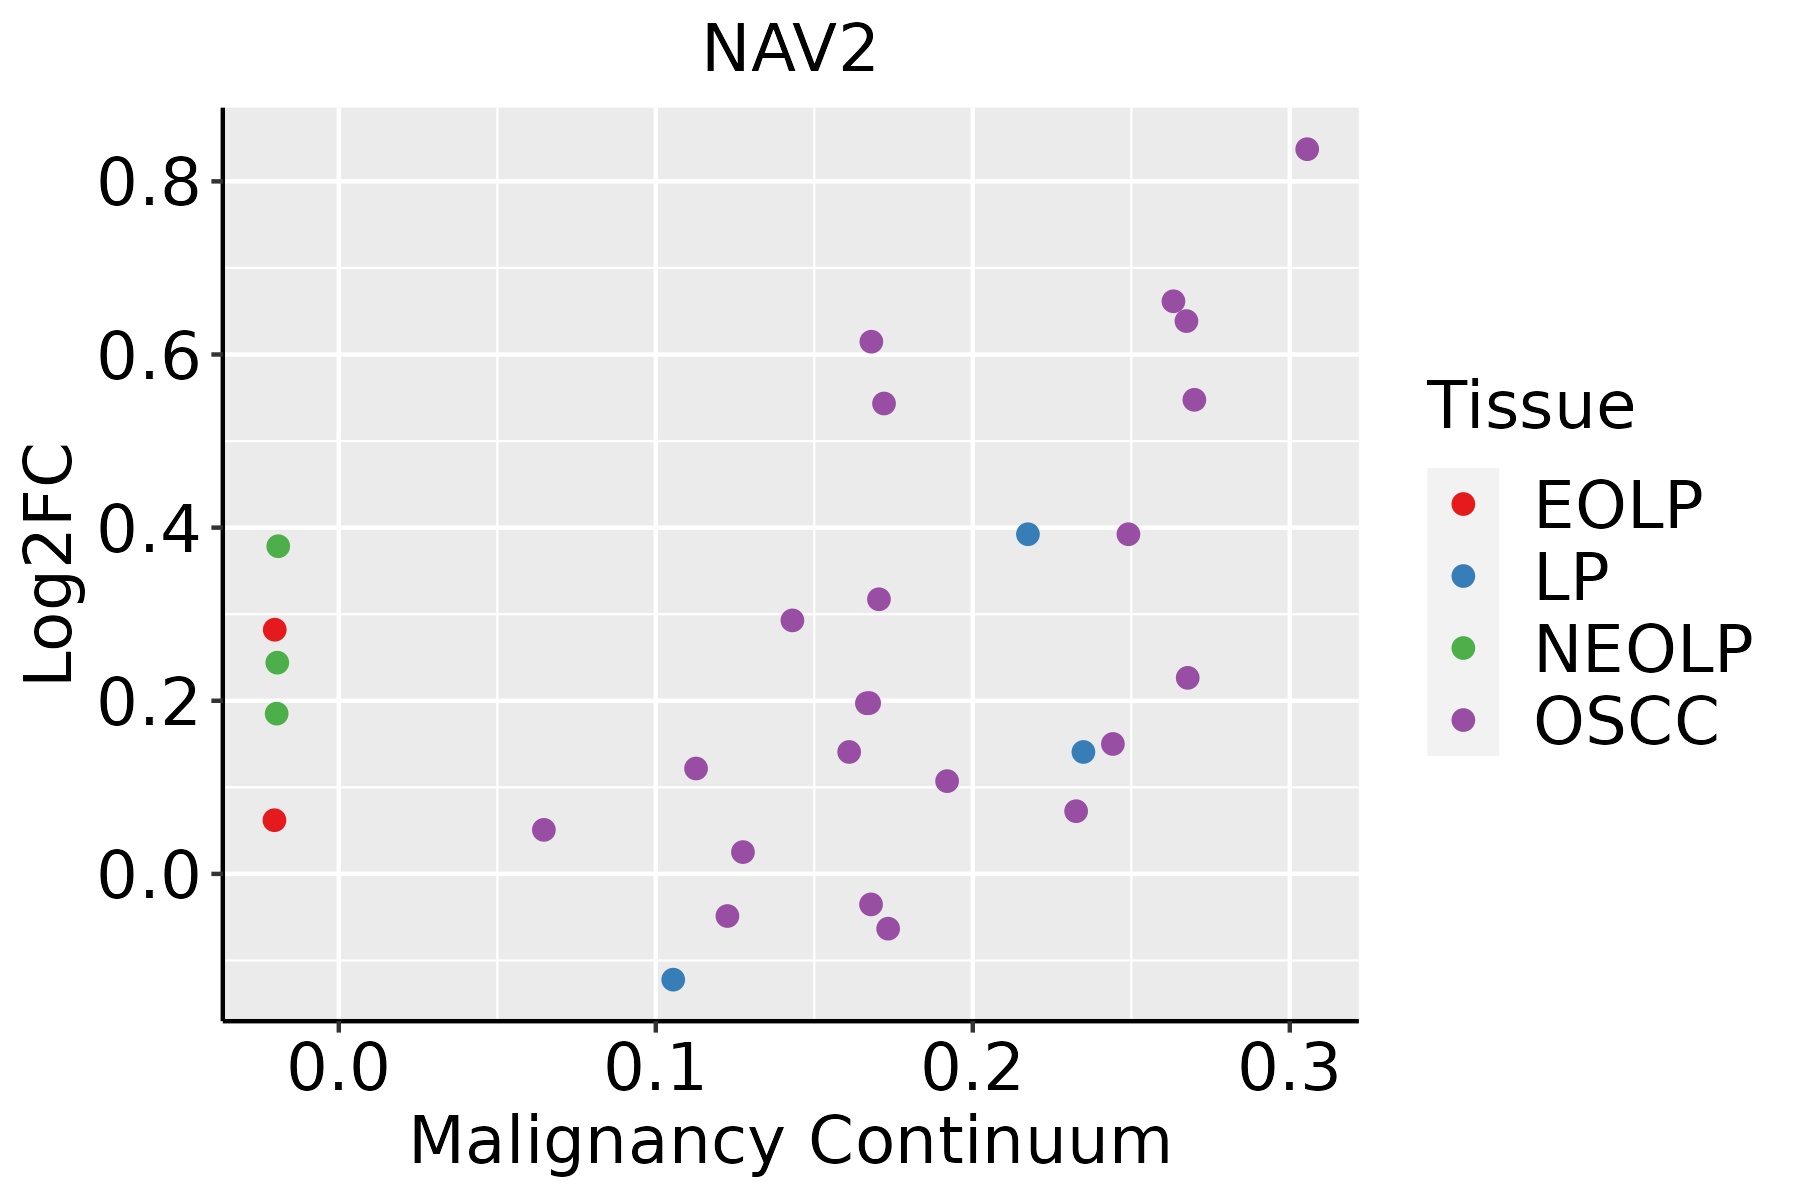 | EOLP: Erosive Oral lichen planus |
| LP: leukoplakia | ||
| NEOLP: Non-erosive oral lichen planus | ||
| OSCC: Oral squamous cell carcinoma | ||
| Prostate |  | BPH: Benign Prostatic Hyperplasia |
| Skin |  | AK: Actinic keratosis |
| cSCC: Cutaneous squamous cell carcinoma | ||
| SCCIS:squamous cell carcinoma in situ | ||
| Thyroid | 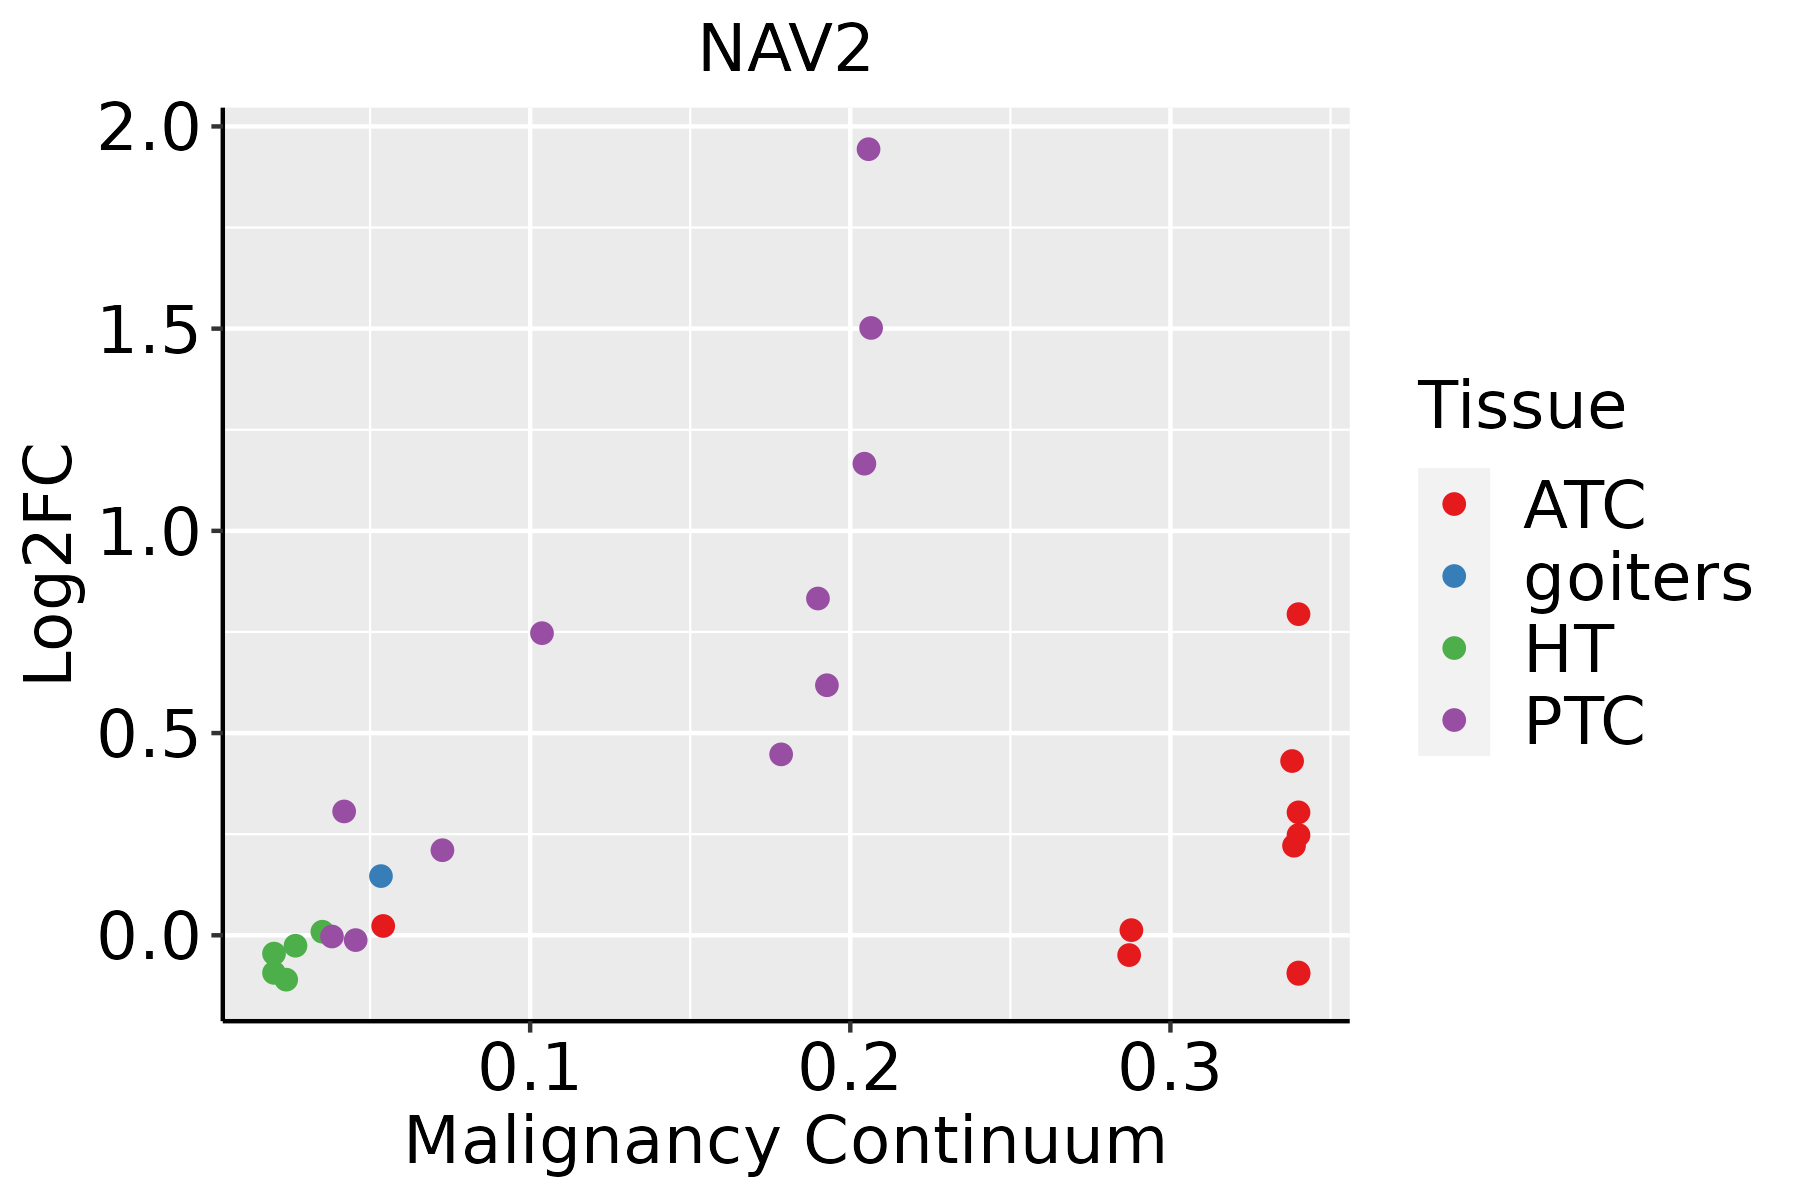 | ATC: Anaplastic thyroid cancer |
| HT: Hashimoto's thyroiditis | ||
| PTC: Papillary thyroid cancer |
| ∗log2FC in expression of this searched gene in stem-like cells from each diseased tissue sample relative to stem-like cells in normal samples in each tissue plotted against the malignancy continuum. Samples are colored based on if they are from different disease stage. |
Top |
Malignant transformation related pathway analysis |
| Find out the enriched GO biological processes and KEGG pathways involved in transition from healthy to precancer to cancer |
| Tissue | Disease Stage | Enriched GO biological Processes |
| Colorectum | AD |  |
| Colorectum | SER |  |
| Colorectum | MSS |  |
| Colorectum | MSI-H |  |
| Colorectum | FAP |  |
| ∗Top 15 enriched GO BP terms are showed in the bar plot of each disease state in each tissue. Each row represents a significant GO biological process which is colored according to the -log10(p.adjust). |
| Page: 1 2 3 4 5 6 7 8 9 |
| GO ID | Tissue | Disease Stage | Description | Gene Ratio | Bg Ratio | pvalue | p.adjust | Count |
| GO:00323923 | Cervix | CC | DNA geometric change | 21/2311 | 90/18723 | 2.71e-03 | 1.85e-02 | 21 |
| GO:003239214 | Esophagus | ESCC | DNA geometric change | 62/8552 | 90/18723 | 7.02e-06 | 7.04e-05 | 62 |
| GO:003250813 | Esophagus | ESCC | DNA duplex unwinding | 58/8552 | 84/18723 | 1.23e-05 | 1.14e-04 | 58 |
| GO:00323922 | Liver | NAFLD | DNA geometric change | 18/1882 | 90/18723 | 3.34e-03 | 2.93e-02 | 18 |
| GO:003239211 | Liver | HCC | DNA geometric change | 54/7958 | 90/18723 | 6.04e-04 | 3.79e-03 | 54 |
| GO:00325081 | Liver | HCC | DNA duplex unwinding | 49/7958 | 84/18723 | 2.46e-03 | 1.19e-02 | 49 |
| GO:0007626 | Lung | AIS | locomotory behavior | 31/1849 | 179/18723 | 1.39e-03 | 1.70e-02 | 31 |
| GO:00030731 | Lung | MIAC | regulation of systemic arterial blood pressure | 12/967 | 96/18723 | 3.86e-03 | 4.71e-02 | 12 |
| GO:00323925 | Oral cavity | OSCC | DNA geometric change | 59/7305 | 90/18723 | 3.03e-07 | 4.63e-06 | 59 |
| GO:00325083 | Oral cavity | OSCC | DNA duplex unwinding | 55/7305 | 84/18723 | 8.05e-07 | 1.12e-05 | 55 |
| GO:003239221 | Oral cavity | EOLP | DNA geometric change | 21/2218 | 90/18723 | 1.63e-03 | 1.09e-02 | 21 |
| GO:003250812 | Oral cavity | EOLP | DNA duplex unwinding | 19/2218 | 84/18723 | 3.84e-03 | 2.13e-02 | 19 |
| GO:003239231 | Oral cavity | NEOLP | DNA geometric change | 19/2005 | 90/18723 | 2.81e-03 | 1.73e-02 | 19 |
| GO:003250821 | Oral cavity | NEOLP | DNA duplex unwinding | 18/2005 | 84/18723 | 3.02e-03 | 1.84e-02 | 18 |
| GO:00323924 | Prostate | BPH | DNA geometric change | 26/3107 | 90/18723 | 2.46e-03 | 1.33e-02 | 26 |
| GO:00325082 | Prostate | BPH | DNA duplex unwinding | 24/3107 | 84/18723 | 4.13e-03 | 2.04e-02 | 24 |
| GO:003239212 | Prostate | Tumor | DNA geometric change | 27/3246 | 90/18723 | 2.15e-03 | 1.22e-02 | 27 |
| GO:003250811 | Prostate | Tumor | DNA duplex unwinding | 25/3246 | 84/18723 | 3.47e-03 | 1.79e-02 | 25 |
| GO:00323927 | Skin | AK | DNA geometric change | 23/1910 | 90/18723 | 2.53e-05 | 4.54e-04 | 23 |
| GO:00325085 | Skin | AK | DNA duplex unwinding | 21/1910 | 84/18723 | 7.93e-05 | 1.09e-03 | 21 |
| Page: 1 2 |
| Pathway ID | Tissue | Disease Stage | Description | Gene Ratio | Bg Ratio | pvalue | p.adjust | qvalue | Count |
| Page: 1 |
Top |
Cell-cell communication analysis |
| Identification of potential cell-cell interactions between two cell types and their ligand-receptor pairs for different disease states |
| Ligand | Receptor | LRpair | Pathway | Tissue | Disease Stage |
| Page: 1 |
Top |
Single-cell gene regulatory network inference analysis |
| Find out the significant the regulons (TFs) and the target genes of each regulon across cell types for different disease states |
| TF | Cell Type | Tissue | Disease Stage | Target Gene | RSS | Regulon Activity |
| ∗The dot plots of a searched regulon are shown for all cell subpopulations in each disease state of each tissue based on the regulon specific score inferred using pySCENIC and by calculating the average expression. |
| Page: 1 |
Top |
Somatic mutation of malignant transformation related genes |
| Annotation of somatic variants for genes involved in malignant transformation |
| Hugo Symbol | Variant Class | Variant Classification | dbSNP RS | HGVSc | HGVSp | HGVSp Short | SWISSPROT | BIOTYPE | SIFT | PolyPhen | Tumor Sample Barcode | Tissue | Histology | Sex | Age | Stage | Therapy Types | Drugs | Outcome |
| NAV2 | SNV | Missense_Mutation | c.4325G>T | p.Ser1442Ile | p.S1442I | Q8IVL1 | protein_coding | deleterious(0.02) | benign(0.229) | TCGA-A2-A0CT-01 | Breast | breast invasive carcinoma | Female | >=65 | I/II | Chemotherapy | cytoxan | SD | |
| NAV2 | SNV | Missense_Mutation | rs376137371 | c.1996N>A | p.Gly666Arg | p.G666R | Q8IVL1 | protein_coding | tolerated(0.07) | possibly_damaging(0.648) | TCGA-A8-A08C-01 | Breast | breast invasive carcinoma | Female | >=65 | I/II | Chemotherapy | 5-fluorouracil | CR |
| NAV2 | SNV | Missense_Mutation | c.6274N>G | p.Arg2092Gly | p.R2092G | Q8IVL1 | protein_coding | deleterious(0.02) | probably_damaging(0.998) | TCGA-A8-A09A-01 | Breast | breast invasive carcinoma | Female | <65 | I/II | Hormone Therapy | tamoxiphen | SD | |
| NAV2 | SNV | Missense_Mutation | c.4819N>G | p.Phe1607Val | p.F1607V | Q8IVL1 | protein_coding | deleterious(0) | benign(0.051) | TCGA-A8-A09M-01 | Breast | breast invasive carcinoma | Female | >=65 | III/IV | Chemotherapy | paclitaxel | CR | |
| NAV2 | SNV | Missense_Mutation | rs141984254 | c.4319C>G | p.Ser1440Cys | p.S1440C | Q8IVL1 | protein_coding | tolerated(0.08) | probably_damaging(0.998) | TCGA-AC-A23H-01 | Breast | breast invasive carcinoma | Female | >=65 | I/II | Unknown | Unknown | PD |
| NAV2 | SNV | Missense_Mutation | c.6425G>C | p.Arg2142Pro | p.R2142P | Q8IVL1 | protein_coding | deleterious(0) | probably_damaging(0.999) | TCGA-AN-A0FL-01 | Breast | breast invasive carcinoma | Female | <65 | I/II | Unknown | Unknown | SD | |
| NAV2 | SNV | Missense_Mutation | rs751945616 | c.6098N>T | p.Ser2033Phe | p.S2033F | Q8IVL1 | protein_coding | deleterious(0.05) | possibly_damaging(0.543) | TCGA-B6-A0RQ-01 | Breast | breast invasive carcinoma | Female | >=65 | I/II | Unknown | Unknown | SD |
| NAV2 | SNV | Missense_Mutation | c.2063A>G | p.Asn688Ser | p.N688S | Q8IVL1 | protein_coding | tolerated(1) | benign(0) | TCGA-BH-A18N-01 | Breast | breast invasive carcinoma | Female | >=65 | I/II | Unknown | Unknown | SD | |
| NAV2 | SNV | Missense_Mutation | c.1889G>A | p.Gly630Asp | p.G630D | Q8IVL1 | protein_coding | tolerated(0.14) | benign(0.146) | TCGA-D8-A1J8-01 | Breast | breast invasive carcinoma | Female | >=65 | I/II | Hormone Therapy | nolvadex | SD | |
| NAV2 | SNV | Missense_Mutation | c.5563N>T | p.His1855Tyr | p.H1855Y | Q8IVL1 | protein_coding | tolerated(0.4) | probably_damaging(0.968) | TCGA-D8-A27G-01 | Breast | breast invasive carcinoma | Female | >=65 | I/II | Unknown | Unknown | SD |
| Page: 1 2 3 4 5 6 7 8 9 10 11 12 13 14 15 16 17 18 19 20 21 22 23 24 25 26 27 28 29 30 |
Top |
Related drugs of malignant transformation related genes |
| Identification of chemicals and drugs interact with genes involved in malignant transfromation |
| (DGIdb 4.0) |
| Entrez ID | Symbol | Category | Interaction Types | Drug Claim Name | Drug Name | PMIDs |
| Page: 1 |

Copyright 2023-Present -The University of Texas Health Science Center at Houston |