
|
|||||
|
 | |
| |
| |
| |
| |
| |
|
Gene: NAV1 |
Gene summary for NAV1 |
| Gene information | Species | Human | Gene symbol | NAV1 | Gene ID | 89796 |
| Gene name | neuron navigator 1 | |
| Gene Alias | POMFIL3 | |
| Cytomap | 1q32.1 | |
| Gene Type | protein-coding | GO ID | GO:0000226 | UniProtAcc | Q8NEY1 |
Top |
Malignant transformation analysis |
| Identification of the aberrant gene expression in precancerous and cancerous lesions by comparing the gene expression of stem-like cells in diseased tissues with normal stem cells |
| Entrez ID | Symbol | Replicates | Species | Organ | Tissue | Adj P-value | Log2FC | Malignancy |
| 89796 | NAV1 | CCI_1 | Human | Cervix | CC | 1.20e-02 | 8.61e-01 | 0.528 |
| 89796 | NAV1 | CCI_3 | Human | Cervix | CC | 1.09e-05 | 6.32e-01 | 0.516 |
| 89796 | NAV1 | LZE4T | Human | Esophagus | ESCC | 3.12e-30 | 1.10e+00 | 0.0811 |
| 89796 | NAV1 | LZE7T | Human | Esophagus | ESCC | 1.10e-11 | 7.74e-01 | 0.0667 |
| 89796 | NAV1 | LZE21D1 | Human | Esophagus | HGIN | 6.28e-03 | 4.78e-01 | 0.0632 |
| 89796 | NAV1 | LZE24T | Human | Esophagus | ESCC | 1.51e-02 | 9.91e-02 | 0.0596 |
| 89796 | NAV1 | LZE21T | Human | Esophagus | ESCC | 1.48e-06 | 4.73e-01 | 0.0655 |
| 89796 | NAV1 | P1T-E | Human | Esophagus | ESCC | 9.75e-03 | 2.23e-01 | 0.0875 |
| 89796 | NAV1 | P2T-E | Human | Esophagus | ESCC | 3.14e-13 | 2.77e-01 | 0.1177 |
| 89796 | NAV1 | P4T-E | Human | Esophagus | ESCC | 5.89e-10 | 2.86e-01 | 0.1323 |
| 89796 | NAV1 | P5T-E | Human | Esophagus | ESCC | 4.15e-11 | 3.04e-01 | 0.1327 |
| 89796 | NAV1 | P8T-E | Human | Esophagus | ESCC | 3.53e-03 | 1.28e-01 | 0.0889 |
| 89796 | NAV1 | P9T-E | Human | Esophagus | ESCC | 1.82e-54 | 1.16e+00 | 0.1131 |
| 89796 | NAV1 | P10T-E | Human | Esophagus | ESCC | 1.56e-07 | 2.33e-01 | 0.116 |
| 89796 | NAV1 | P11T-E | Human | Esophagus | ESCC | 6.03e-12 | 5.94e-01 | 0.1426 |
| 89796 | NAV1 | P15T-E | Human | Esophagus | ESCC | 3.27e-13 | 3.40e-01 | 0.1149 |
| 89796 | NAV1 | P17T-E | Human | Esophagus | ESCC | 1.52e-08 | 4.47e-01 | 0.1278 |
| 89796 | NAV1 | P19T-E | Human | Esophagus | ESCC | 9.18e-08 | 6.37e-01 | 0.1662 |
| 89796 | NAV1 | P21T-E | Human | Esophagus | ESCC | 8.83e-20 | 4.82e-01 | 0.1617 |
| 89796 | NAV1 | P22T-E | Human | Esophagus | ESCC | 6.34e-25 | 4.78e-01 | 0.1236 |
| Page: 1 2 3 4 5 |
| Tissue | Expression Dynamics | Abbreviation |
| Cervix | 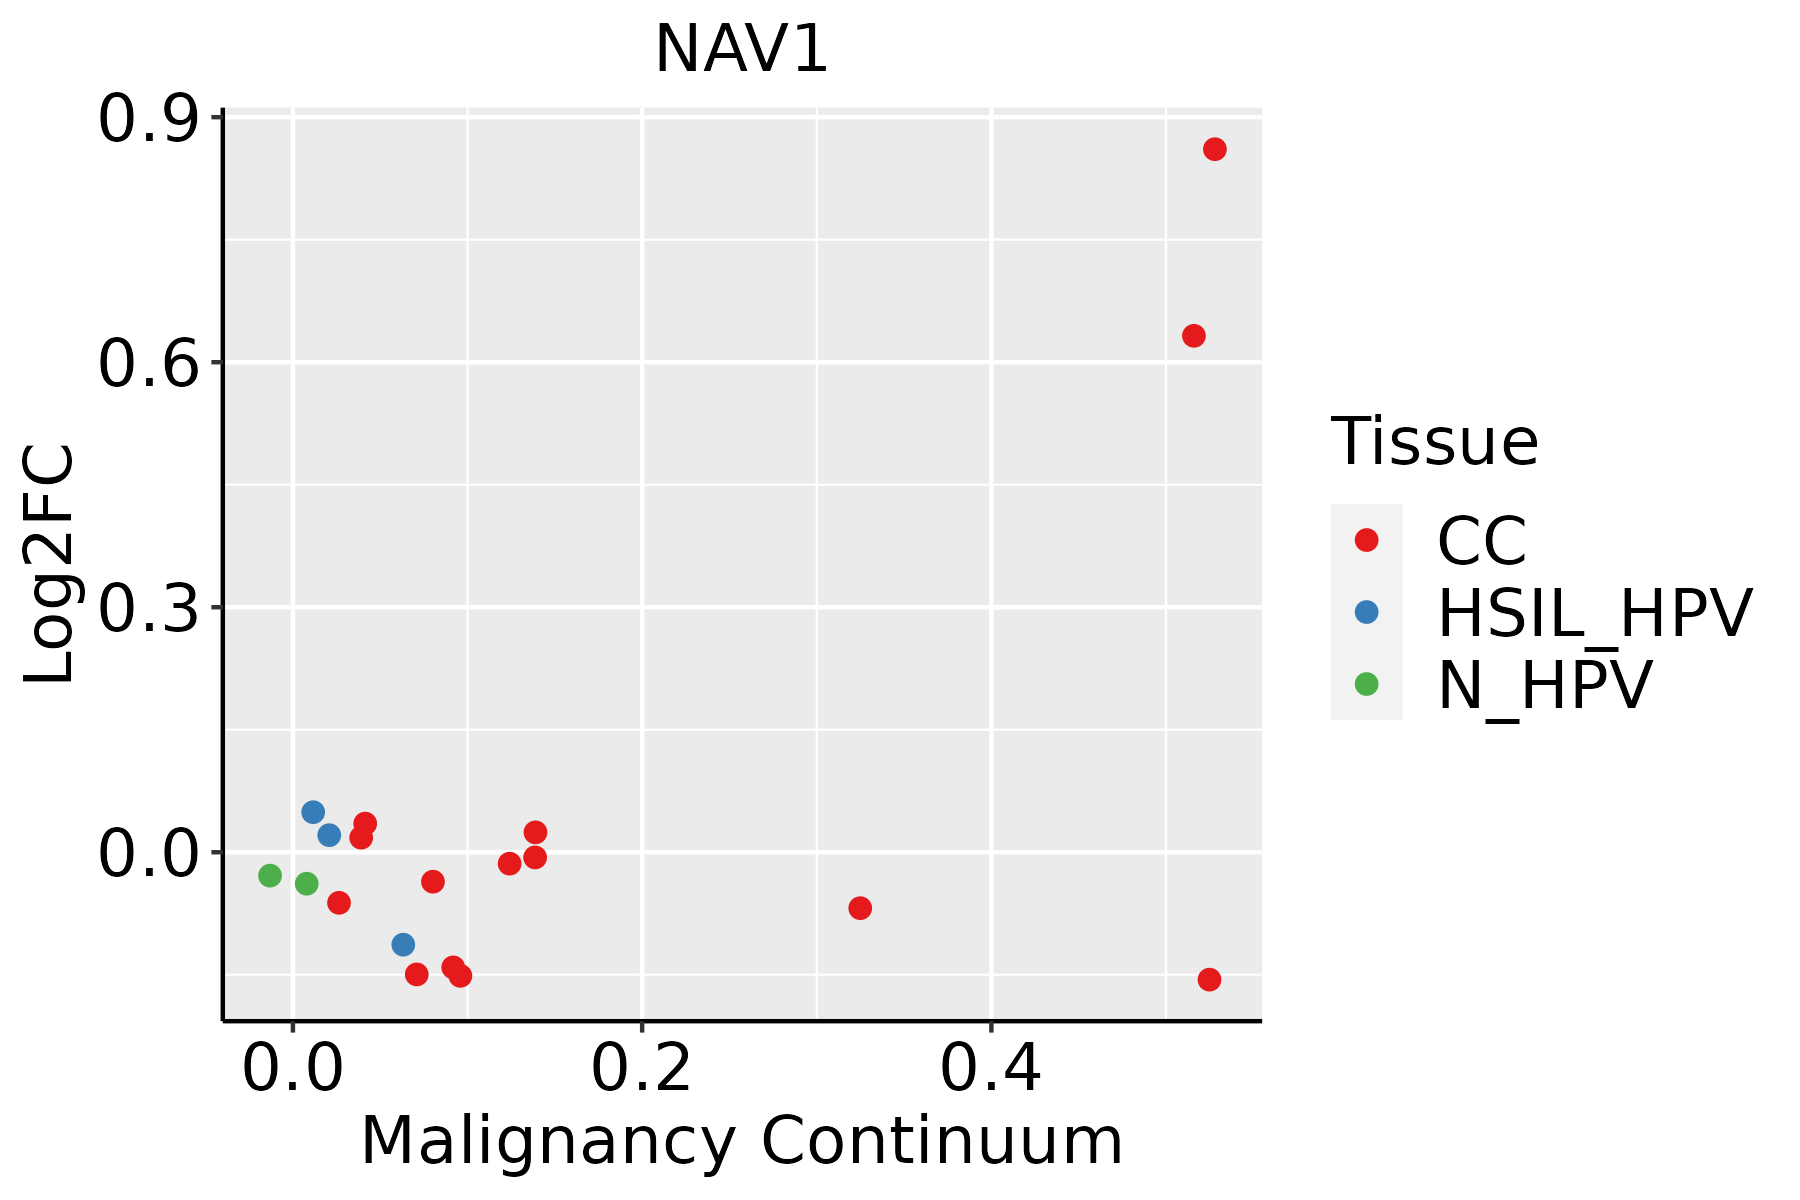 | CC: Cervix cancer |
| HSIL_HPV: HPV-infected high-grade squamous intraepithelial lesions | ||
| N_HPV: HPV-infected normal cervix | ||
| Esophagus | 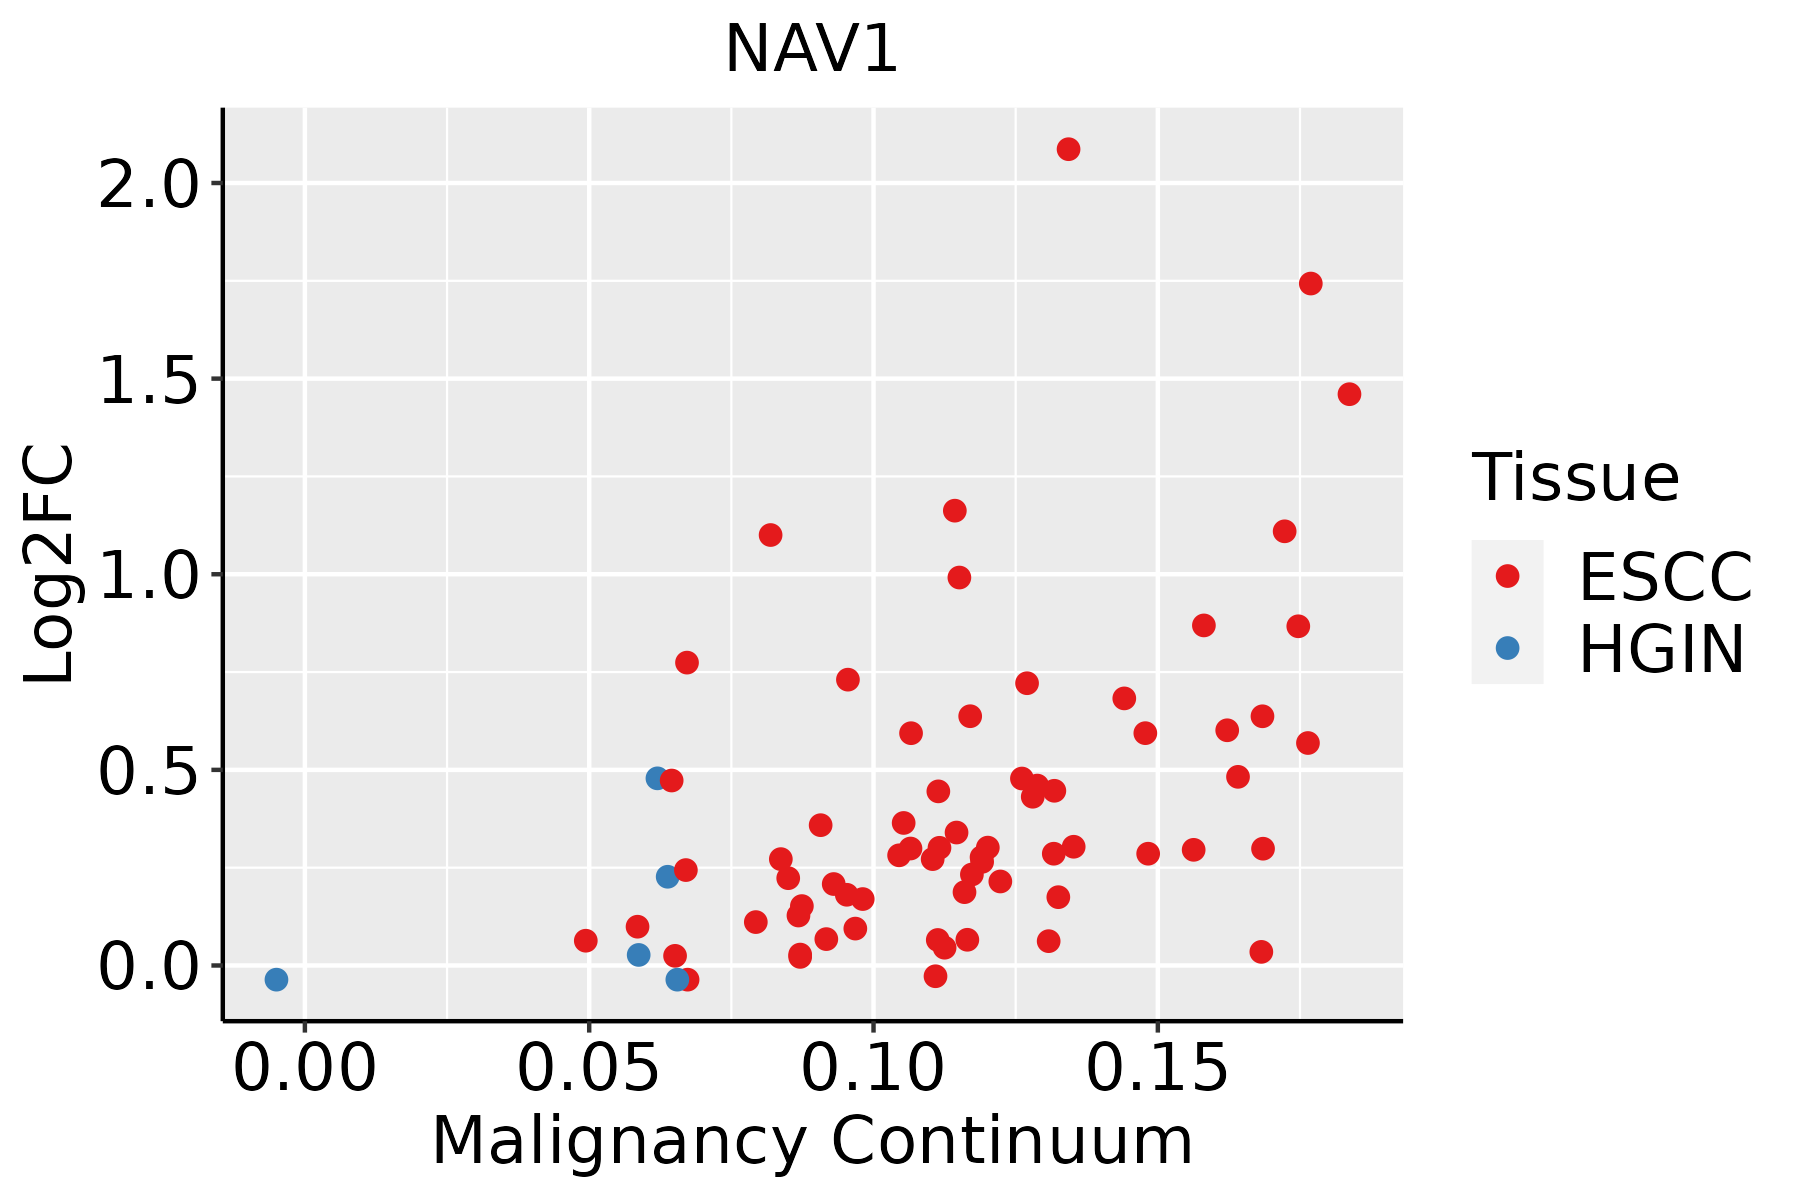 | ESCC: Esophageal squamous cell carcinoma |
| HGIN: High-grade intraepithelial neoplasias | ||
| LGIN: Low-grade intraepithelial neoplasias | ||
| Oral Cavity | 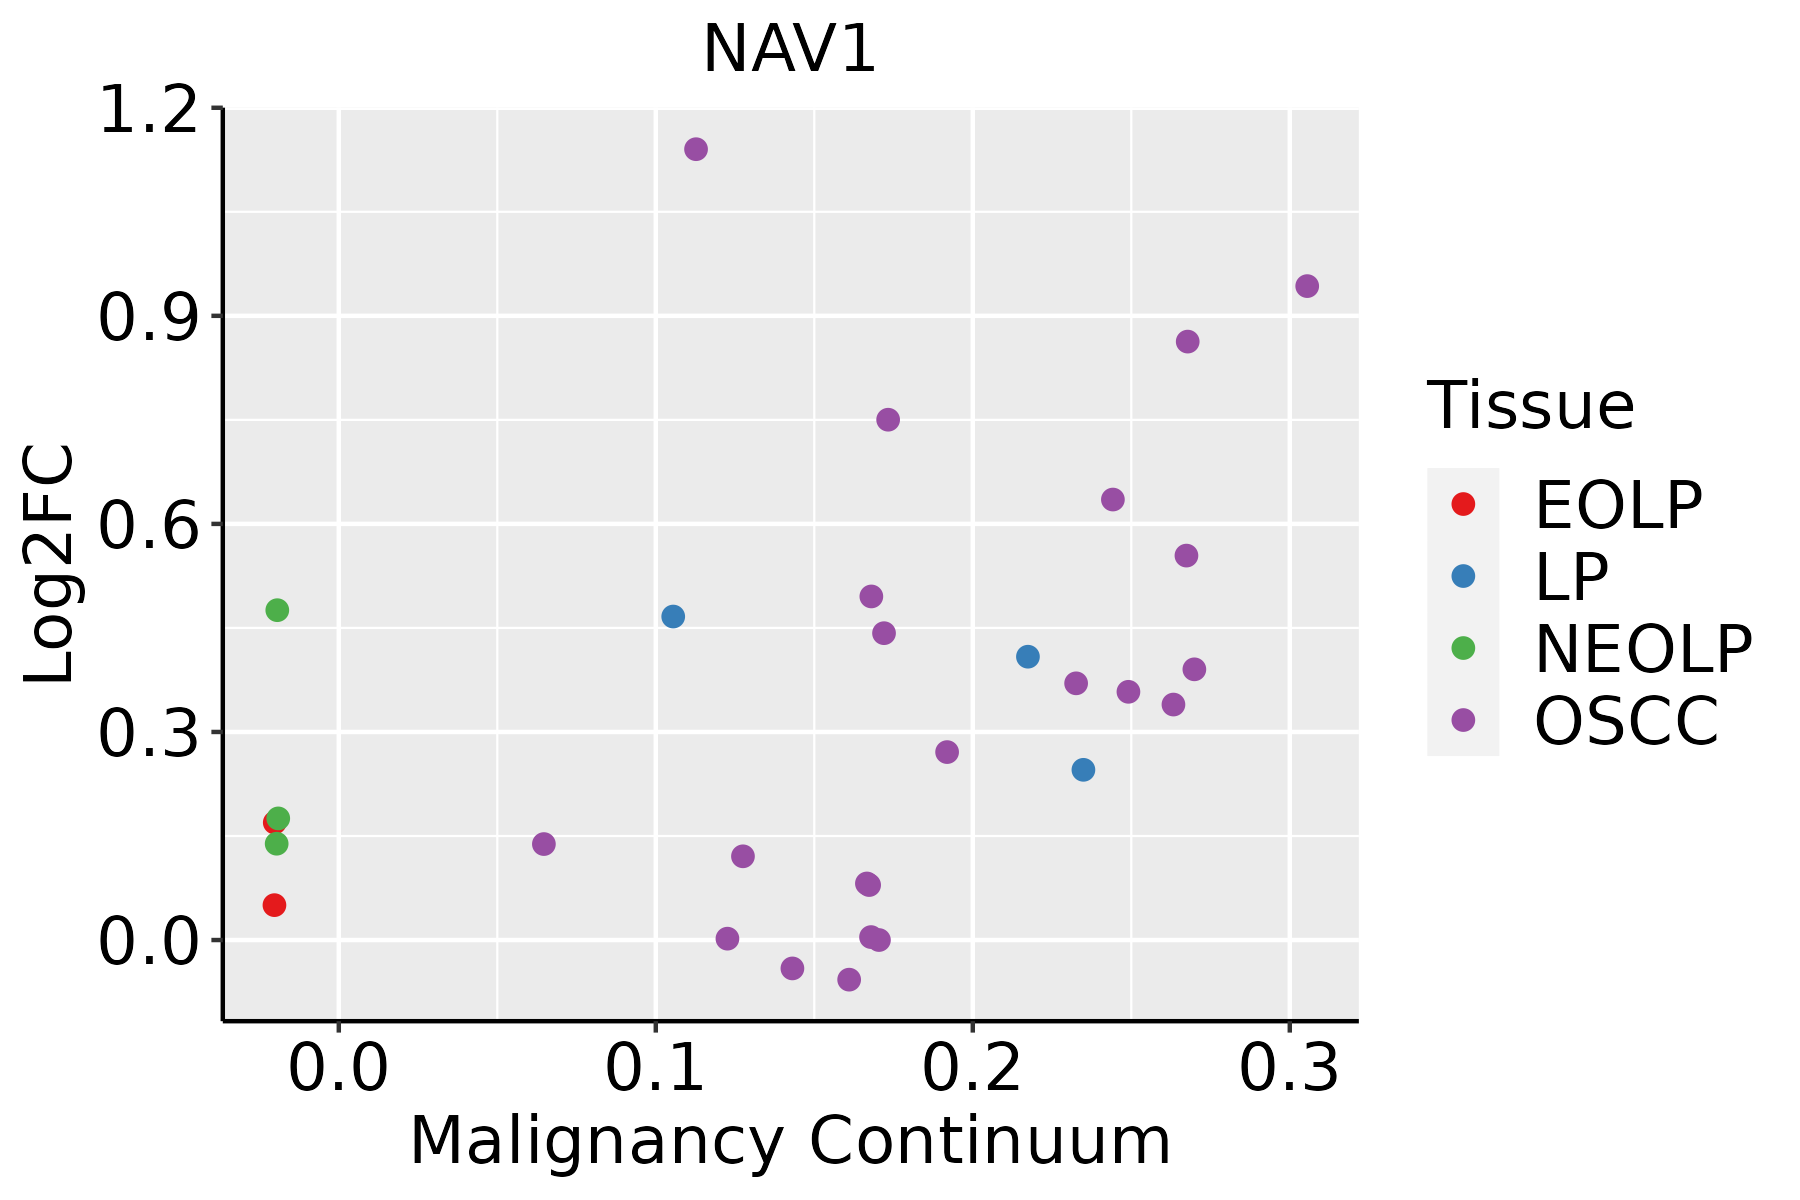 | EOLP: Erosive Oral lichen planus |
| LP: leukoplakia | ||
| NEOLP: Non-erosive oral lichen planus | ||
| OSCC: Oral squamous cell carcinoma | ||
| Skin | 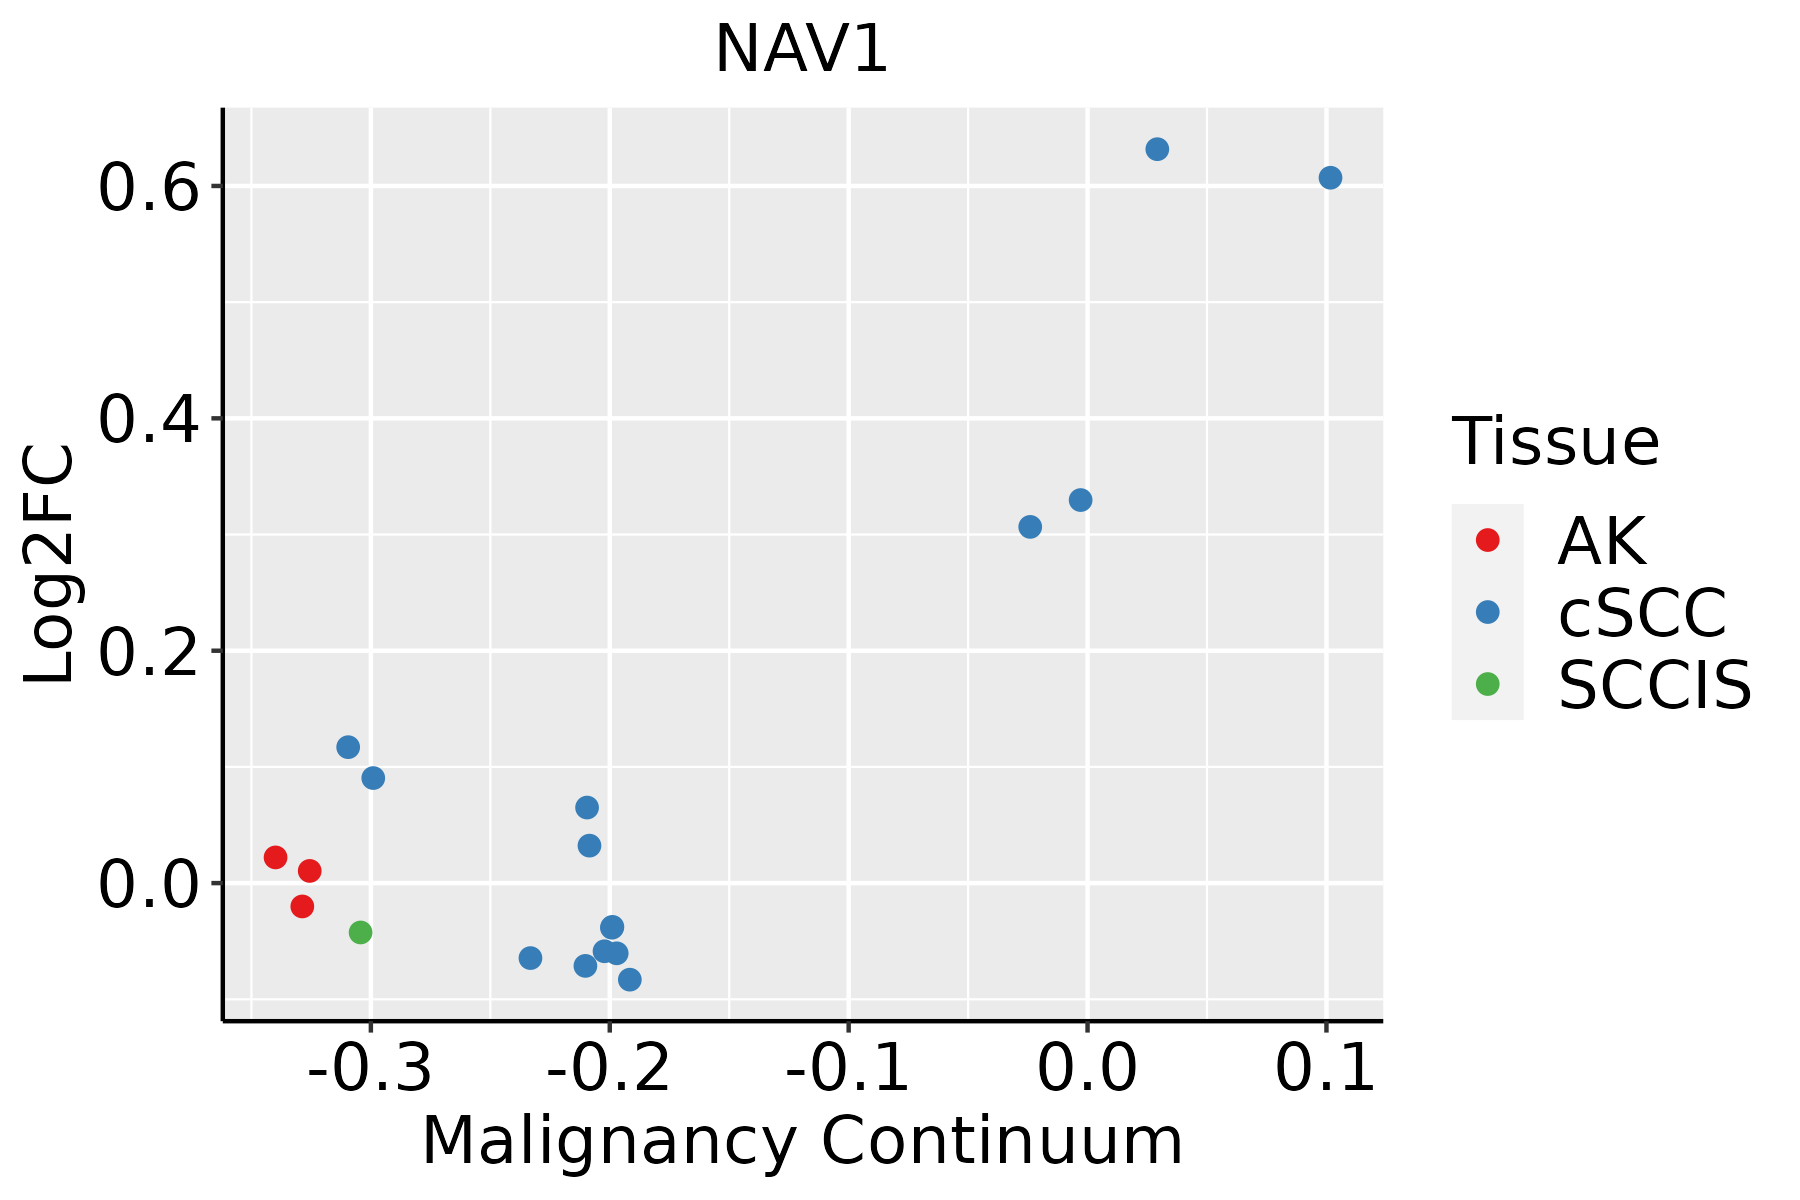 | AK: Actinic keratosis |
| cSCC: Cutaneous squamous cell carcinoma | ||
| SCCIS:squamous cell carcinoma in situ | ||
| Thyroid |  | ATC: Anaplastic thyroid cancer |
| HT: Hashimoto's thyroiditis | ||
| PTC: Papillary thyroid cancer |
| ∗log2FC in expression of this searched gene in stem-like cells from each diseased tissue sample relative to stem-like cells in normal samples in each tissue plotted against the malignancy continuum. Samples are colored based on if they are from different disease stage. |
Top |
Malignant transformation related pathway analysis |
| Find out the enriched GO biological processes and KEGG pathways involved in transition from healthy to precancer to cancer |
| Tissue | Disease Stage | Enriched GO biological Processes |
| Colorectum | AD |  |
| Colorectum | SER |  |
| Colorectum | MSS |  |
| Colorectum | MSI-H |  |
| Colorectum | FAP |  |
| ∗Top 15 enriched GO BP terms are showed in the bar plot of each disease state in each tissue. Each row represents a significant GO biological process which is colored according to the -log10(p.adjust). |
| Page: 1 2 3 4 5 6 7 8 9 |
| GO ID | Tissue | Disease Stage | Description | Gene Ratio | Bg Ratio | pvalue | p.adjust | Count |
| GO:00017643 | Oral cavity | NEOLP | neuron migration | 31/2005 | 156/18723 | 4.96e-04 | 4.40e-03 | 31 |
| Page: 1 |
| Pathway ID | Tissue | Disease Stage | Description | Gene Ratio | Bg Ratio | pvalue | p.adjust | qvalue | Count |
| Page: 1 |
Top |
Cell-cell communication analysis |
| Identification of potential cell-cell interactions between two cell types and their ligand-receptor pairs for different disease states |
| Ligand | Receptor | LRpair | Pathway | Tissue | Disease Stage |
| Page: 1 |
Top |
Single-cell gene regulatory network inference analysis |
| Find out the significant the regulons (TFs) and the target genes of each regulon across cell types for different disease states |
| TF | Cell Type | Tissue | Disease Stage | Target Gene | RSS | Regulon Activity |
| ∗The dot plots of a searched regulon are shown for all cell subpopulations in each disease state of each tissue based on the regulon specific score inferred using pySCENIC and by calculating the average expression. |
| Page: 1 |
Top |
Somatic mutation of malignant transformation related genes |
| Annotation of somatic variants for genes involved in malignant transformation |
| Hugo Symbol | Variant Class | Variant Classification | dbSNP RS | HGVSc | HGVSp | HGVSp Short | SWISSPROT | BIOTYPE | SIFT | PolyPhen | Tumor Sample Barcode | Tissue | Histology | Sex | Age | Stage | Therapy Types | Drugs | Outcome |
| NAV1 | SNV | Missense_Mutation | novel | c.3223N>A | p.Glu1075Lys | p.E1075K | Q8NEY1 | protein_coding | deleterious(0) | probably_damaging(0.94) | TCGA-3C-AALI-01 | Breast | breast invasive carcinoma | Female | <65 | I/II | Unspecific | Poly E | Complete Response |
| NAV1 | SNV | Missense_Mutation | novel | c.2251N>A | p.Asp751Asn | p.D751N | Q8NEY1 | protein_coding | tolerated(0.07) | benign(0.222) | TCGA-5L-AAT1-01 | Breast | breast invasive carcinoma | Female | <65 | III/IV | Hormone Therapy | letrozol | SD |
| NAV1 | SNV | Missense_Mutation | novel | c.3127A>G | p.Met1043Val | p.M1043V | Q8NEY1 | protein_coding | deleterious(0.01) | benign(0.237) | TCGA-A7-A5ZX-01 | Breast | breast invasive carcinoma | Female | <65 | III/IV | Chemotherapy | doxorubicin | CR |
| NAV1 | SNV | Missense_Mutation | c.1781N>T | p.Ser594Leu | p.S594L | Q8NEY1 | protein_coding | deleterious(0) | probably_damaging(1) | TCGA-A8-A06Q-01 | Breast | breast invasive carcinoma | Female | <65 | III/IV | Unknown | Unknown | SD | |
| NAV1 | SNV | Missense_Mutation | c.1112N>T | p.Arg371Leu | p.R371L | Q8NEY1 | protein_coding | deleterious(0.01) | benign(0.175) | TCGA-A8-A07I-01 | Breast | breast invasive carcinoma | Female | >=65 | III/IV | Chemotherapy | 5-fluorouracil | CR | |
| NAV1 | SNV | Missense_Mutation | novel | c.4262N>G | p.Leu1421Arg | p.L1421R | Q8NEY1 | protein_coding | deleterious(0.01) | possibly_damaging(0.81) | TCGA-A8-A0A4-01 | Breast | breast invasive carcinoma | Female | >=65 | I/II | Hormone Therapy | tamoxiphen | CR |
| NAV1 | SNV | Missense_Mutation | rs756027772 | c.1754N>A | p.Arg585His | p.R585H | Q8NEY1 | protein_coding | tolerated(0.32) | benign(0.031) | TCGA-AC-A3YJ-01 | Breast | breast invasive carcinoma | Female | >=65 | I/II | Hormone Therapy | arimidex | SD |
| NAV1 | SNV | Missense_Mutation | c.3314N>G | p.Ser1105Cys | p.S1105C | Q8NEY1 | protein_coding | deleterious(0) | probably_damaging(0.982) | TCGA-AN-A0XW-01 | Breast | breast invasive carcinoma | Female | <65 | III/IV | Unknown | Unknown | SD | |
| NAV1 | SNV | Missense_Mutation | rs765580417 | c.2957N>T | p.Pro986Leu | p.P986L | Q8NEY1 | protein_coding | tolerated(0.11) | benign(0.003) | TCGA-AO-A03R-01 | Breast | breast invasive carcinoma | Female | <65 | I/II | Chemotherapy | doxorubicin | SD |
| NAV1 | SNV | Missense_Mutation | c.510N>T | p.Lys170Asn | p.K170N | Q8NEY1 | protein_coding | deleterious(0.04) | possibly_damaging(0.525) | TCGA-B6-A0I8-01 | Breast | breast invasive carcinoma | Female | <65 | I/II | Unknown | Unknown | PD |
| Page: 1 2 3 4 5 6 7 8 9 10 11 12 13 14 15 16 17 18 19 20 21 |
Top |
Related drugs of malignant transformation related genes |
| Identification of chemicals and drugs interact with genes involved in malignant transfromation |
| (DGIdb 4.0) |
| Entrez ID | Symbol | Category | Interaction Types | Drug Claim Name | Drug Name | PMIDs |
| Page: 1 |

Copyright 2023-Present -The University of Texas Health Science Center at Houston |