
|
|||||
|
 | |
| |
| |
| |
| |
| |
|
Gene: NAT9 |
Gene summary for NAT9 |
| Gene information | Species | Human | Gene symbol | NAT9 | Gene ID | 26151 |
| Gene name | N-acetyltransferase 9 (putative) | |
| Gene Alias | EBSP, hNATL | |
| Cytomap | 17q25.1 | |
| Gene Type | protein-coding | GO ID | GO:0006464 | UniProtAcc | Q9BTE0 |
Top |
Malignant transformation analysis |
| Identification of the aberrant gene expression in precancerous and cancerous lesions by comparing the gene expression of stem-like cells in diseased tissues with normal stem cells |
| Entrez ID | Symbol | Replicates | Species | Organ | Tissue | Adj P-value | Log2FC | Malignancy |
| 26151 | NAT9 | LZE7T | Human | Esophagus | ESCC | 3.05e-07 | 4.07e-01 | 0.0667 |
| 26151 | NAT9 | LZE8T | Human | Esophagus | ESCC | 3.76e-05 | 2.47e-01 | 0.067 |
| 26151 | NAT9 | LZE24T | Human | Esophagus | ESCC | 1.66e-17 | 4.56e-01 | 0.0596 |
| 26151 | NAT9 | P1T-E | Human | Esophagus | ESCC | 6.68e-05 | 2.38e-01 | 0.0875 |
| 26151 | NAT9 | P2T-E | Human | Esophagus | ESCC | 7.27e-22 | 2.85e-01 | 0.1177 |
| 26151 | NAT9 | P4T-E | Human | Esophagus | ESCC | 2.43e-12 | 2.46e-01 | 0.1323 |
| 26151 | NAT9 | P5T-E | Human | Esophagus | ESCC | 1.06e-08 | 2.01e-01 | 0.1327 |
| 26151 | NAT9 | P8T-E | Human | Esophagus | ESCC | 1.41e-09 | 2.56e-01 | 0.0889 |
| 26151 | NAT9 | P9T-E | Human | Esophagus | ESCC | 1.39e-05 | 2.01e-01 | 0.1131 |
| 26151 | NAT9 | P10T-E | Human | Esophagus | ESCC | 7.97e-43 | 8.91e-01 | 0.116 |
| 26151 | NAT9 | P11T-E | Human | Esophagus | ESCC | 3.81e-14 | 5.46e-01 | 0.1426 |
| 26151 | NAT9 | P12T-E | Human | Esophagus | ESCC | 2.64e-20 | 3.98e-01 | 0.1122 |
| 26151 | NAT9 | P15T-E | Human | Esophagus | ESCC | 8.96e-18 | 4.00e-01 | 0.1149 |
| 26151 | NAT9 | P16T-E | Human | Esophagus | ESCC | 1.66e-17 | 4.11e-01 | 0.1153 |
| 26151 | NAT9 | P17T-E | Human | Esophagus | ESCC | 2.75e-04 | 2.75e-01 | 0.1278 |
| 26151 | NAT9 | P19T-E | Human | Esophagus | ESCC | 3.73e-03 | 2.43e-01 | 0.1662 |
| 26151 | NAT9 | P20T-E | Human | Esophagus | ESCC | 2.03e-47 | 1.06e+00 | 0.1124 |
| 26151 | NAT9 | P21T-E | Human | Esophagus | ESCC | 1.57e-17 | 3.59e-01 | 0.1617 |
| 26151 | NAT9 | P22T-E | Human | Esophagus | ESCC | 5.28e-23 | 4.32e-01 | 0.1236 |
| 26151 | NAT9 | P23T-E | Human | Esophagus | ESCC | 1.80e-16 | 4.10e-01 | 0.108 |
| Page: 1 2 3 4 5 6 |
| Tissue | Expression Dynamics | Abbreviation |
| Esophagus |  | ESCC: Esophageal squamous cell carcinoma |
| HGIN: High-grade intraepithelial neoplasias | ||
| LGIN: Low-grade intraepithelial neoplasias | ||
| Liver |  | HCC: Hepatocellular carcinoma |
| NAFLD: Non-alcoholic fatty liver disease | ||
| Oral Cavity |  | EOLP: Erosive Oral lichen planus |
| LP: leukoplakia | ||
| NEOLP: Non-erosive oral lichen planus | ||
| OSCC: Oral squamous cell carcinoma | ||
| Thyroid | 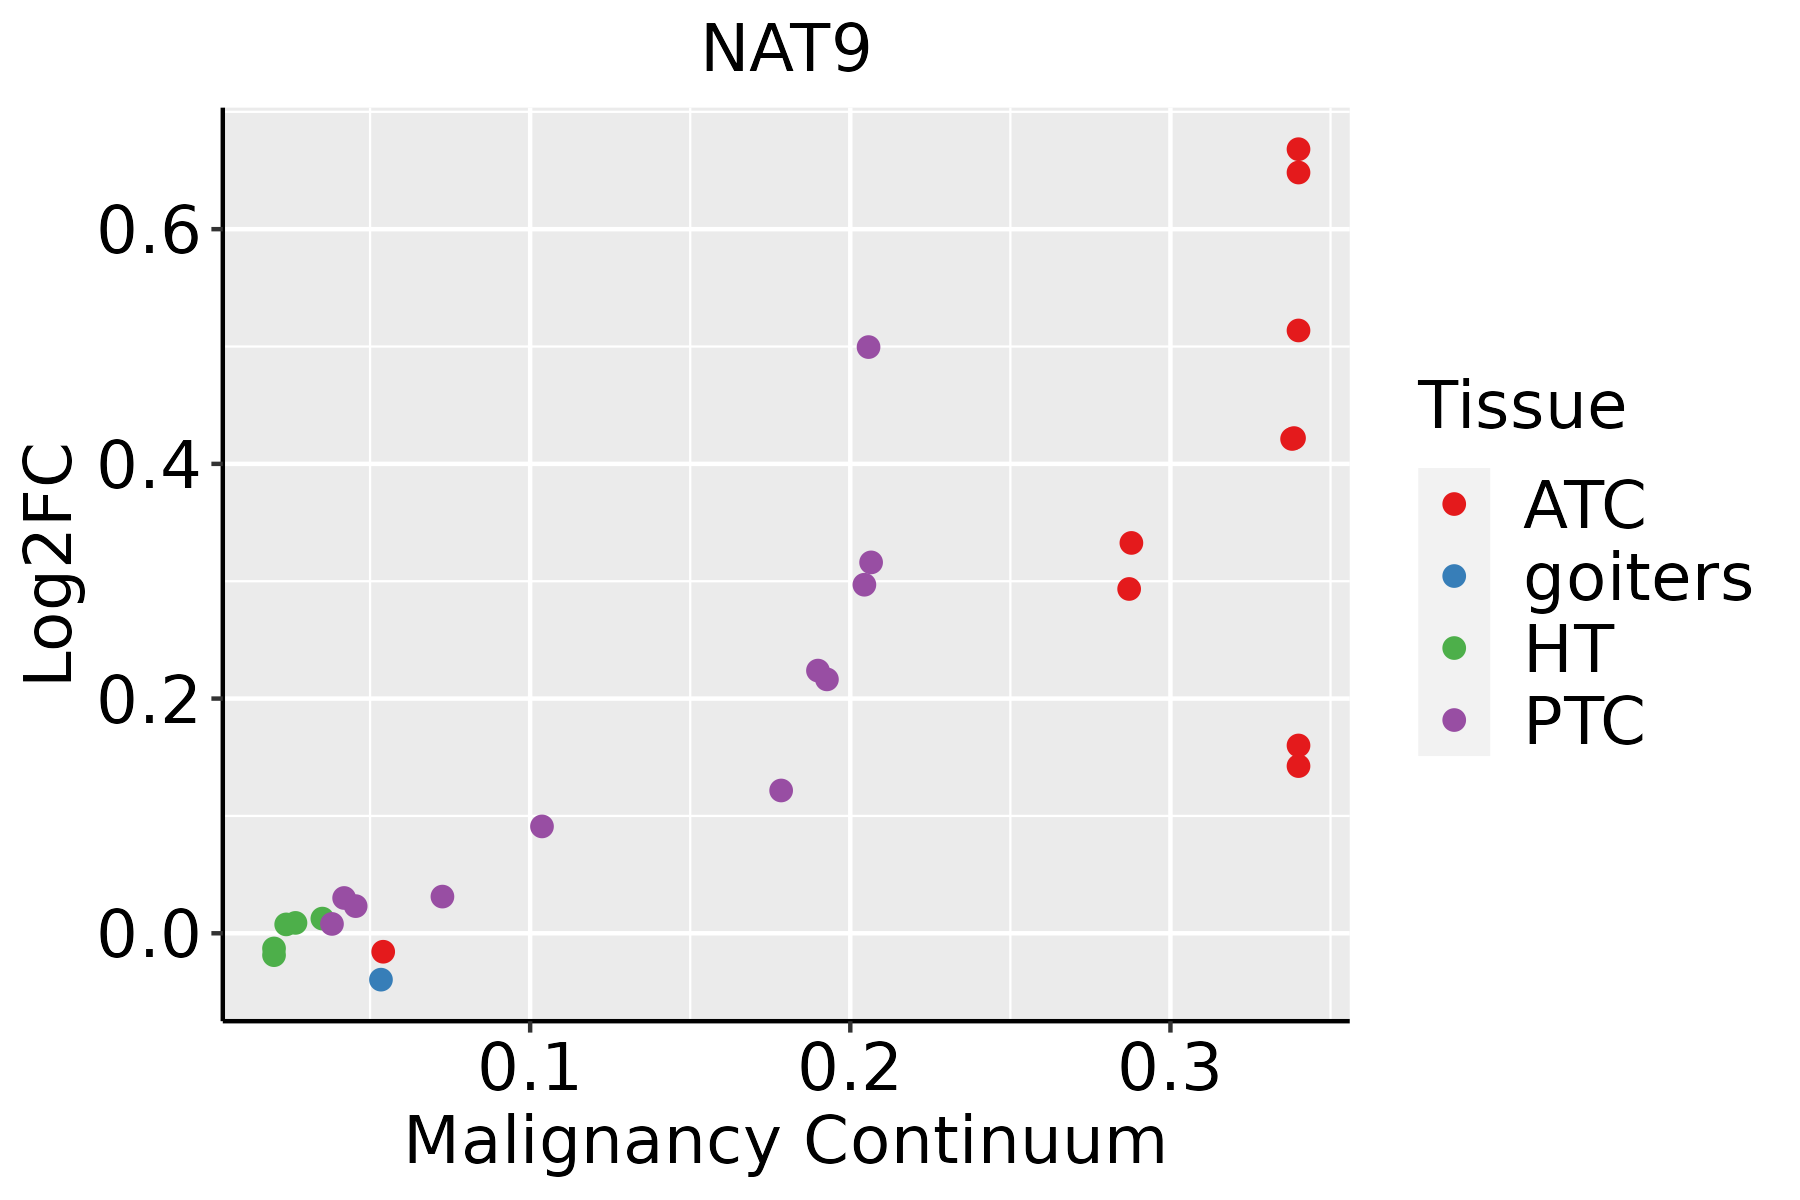 | ATC: Anaplastic thyroid cancer |
| HT: Hashimoto's thyroiditis | ||
| PTC: Papillary thyroid cancer |
| ∗log2FC in expression of this searched gene in stem-like cells from each diseased tissue sample relative to stem-like cells in normal samples in each tissue plotted against the malignancy continuum. Samples are colored based on if they are from different disease stage. |
Top |
Malignant transformation related pathway analysis |
| Find out the enriched GO biological processes and KEGG pathways involved in transition from healthy to precancer to cancer |
| Tissue | Disease Stage | Enriched GO biological Processes |
| Colorectum | AD |  |
| Colorectum | SER |  |
| Colorectum | MSS |  |
| Colorectum | MSI-H |  |
| Colorectum | FAP |  |
| ∗Top 15 enriched GO BP terms are showed in the bar plot of each disease state in each tissue. Each row represents a significant GO biological process which is colored according to the -log10(p.adjust). |
| Page: 1 2 3 4 5 6 7 8 9 |
| GO ID | Tissue | Disease Stage | Description | Gene Ratio | Bg Ratio | pvalue | p.adjust | Count |
| GO:004354313 | Esophagus | ESCC | protein acylation | 165/8552 | 243/18723 | 1.69e-12 | 7.14e-11 | 165 |
| GO:000647313 | Esophagus | ESCC | protein acetylation | 140/8552 | 201/18723 | 4.37e-12 | 1.69e-10 | 140 |
| GO:00064731 | Liver | Cirrhotic | protein acetylation | 84/4634 | 201/18723 | 7.50e-08 | 2.25e-06 | 84 |
| GO:00435431 | Liver | Cirrhotic | protein acylation | 95/4634 | 243/18723 | 4.73e-07 | 1.07e-05 | 95 |
| GO:00064732 | Liver | HCC | protein acetylation | 135/7958 | 201/18723 | 1.20e-12 | 5.92e-11 | 135 |
| GO:00435432 | Liver | HCC | protein acylation | 157/7958 | 243/18723 | 2.40e-12 | 1.12e-10 | 157 |
| GO:00435434 | Oral cavity | OSCC | protein acylation | 149/7305 | 243/18723 | 1.33e-12 | 5.80e-11 | 149 |
| GO:00064734 | Oral cavity | OSCC | protein acetylation | 124/7305 | 201/18723 | 5.59e-11 | 1.74e-09 | 124 |
| GO:004354312 | Oral cavity | LP | protein acylation | 93/4623 | 243/18723 | 1.65e-06 | 3.86e-05 | 93 |
| GO:000647312 | Oral cavity | LP | protein acetylation | 78/4623 | 201/18723 | 6.06e-06 | 1.20e-04 | 78 |
| GO:00064737 | Thyroid | PTC | protein acetylation | 116/5968 | 201/18723 | 3.05e-14 | 1.92e-12 | 116 |
| GO:00435437 | Thyroid | PTC | protein acylation | 134/5968 | 243/18723 | 4.22e-14 | 2.58e-12 | 134 |
| GO:000647315 | Thyroid | ATC | protein acetylation | 116/6293 | 201/18723 | 1.75e-12 | 7.33e-11 | 116 |
| GO:004354315 | Thyroid | ATC | protein acylation | 134/6293 | 243/18723 | 3.46e-12 | 1.40e-10 | 134 |
| Page: 1 |
| Pathway ID | Tissue | Disease Stage | Description | Gene Ratio | Bg Ratio | pvalue | p.adjust | qvalue | Count |
| Page: 1 |
Top |
Cell-cell communication analysis |
| Identification of potential cell-cell interactions between two cell types and their ligand-receptor pairs for different disease states |
| Ligand | Receptor | LRpair | Pathway | Tissue | Disease Stage |
| Page: 1 |
Top |
Single-cell gene regulatory network inference analysis |
| Find out the significant the regulons (TFs) and the target genes of each regulon across cell types for different disease states |
| TF | Cell Type | Tissue | Disease Stage | Target Gene | RSS | Regulon Activity |
| ∗The dot plots of a searched regulon are shown for all cell subpopulations in each disease state of each tissue based on the regulon specific score inferred using pySCENIC and by calculating the average expression. |
| Page: 1 |
Top |
Somatic mutation of malignant transformation related genes |
| Annotation of somatic variants for genes involved in malignant transformation |
| Hugo Symbol | Variant Class | Variant Classification | dbSNP RS | HGVSc | HGVSp | HGVSp Short | SWISSPROT | BIOTYPE | SIFT | PolyPhen | Tumor Sample Barcode | Tissue | Histology | Sex | Age | Stage | Therapy Types | Drugs | Outcome |
| NAT9 | SNV | Missense_Mutation | c.24N>C | p.Leu8Phe | p.L8F | protein_coding | deleterious(0.01) | possibly_damaging(0.751) | TCGA-AC-A23H-01 | Breast | breast invasive carcinoma | Female | >=65 | I/II | Unknown | Unknown | PD | ||
| NAT9 | SNV | Missense_Mutation | c.467N>T | p.Pro156Leu | p.P156L | protein_coding | tolerated(0.15) | probably_damaging(0.947) | TCGA-AN-A0FL-01 | Breast | breast invasive carcinoma | Female | <65 | I/II | Unknown | Unknown | SD | ||
| NAT9 | SNV | Missense_Mutation | c.614N>A | p.Arg205Lys | p.R205K | protein_coding | tolerated(0.09) | benign(0.272) | TCGA-AN-A0XW-01 | Breast | breast invasive carcinoma | Female | <65 | III/IV | Unknown | Unknown | SD | ||
| NAT9 | SNV | Missense_Mutation | c.545T>C | p.Leu182Pro | p.L182P | protein_coding | deleterious(0.04) | probably_damaging(0.99) | TCGA-D8-A1XK-01 | Breast | breast invasive carcinoma | Female | <65 | I/II | Chemotherapy | doxorubicine+cyclophosphamide | SD | ||
| NAT9 | SNV | Missense_Mutation | c.483C>A | p.Phe161Leu | p.F161L | protein_coding | deleterious(0) | probably_damaging(0.998) | TCGA-IR-A3LH-01 | Cervix | cervical & endocervical cancer | Female | <65 | I/II | Chemotherapy | cisplatin | CR | ||
| NAT9 | SNV | Missense_Mutation | c.394N>A | p.Ala132Thr | p.A132T | protein_coding | deleterious(0.03) | benign(0.062) | TCGA-AA-3492-01 | Colorectum | colon adenocarcinoma | Female | >=65 | I/II | Unknown | Unknown | SD | ||
| NAT9 | SNV | Missense_Mutation | novel | c.202N>T | p.Asp68Tyr | p.D68Y | protein_coding | deleterious(0) | probably_damaging(0.985) | TCGA-EI-6917-01 | Colorectum | rectum adenocarcinoma | Male | <65 | III/IV | Chemotherapy | 5fluorouracil+oxaciplatina+l-folinian | SD | |
| NAT9 | SNV | Missense_Mutation | novel | c.304N>T | p.Asp102Tyr | p.D102Y | protein_coding | deleterious(0) | probably_damaging(0.959) | TCGA-A5-A1OF-01 | Endometrium | uterine corpus endometrioid carcinoma | Female | <65 | I/II | Unknown | Unknown | SD | |
| NAT9 | SNV | Missense_Mutation | novel | c.313N>T | p.Asp105Tyr | p.D105Y | protein_coding | deleterious(0) | probably_damaging(0.991) | TCGA-E6-A1M0-01 | Endometrium | uterine corpus endometrioid carcinoma | Female | <65 | III/IV | Chemotherapy | carboplatin | SD | |
| NAT9 | SNV | Missense_Mutation | rs148689395 | c.512N>T | p.Thr171Met | p.T171M | protein_coding | tolerated(0.13) | benign(0.006) | TCGA-EY-A1H0-01 | Endometrium | uterine corpus endometrioid carcinoma | Female | <65 | III/IV | Chemotherapy | taxol | SD |
| Page: 1 2 |
Top |
Related drugs of malignant transformation related genes |
| Identification of chemicals and drugs interact with genes involved in malignant transfromation |
| (DGIdb 4.0) |
| Entrez ID | Symbol | Category | Interaction Types | Drug Claim Name | Drug Name | PMIDs |
| Page: 1 |

Copyright 2023-Present -The University of Texas Health Science Center at Houston |