
|
|||||
|
 | |
| |
| |
| |
| |
| |
|
Gene: NAT14 |
Gene summary for NAT14 |
| Gene information | Species | Human | Gene symbol | NAT14 | Gene ID | 57106 |
| Gene name | N-acetyltransferase 14 (putative) | |
| Gene Alias | KLP1 | |
| Cytomap | 19q13.42 | |
| Gene Type | protein-coding | GO ID | GO:0006139 | UniProtAcc | Q8WUY8 |
Top |
Malignant transformation analysis |
| Identification of the aberrant gene expression in precancerous and cancerous lesions by comparing the gene expression of stem-like cells in diseased tissues with normal stem cells |
| Entrez ID | Symbol | Replicates | Species | Organ | Tissue | Adj P-value | Log2FC | Malignancy |
| 57106 | NAT14 | C04 | Human | Oral cavity | OSCC | 3.41e-07 | 3.59e-01 | 0.2633 |
| 57106 | NAT14 | C21 | Human | Oral cavity | OSCC | 8.74e-06 | 2.58e-01 | 0.2678 |
| 57106 | NAT14 | C30 | Human | Oral cavity | OSCC | 2.45e-32 | 1.18e+00 | 0.3055 |
| 57106 | NAT14 | C43 | Human | Oral cavity | OSCC | 2.56e-32 | 5.49e-01 | 0.1704 |
| 57106 | NAT14 | C46 | Human | Oral cavity | OSCC | 4.49e-03 | 1.02e-01 | 0.1673 |
| 57106 | NAT14 | C51 | Human | Oral cavity | OSCC | 6.62e-04 | 2.66e-01 | 0.2674 |
| 57106 | NAT14 | C08 | Human | Oral cavity | OSCC | 1.85e-17 | 3.50e-01 | 0.1919 |
| 57106 | NAT14 | SYSMH3 | Human | Oral cavity | OSCC | 1.17e-14 | 2.88e-01 | 0.2442 |
| 57106 | NAT14 | SYSMH6 | Human | Oral cavity | OSCC | 2.09e-02 | 1.01e-01 | 0.1275 |
| 57106 | NAT14 | male-WTA | Human | Thyroid | PTC | 8.48e-15 | 1.49e-01 | 0.1037 |
| 57106 | NAT14 | PTC01 | Human | Thyroid | PTC | 2.29e-07 | 1.76e-01 | 0.1899 |
| 57106 | NAT14 | PTC03 | Human | Thyroid | PTC | 3.58e-03 | 1.94e-01 | 0.1784 |
| 57106 | NAT14 | PTC04 | Human | Thyroid | PTC | 8.06e-07 | 1.42e-01 | 0.1927 |
| 57106 | NAT14 | PTC05 | Human | Thyroid | PTC | 2.50e-11 | 4.15e-01 | 0.2065 |
| 57106 | NAT14 | PTC06 | Human | Thyroid | PTC | 1.88e-24 | 5.89e-01 | 0.2057 |
| 57106 | NAT14 | PTC07 | Human | Thyroid | PTC | 5.20e-27 | 4.32e-01 | 0.2044 |
| 57106 | NAT14 | ATC09 | Human | Thyroid | ATC | 2.94e-10 | 4.91e-01 | 0.2871 |
| 57106 | NAT14 | ATC11 | Human | Thyroid | ATC | 4.77e-02 | 3.32e-01 | 0.3386 |
| 57106 | NAT14 | ATC12 | Human | Thyroid | ATC | 9.43e-14 | 2.64e-01 | 0.34 |
| 57106 | NAT14 | ATC13 | Human | Thyroid | ATC | 4.27e-31 | 7.60e-01 | 0.34 |
| Page: 1 2 |
| Tissue | Expression Dynamics | Abbreviation |
| Oral Cavity | 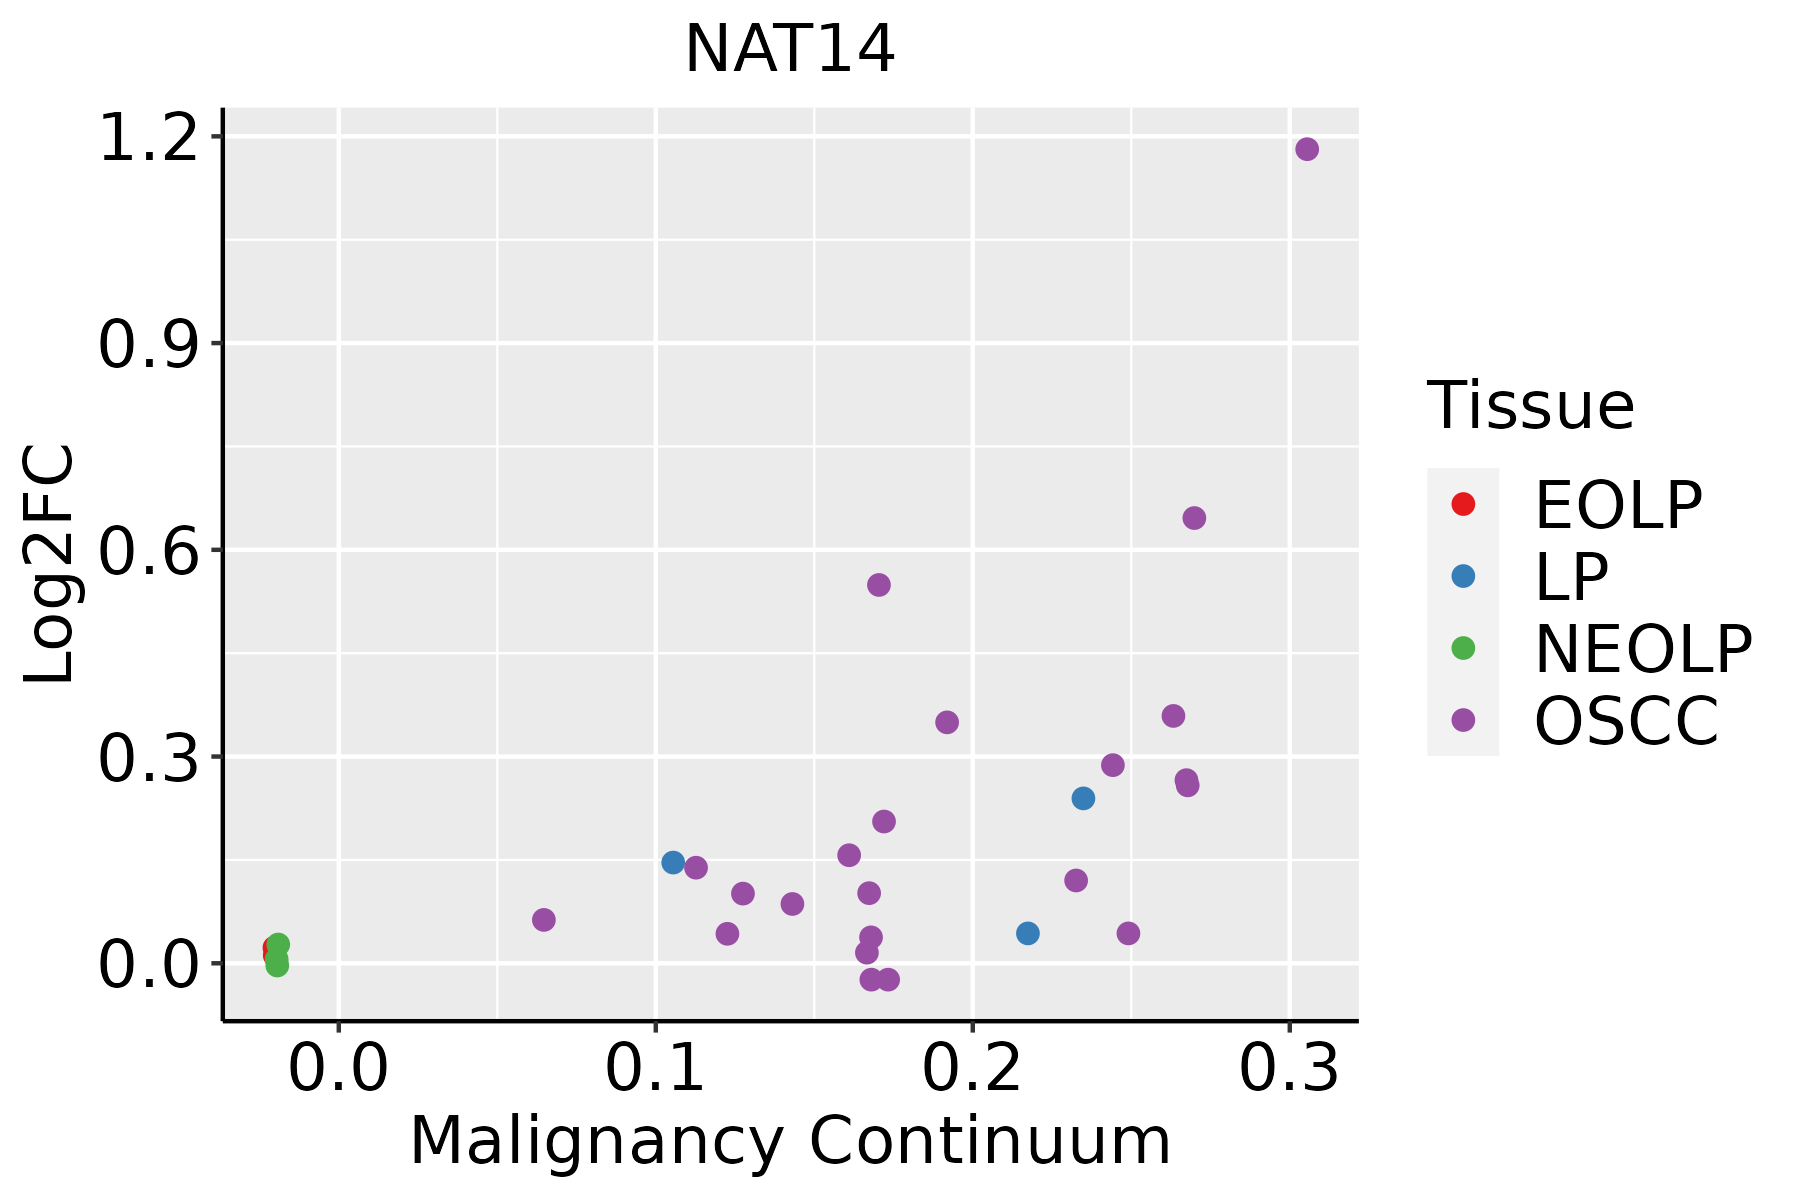 | EOLP: Erosive Oral lichen planus |
| LP: leukoplakia | ||
| NEOLP: Non-erosive oral lichen planus | ||
| OSCC: Oral squamous cell carcinoma | ||
| Thyroid | 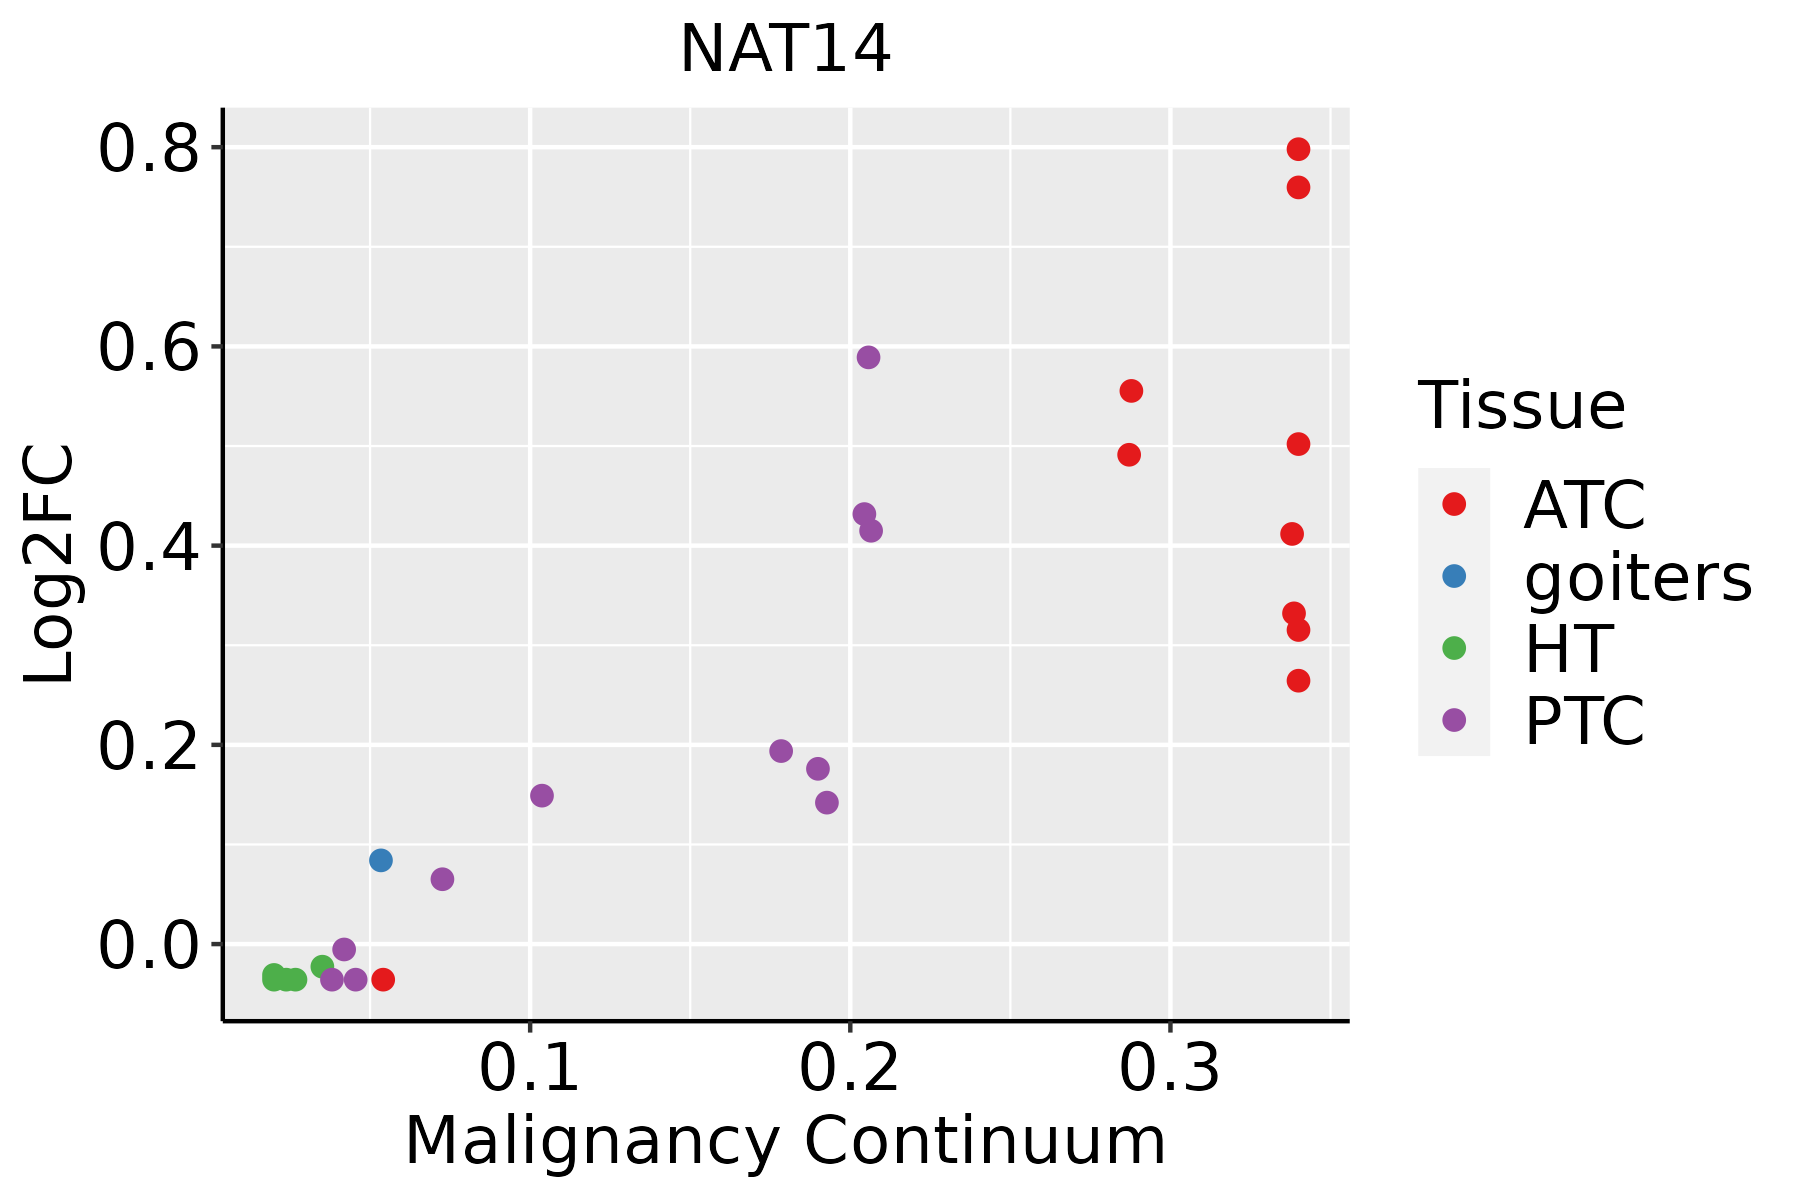 | ATC: Anaplastic thyroid cancer |
| HT: Hashimoto's thyroiditis | ||
| PTC: Papillary thyroid cancer |
| ∗log2FC in expression of this searched gene in stem-like cells from each diseased tissue sample relative to stem-like cells in normal samples in each tissue plotted against the malignancy continuum. Samples are colored based on if they are from different disease stage. |
Top |
Malignant transformation related pathway analysis |
| Find out the enriched GO biological processes and KEGG pathways involved in transition from healthy to precancer to cancer |
| Tissue | Disease Stage | Enriched GO biological Processes |
| Colorectum | AD |  |
| Colorectum | SER |  |
| Colorectum | MSS |  |
| Colorectum | MSI-H |  |
| Colorectum | FAP |  |
| ∗Top 15 enriched GO BP terms are showed in the bar plot of each disease state in each tissue. Each row represents a significant GO biological process which is colored according to the -log10(p.adjust). |
| Page: 1 2 3 4 5 6 7 8 9 |
| GO ID | Tissue | Disease Stage | Description | Gene Ratio | Bg Ratio | pvalue | p.adjust | Count |
| GO:00063522 | Oral cavity | OSCC | DNA-templated transcription, initiation | 74/7305 | 130/18723 | 2.56e-05 | 2.39e-04 | 74 |
| GO:00063525 | Thyroid | PTC | DNA-templated transcription, initiation | 63/5968 | 130/18723 | 5.72e-05 | 5.05e-04 | 63 |
| GO:000635213 | Thyroid | ATC | DNA-templated transcription, initiation | 64/6293 | 130/18723 | 1.60e-04 | 1.10e-03 | 64 |
| Page: 1 |
| Pathway ID | Tissue | Disease Stage | Description | Gene Ratio | Bg Ratio | pvalue | p.adjust | qvalue | Count |
| Page: 1 |
Top |
Cell-cell communication analysis |
| Identification of potential cell-cell interactions between two cell types and their ligand-receptor pairs for different disease states |
| Ligand | Receptor | LRpair | Pathway | Tissue | Disease Stage |
| Page: 1 |
Top |
Single-cell gene regulatory network inference analysis |
| Find out the significant the regulons (TFs) and the target genes of each regulon across cell types for different disease states |
| TF | Cell Type | Tissue | Disease Stage | Target Gene | RSS | Regulon Activity |
| ∗The dot plots of a searched regulon are shown for all cell subpopulations in each disease state of each tissue based on the regulon specific score inferred using pySCENIC and by calculating the average expression. |
| Page: 1 |
Top |
Somatic mutation of malignant transformation related genes |
| Annotation of somatic variants for genes involved in malignant transformation |
| Hugo Symbol | Variant Class | Variant Classification | dbSNP RS | HGVSc | HGVSp | HGVSp Short | SWISSPROT | BIOTYPE | SIFT | PolyPhen | Tumor Sample Barcode | Tissue | Histology | Sex | Age | Stage | Therapy Types | Drugs | Outcome |
| NAT14 | SNV | Missense_Mutation | novel | c.193N>C | p.Ala65Pro | p.A65P | Q8WUY8 | protein_coding | deleterious(0.01) | probably_damaging(0.96) | TCGA-CM-5861-01 | Colorectum | colon adenocarcinoma | Female | <65 | I/II | Unknown | Unknown | PD |
| NAT14 | deletion | Frame_Shift_Del | c.49delN | p.Leu18TrpfsTer6 | p.L18Wfs*6 | Q8WUY8 | protein_coding | TCGA-A6-6780-01 | Colorectum | colon adenocarcinoma | Male | >=65 | I/II | Unknown | Unknown | SD | |||
| NAT14 | SNV | Missense_Mutation | c.167G>A | p.Arg56His | p.R56H | Q8WUY8 | protein_coding | tolerated(0.05) | probably_damaging(0.971) | TCGA-BS-A0UV-01 | Endometrium | uterine corpus endometrioid carcinoma | Female | <65 | III/IV | Unknown | Unknown | SD | |
| NAT14 | SNV | Missense_Mutation | novel | c.4N>C | p.Ala2Pro | p.A2P | Q8WUY8 | protein_coding | tolerated_low_confidence(0.16) | benign(0.003) | TCGA-E6-A2P9-01 | Endometrium | uterine corpus endometrioid carcinoma | Female | >=65 | I/II | Unknown | Unknown | SD |
| NAT14 | SNV | Missense_Mutation | novel | c.358N>T | p.Gly120Trp | p.G120W | Q8WUY8 | protein_coding | deleterious(0.02) | possibly_damaging(0.836) | TCGA-55-8507-01 | Lung | lung adenocarcinoma | Male | <65 | I/II | Unknown | Unknown | SD |
| Page: 1 |
Top |
Related drugs of malignant transformation related genes |
| Identification of chemicals and drugs interact with genes involved in malignant transfromation |
| (DGIdb 4.0) |
| Entrez ID | Symbol | Category | Interaction Types | Drug Claim Name | Drug Name | PMIDs |
| Page: 1 |

Copyright 2023-Present -The University of Texas Health Science Center at Houston |