
|
|||||
|
 | |
| |
| |
| |
| |
| |
|
Gene: NAT10 |
Gene summary for NAT10 |
| Gene information | Species | Human | Gene symbol | NAT10 | Gene ID | 55226 |
| Gene name | N-acetyltransferase 10 | |
| Gene Alias | ALP | |
| Cytomap | 11p13 | |
| Gene Type | protein-coding | GO ID | GO:0000154 | UniProtAcc | Q9H0A0 |
Top |
Malignant transformation analysis |
| Identification of the aberrant gene expression in precancerous and cancerous lesions by comparing the gene expression of stem-like cells in diseased tissues with normal stem cells |
| Entrez ID | Symbol | Replicates | Species | Organ | Tissue | Adj P-value | Log2FC | Malignancy |
| 55226 | NAT10 | LZE4T | Human | Esophagus | ESCC | 1.09e-03 | 1.69e-01 | 0.0811 |
| 55226 | NAT10 | LZE7T | Human | Esophagus | ESCC | 2.76e-05 | 3.40e-01 | 0.0667 |
| 55226 | NAT10 | LZE24T | Human | Esophagus | ESCC | 1.16e-07 | 2.02e-01 | 0.0596 |
| 55226 | NAT10 | P2T-E | Human | Esophagus | ESCC | 4.07e-14 | 2.88e-01 | 0.1177 |
| 55226 | NAT10 | P4T-E | Human | Esophagus | ESCC | 7.12e-06 | 1.59e-01 | 0.1323 |
| 55226 | NAT10 | P5T-E | Human | Esophagus | ESCC | 1.10e-10 | 1.09e-01 | 0.1327 |
| 55226 | NAT10 | P8T-E | Human | Esophagus | ESCC | 2.19e-11 | 2.22e-01 | 0.0889 |
| 55226 | NAT10 | P9T-E | Human | Esophagus | ESCC | 1.87e-02 | 1.58e-01 | 0.1131 |
| 55226 | NAT10 | P10T-E | Human | Esophagus | ESCC | 1.21e-19 | 2.43e-01 | 0.116 |
| 55226 | NAT10 | P11T-E | Human | Esophagus | ESCC | 4.03e-04 | 1.79e-01 | 0.1426 |
| 55226 | NAT10 | P12T-E | Human | Esophagus | ESCC | 3.81e-13 | 2.26e-01 | 0.1122 |
| 55226 | NAT10 | P15T-E | Human | Esophagus | ESCC | 1.31e-15 | 4.46e-01 | 0.1149 |
| 55226 | NAT10 | P16T-E | Human | Esophagus | ESCC | 1.39e-06 | 2.06e-01 | 0.1153 |
| 55226 | NAT10 | P17T-E | Human | Esophagus | ESCC | 3.69e-05 | 2.10e-01 | 0.1278 |
| 55226 | NAT10 | P20T-E | Human | Esophagus | ESCC | 4.84e-08 | 1.77e-01 | 0.1124 |
| 55226 | NAT10 | P21T-E | Human | Esophagus | ESCC | 2.94e-21 | 2.76e-01 | 0.1617 |
| 55226 | NAT10 | P22T-E | Human | Esophagus | ESCC | 5.38e-22 | 4.45e-01 | 0.1236 |
| 55226 | NAT10 | P23T-E | Human | Esophagus | ESCC | 1.93e-03 | 1.49e-01 | 0.108 |
| 55226 | NAT10 | P24T-E | Human | Esophagus | ESCC | 9.56e-07 | 1.39e-01 | 0.1287 |
| 55226 | NAT10 | P26T-E | Human | Esophagus | ESCC | 2.11e-12 | 2.25e-01 | 0.1276 |
| Page: 1 2 3 4 |
| Tissue | Expression Dynamics | Abbreviation |
| Esophagus | 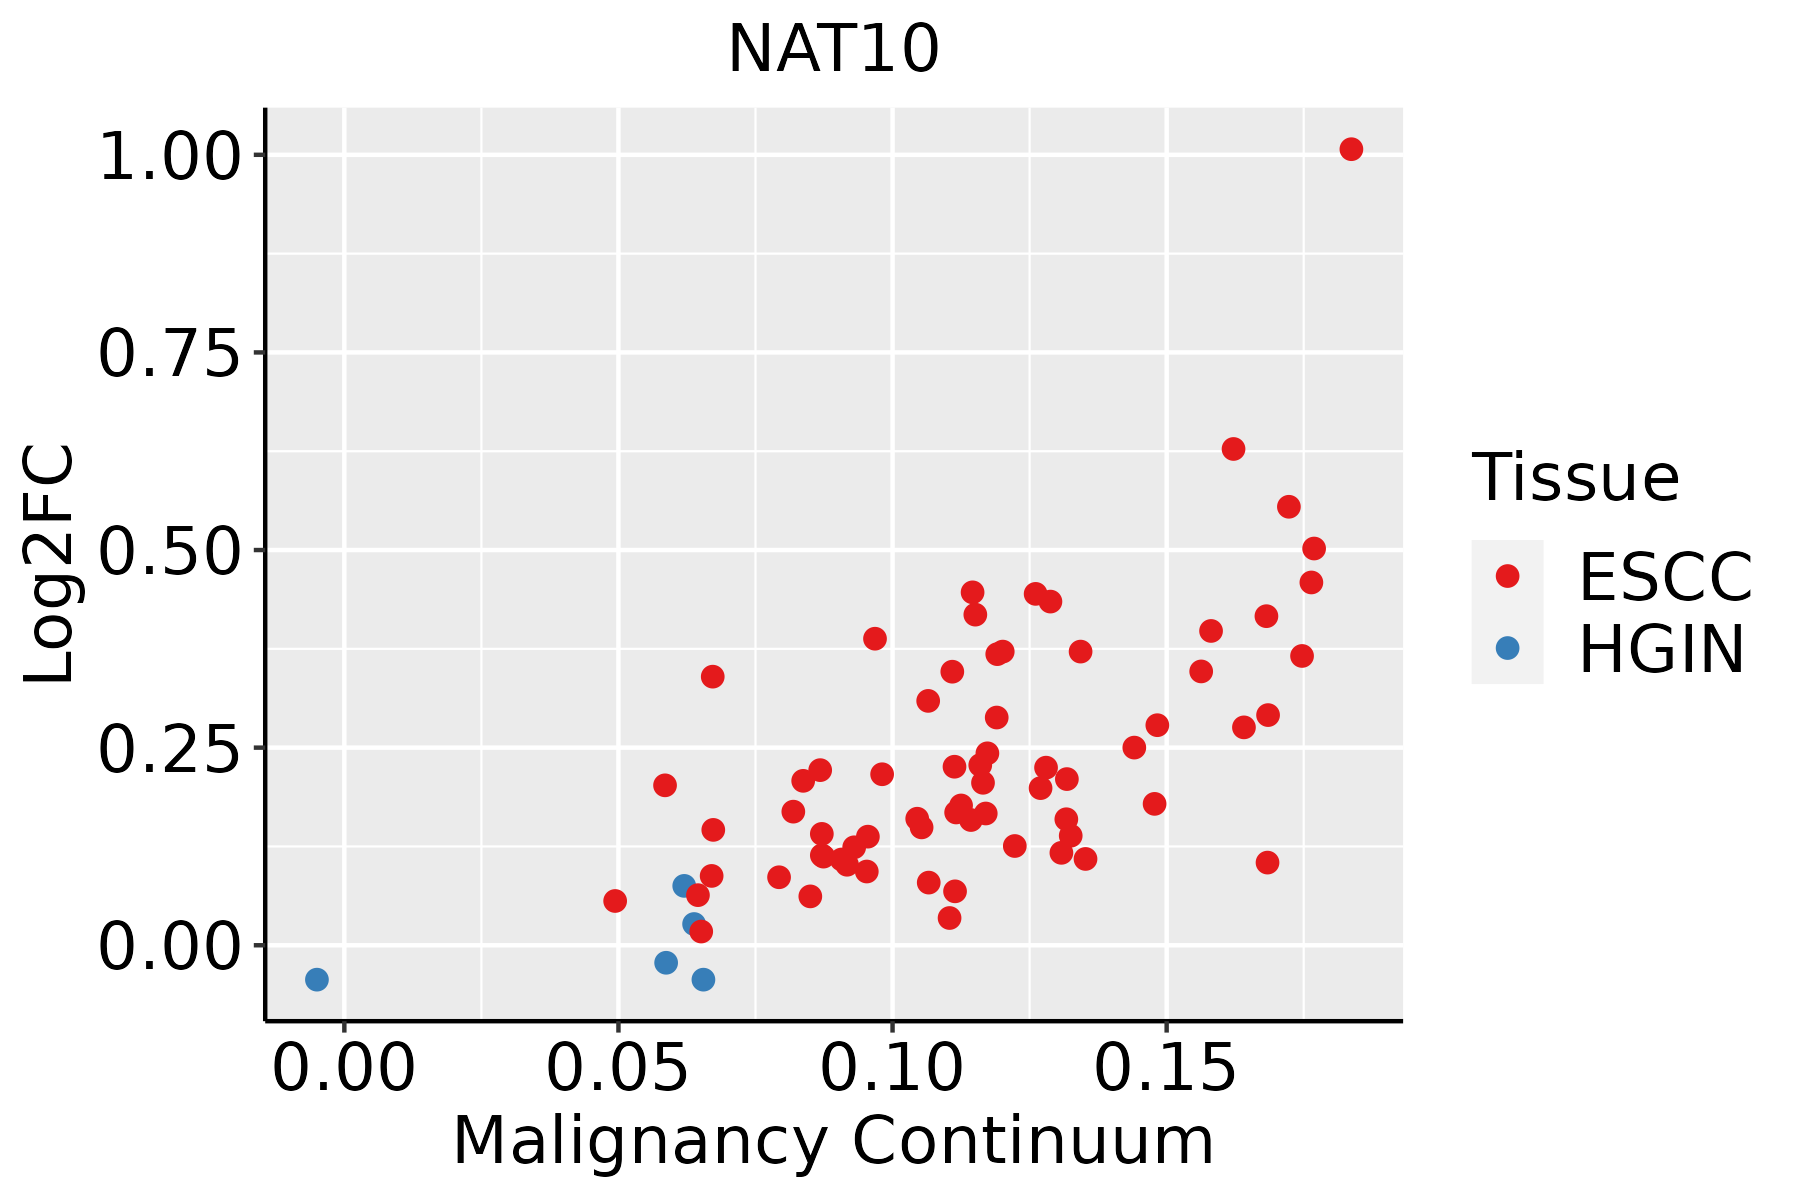 | ESCC: Esophageal squamous cell carcinoma |
| HGIN: High-grade intraepithelial neoplasias | ||
| LGIN: Low-grade intraepithelial neoplasias | ||
| Liver | 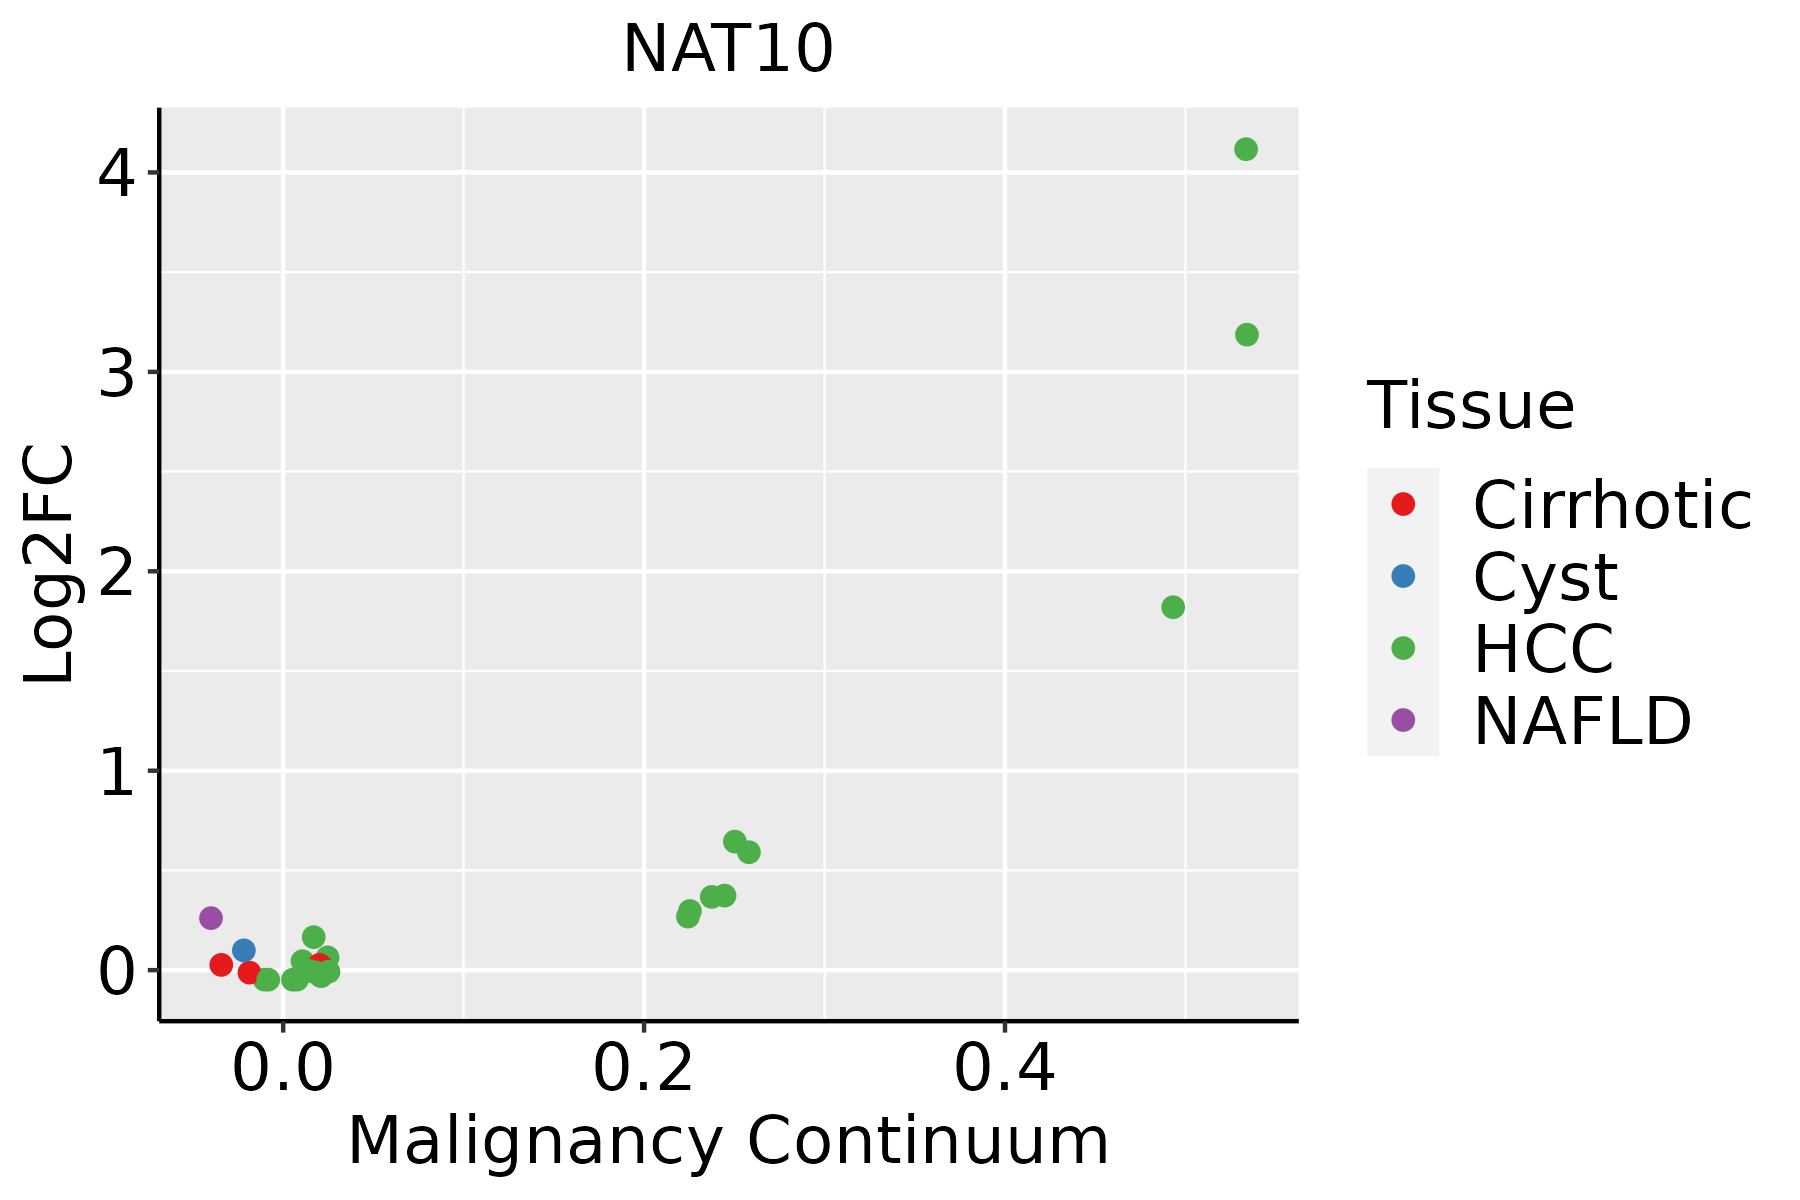 | HCC: Hepatocellular carcinoma |
| NAFLD: Non-alcoholic fatty liver disease | ||
| Oral Cavity | 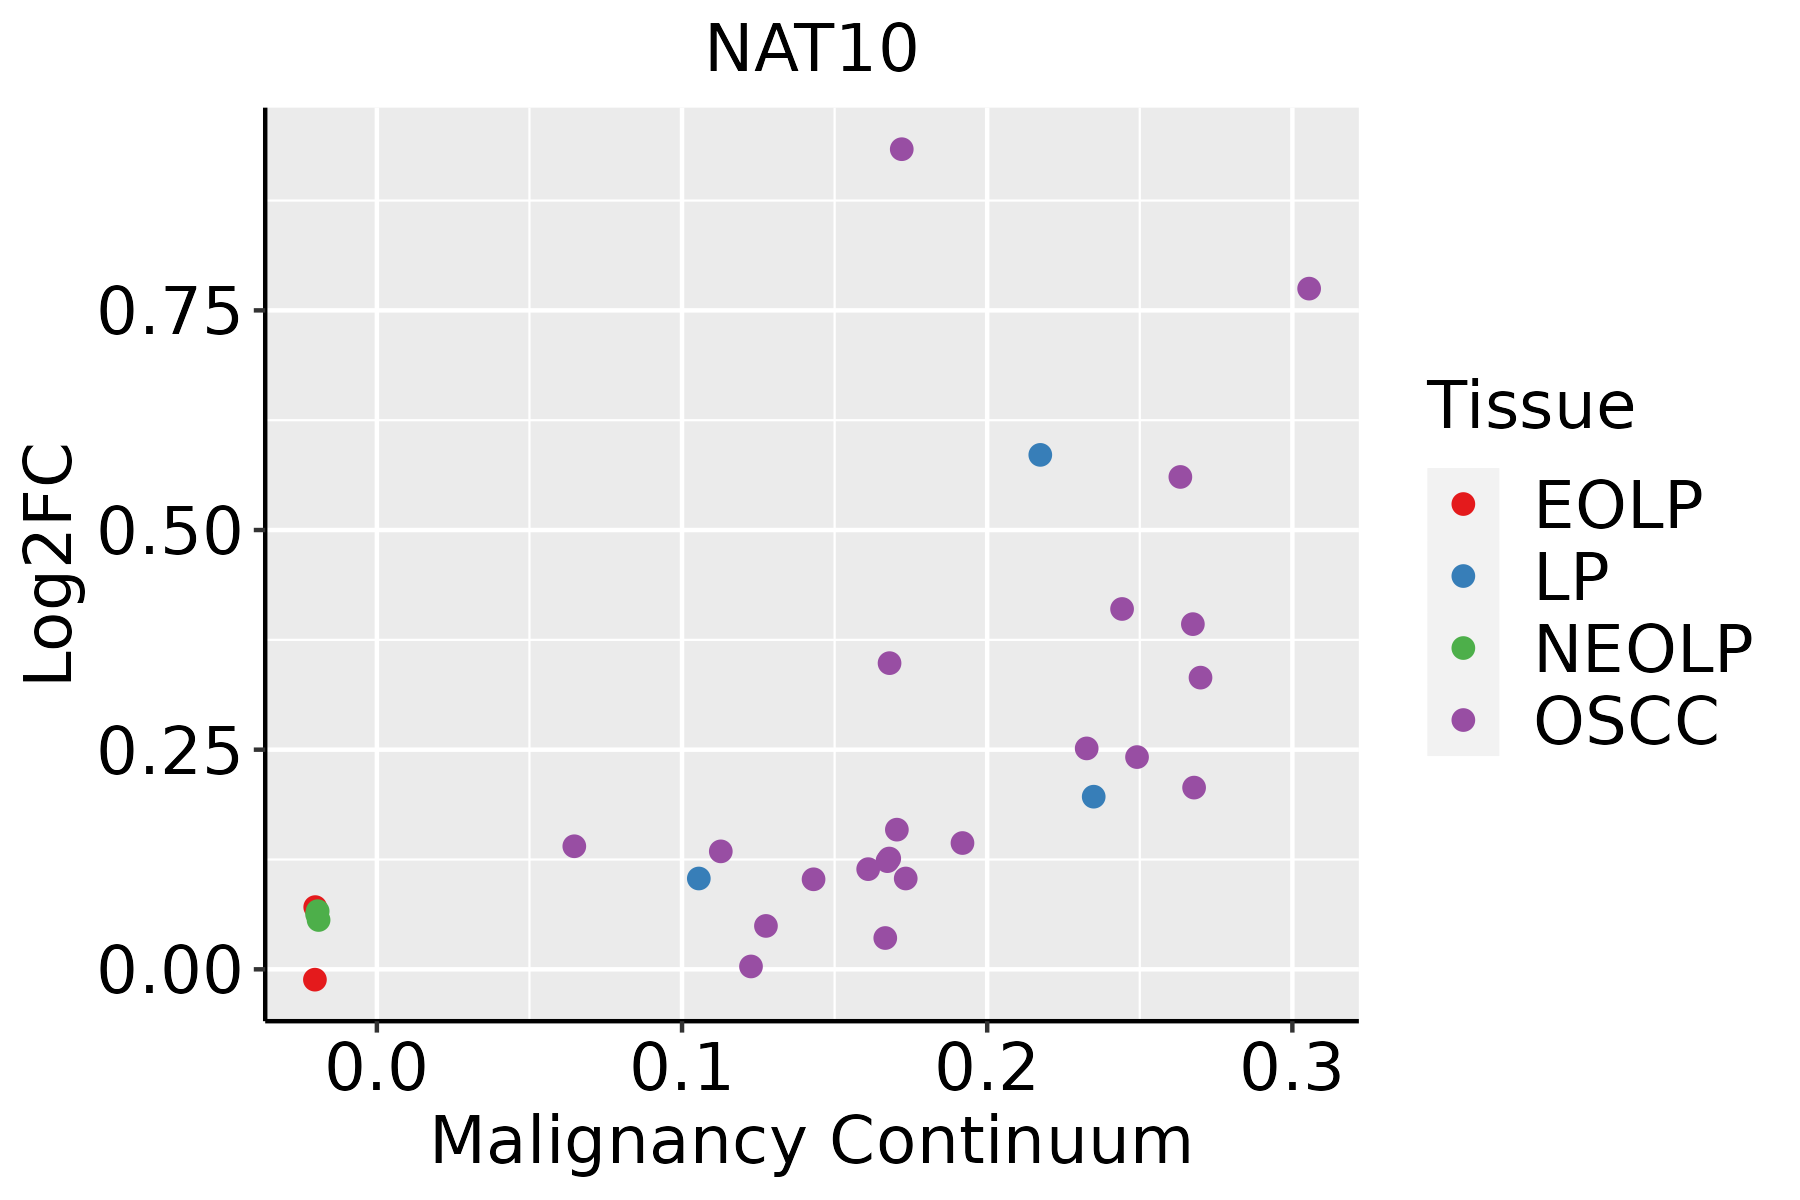 | EOLP: Erosive Oral lichen planus |
| LP: leukoplakia | ||
| NEOLP: Non-erosive oral lichen planus | ||
| OSCC: Oral squamous cell carcinoma | ||
| Skin | 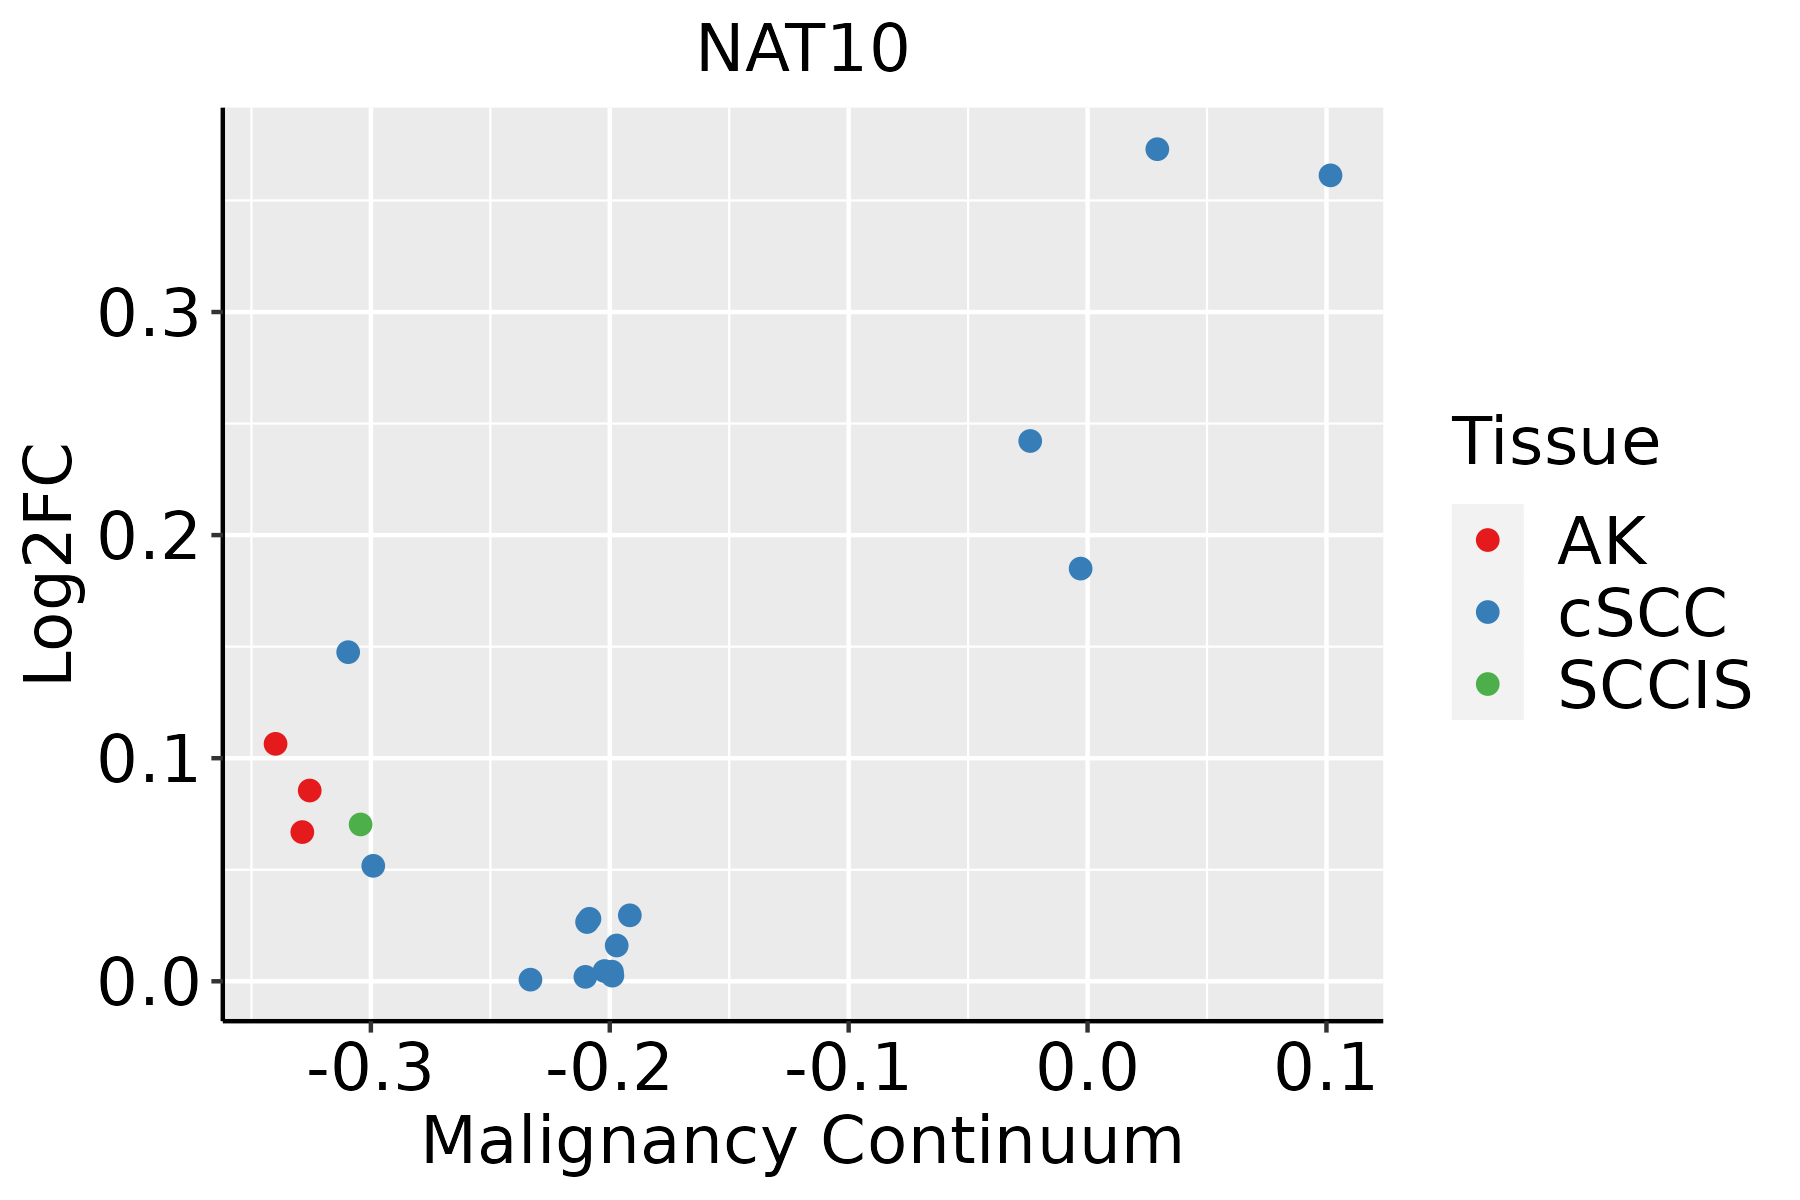 | AK: Actinic keratosis |
| cSCC: Cutaneous squamous cell carcinoma | ||
| SCCIS:squamous cell carcinoma in situ |
| ∗log2FC in expression of this searched gene in stem-like cells from each diseased tissue sample relative to stem-like cells in normal samples in each tissue plotted against the malignancy continuum. Samples are colored based on if they are from different disease stage. |
Top |
Malignant transformation related pathway analysis |
| Find out the enriched GO biological processes and KEGG pathways involved in transition from healthy to precancer to cancer |
| Tissue | Disease Stage | Enriched GO biological Processes |
| Colorectum | AD |  |
| Colorectum | SER |  |
| Colorectum | MSS |  |
| Colorectum | MSI-H |  |
| Colorectum | FAP |  |
| ∗Top 15 enriched GO BP terms are showed in the bar plot of each disease state in each tissue. Each row represents a significant GO biological process which is colored according to the -log10(p.adjust). |
| Page: 1 2 3 4 5 6 7 8 9 |
| GO ID | Tissue | Disease Stage | Description | Gene Ratio | Bg Ratio | pvalue | p.adjust | Count |
| GO:0022613111 | Esophagus | ESCC | ribonucleoprotein complex biogenesis | 365/8552 | 463/18723 | 1.74e-49 | 1.11e-45 | 365 |
| GO:0042254111 | Esophagus | ESCC | ribosome biogenesis | 252/8552 | 299/18723 | 3.27e-44 | 1.04e-40 | 252 |
| GO:003447015 | Esophagus | ESCC | ncRNA processing | 300/8552 | 395/18723 | 3.09e-35 | 3.26e-32 | 300 |
| GO:0016072110 | Esophagus | ESCC | rRNA metabolic process | 197/8552 | 236/18723 | 1.31e-33 | 1.18e-30 | 197 |
| GO:0006364110 | Esophagus | ESCC | rRNA processing | 189/8552 | 225/18723 | 4.88e-33 | 3.87e-30 | 189 |
| GO:003466012 | Esophagus | ESCC | ncRNA metabolic process | 346/8552 | 485/18723 | 4.35e-31 | 2.51e-28 | 346 |
| GO:003304416 | Esophagus | ESCC | regulation of chromosome organization | 145/8552 | 187/18723 | 3.80e-19 | 4.31e-17 | 145 |
| GO:0006417111 | Esophagus | ESCC | regulation of translation | 304/8552 | 468/18723 | 1.53e-17 | 1.33e-15 | 304 |
| GO:0042274111 | Esophagus | ESCC | ribosomal small subunit biogenesis | 67/8552 | 73/18723 | 6.62e-17 | 5.38e-15 | 67 |
| GO:0045727111 | Esophagus | ESCC | positive regulation of translation | 107/8552 | 136/18723 | 2.79e-15 | 1.68e-13 | 107 |
| GO:0034250111 | Esophagus | ESCC | positive regulation of cellular amide metabolic process | 123/8552 | 162/18723 | 3.32e-15 | 1.93e-13 | 123 |
| GO:005105215 | Esophagus | ESCC | regulation of DNA metabolic process | 232/8552 | 359/18723 | 2.40e-13 | 1.13e-11 | 232 |
| GO:004354313 | Esophagus | ESCC | protein acylation | 165/8552 | 243/18723 | 1.69e-12 | 7.14e-11 | 165 |
| GO:000072319 | Esophagus | ESCC | telomere maintenance | 99/8552 | 131/18723 | 2.68e-12 | 1.08e-10 | 99 |
| GO:000647313 | Esophagus | ESCC | protein acetylation | 140/8552 | 201/18723 | 4.37e-12 | 1.69e-10 | 140 |
| GO:007189716 | Esophagus | ESCC | DNA biosynthetic process | 127/8552 | 180/18723 | 1.04e-11 | 3.85e-10 | 127 |
| GO:00304904 | Esophagus | ESCC | maturation of SSU-rRNA | 45/8552 | 50/18723 | 5.07e-11 | 1.63e-09 | 45 |
| GO:003220417 | Esophagus | ESCC | regulation of telomere maintenance | 65/8552 | 80/18723 | 6.02e-11 | 1.90e-09 | 65 |
| GO:2000278110 | Esophagus | ESCC | regulation of DNA biosynthetic process | 81/8552 | 106/18723 | 9.81e-11 | 2.96e-09 | 81 |
| GO:00080333 | Esophagus | ESCC | tRNA processing | 92/8552 | 127/18723 | 7.83e-10 | 1.93e-08 | 92 |
| Page: 1 2 3 4 5 6 7 8 |
| Pathway ID | Tissue | Disease Stage | Description | Gene Ratio | Bg Ratio | pvalue | p.adjust | qvalue | Count |
| Page: 1 |
Top |
Cell-cell communication analysis |
| Identification of potential cell-cell interactions between two cell types and their ligand-receptor pairs for different disease states |
| Ligand | Receptor | LRpair | Pathway | Tissue | Disease Stage |
| Page: 1 |
Top |
Single-cell gene regulatory network inference analysis |
| Find out the significant the regulons (TFs) and the target genes of each regulon across cell types for different disease states |
| TF | Cell Type | Tissue | Disease Stage | Target Gene | RSS | Regulon Activity |
| ∗The dot plots of a searched regulon are shown for all cell subpopulations in each disease state of each tissue based on the regulon specific score inferred using pySCENIC and by calculating the average expression. |
| Page: 1 |
Top |
Somatic mutation of malignant transformation related genes |
| Annotation of somatic variants for genes involved in malignant transformation |
| Hugo Symbol | Variant Class | Variant Classification | dbSNP RS | HGVSc | HGVSp | HGVSp Short | SWISSPROT | BIOTYPE | SIFT | PolyPhen | Tumor Sample Barcode | Tissue | Histology | Sex | Age | Stage | Therapy Types | Drugs | Outcome |
| NAT10 | SNV | Missense_Mutation | c.2884G>A | p.Glu962Lys | p.E962K | Q9H0A0 | protein_coding | tolerated(0.77) | benign(0) | TCGA-AC-A23H-01 | Breast | breast invasive carcinoma | Female | >=65 | I/II | Unknown | Unknown | PD | |
| NAT10 | SNV | Missense_Mutation | novel | c.3023N>C | p.Leu1008Ser | p.L1008S | Q9H0A0 | protein_coding | tolerated(0.73) | benign(0.329) | TCGA-AC-A6IW-01 | Breast | breast invasive carcinoma | Female | >=65 | I/II | Unknown | Unknown | SD |
| NAT10 | SNV | Missense_Mutation | c.2321N>T | p.Arg774Leu | p.R774L | Q9H0A0 | protein_coding | deleterious(0) | probably_damaging(0.972) | TCGA-AQ-A04H-01 | Breast | breast invasive carcinoma | Female | <65 | III/IV | Chemotherapy | taxotere | SD | |
| NAT10 | SNV | Missense_Mutation | novel | c.520N>C | p.Glu174Gln | p.E174Q | Q9H0A0 | protein_coding | deleterious(0.01) | probably_damaging(0.949) | TCGA-AQ-A7U7-01 | Breast | breast invasive carcinoma | Female | <65 | III/IV | Targeted Molecular therapy | rituximab | CR |
| NAT10 | SNV | Missense_Mutation | c.2888N>G | p.Tyr963Cys | p.Y963C | Q9H0A0 | protein_coding | deleterious(0) | probably_damaging(0.986) | TCGA-BH-A0HA-01 | Breast | breast invasive carcinoma | Female | <65 | I/II | Unknown | Unknown | SD | |
| NAT10 | SNV | Missense_Mutation | novel | c.694G>A | p.Asp232Asn | p.D232N | Q9H0A0 | protein_coding | tolerated(0.13) | benign(0) | TCGA-LD-A74U-01 | Breast | breast invasive carcinoma | Female | >=65 | III/IV | Chemotherapy | taxotere | SD |
| NAT10 | SNV | Missense_Mutation | novel | c.1516G>A | p.Glu506Lys | p.E506K | Q9H0A0 | protein_coding | deleterious(0.01) | benign(0.041) | TCGA-OL-A66L-01 | Breast | breast invasive carcinoma | Female | >=65 | I/II | Unknown | Unknown | SD |
| NAT10 | insertion | Frame_Shift_Ins | novel | c.568_569insCCCCAGG | p.Leu191ProfsTer7 | p.L191Pfs*7 | Q9H0A0 | protein_coding | TCGA-A2-A0EO-01 | Breast | breast invasive carcinoma | Female | <65 | I/II | Hormone Therapy | tamoxiphen | SD | ||
| NAT10 | insertion | In_Frame_Ins | novel | c.570_571insGGAGTACAGAGACACGATCTTGGCTCA | p.Ser190_Leu191insGlyValGlnArgHisAspLeuGlySer | p.S190_L191insGVQRHDLGS | Q9H0A0 | protein_coding | TCGA-A2-A0EO-01 | Breast | breast invasive carcinoma | Female | <65 | I/II | Hormone Therapy | tamoxiphen | SD | ||
| NAT10 | SNV | Missense_Mutation | rs553463575 | c.2806N>A | p.Asp936Asn | p.D936N | Q9H0A0 | protein_coding | deleterious(0.03) | possibly_damaging(0.88) | TCGA-2W-A8YY-01 | Cervix | cervical & endocervical cancer | Female | <65 | I/II | Chemotherapy | cisplatin | CR |
| Page: 1 2 3 4 5 6 7 8 9 |
Top |
Related drugs of malignant transformation related genes |
| Identification of chemicals and drugs interact with genes involved in malignant transfromation |
| (DGIdb 4.0) |
| Entrez ID | Symbol | Category | Interaction Types | Drug Claim Name | Drug Name | PMIDs |
| Page: 1 |

Copyright 2023-Present -The University of Texas Health Science Center at Houston |