
|
|||||
|
 | |
| |
| |
| |
| |
| |
|
Gene: NARS |
Gene summary for NARS |
| Gene information | Species | Human | Gene symbol | NARS | Gene ID | 4677 |
| Gene name | asparaginyl-tRNA synthetase 1 | |
| Gene Alias | ASNRS | |
| Cytomap | 18q21.31 | |
| Gene Type | protein-coding | GO ID | GO:0006082 | UniProtAcc | O43776 |
Top |
Malignant transformation analysis |
| Identification of the aberrant gene expression in precancerous and cancerous lesions by comparing the gene expression of stem-like cells in diseased tissues with normal stem cells |
| Entrez ID | Symbol | Replicates | Species | Organ | Tissue | Adj P-value | Log2FC | Malignancy |
| 4677 | NARS | CCI_2 | Human | Cervix | CC | 2.86e-05 | 2.81e-01 | 0.5249 |
| 4677 | NARS | CCI_3 | Human | Cervix | CC | 3.04e-05 | 2.20e-01 | 0.516 |
| 4677 | NARS | Tumor | Human | Cervix | CC | 2.01e-33 | 5.44e-01 | 0.1241 |
| 4677 | NARS | sample1 | Human | Cervix | CC | 7.33e-06 | 2.03e-01 | 0.0959 |
| 4677 | NARS | sample3 | Human | Cervix | CC | 3.04e-39 | 5.07e-01 | 0.1387 |
| 4677 | NARS | H2 | Human | Cervix | HSIL_HPV | 1.35e-19 | 3.67e-01 | 0.0632 |
| 4677 | NARS | L1 | Human | Cervix | CC | 1.60e-05 | 2.88e-01 | 0.0802 |
| 4677 | NARS | T1 | Human | Cervix | CC | 1.64e-07 | 1.71e-01 | 0.0918 |
| 4677 | NARS | T2 | Human | Cervix | CC | 1.04e-10 | 3.71e-01 | 0.0709 |
| 4677 | NARS | T3 | Human | Cervix | CC | 8.09e-39 | 5.14e-01 | 0.1389 |
| 4677 | NARS | LZE4T | Human | Esophagus | ESCC | 9.65e-08 | 1.97e-01 | 0.0811 |
| 4677 | NARS | LZE7T | Human | Esophagus | ESCC | 9.16e-07 | 6.14e-01 | 0.0667 |
| 4677 | NARS | LZE8T | Human | Esophagus | ESCC | 6.62e-05 | 1.14e-02 | 0.067 |
| 4677 | NARS | LZE22D1 | Human | Esophagus | HGIN | 1.22e-02 | 1.27e-02 | 0.0595 |
| 4677 | NARS | LZE22T | Human | Esophagus | ESCC | 1.10e-03 | 2.47e-01 | 0.068 |
| 4677 | NARS | LZE24T | Human | Esophagus | ESCC | 1.30e-13 | 3.18e-01 | 0.0596 |
| 4677 | NARS | LZE21T | Human | Esophagus | ESCC | 4.07e-05 | 2.26e-01 | 0.0655 |
| 4677 | NARS | LZE6T | Human | Esophagus | ESCC | 3.47e-04 | 1.11e-01 | 0.0845 |
| 4677 | NARS | P1T-E | Human | Esophagus | ESCC | 7.44e-04 | 5.45e-01 | 0.0875 |
| 4677 | NARS | P2T-E | Human | Esophagus | ESCC | 9.44e-26 | 5.41e-01 | 0.1177 |
| Page: 1 2 3 4 5 6 7 |
| Tissue | Expression Dynamics | Abbreviation |
| Cervix | 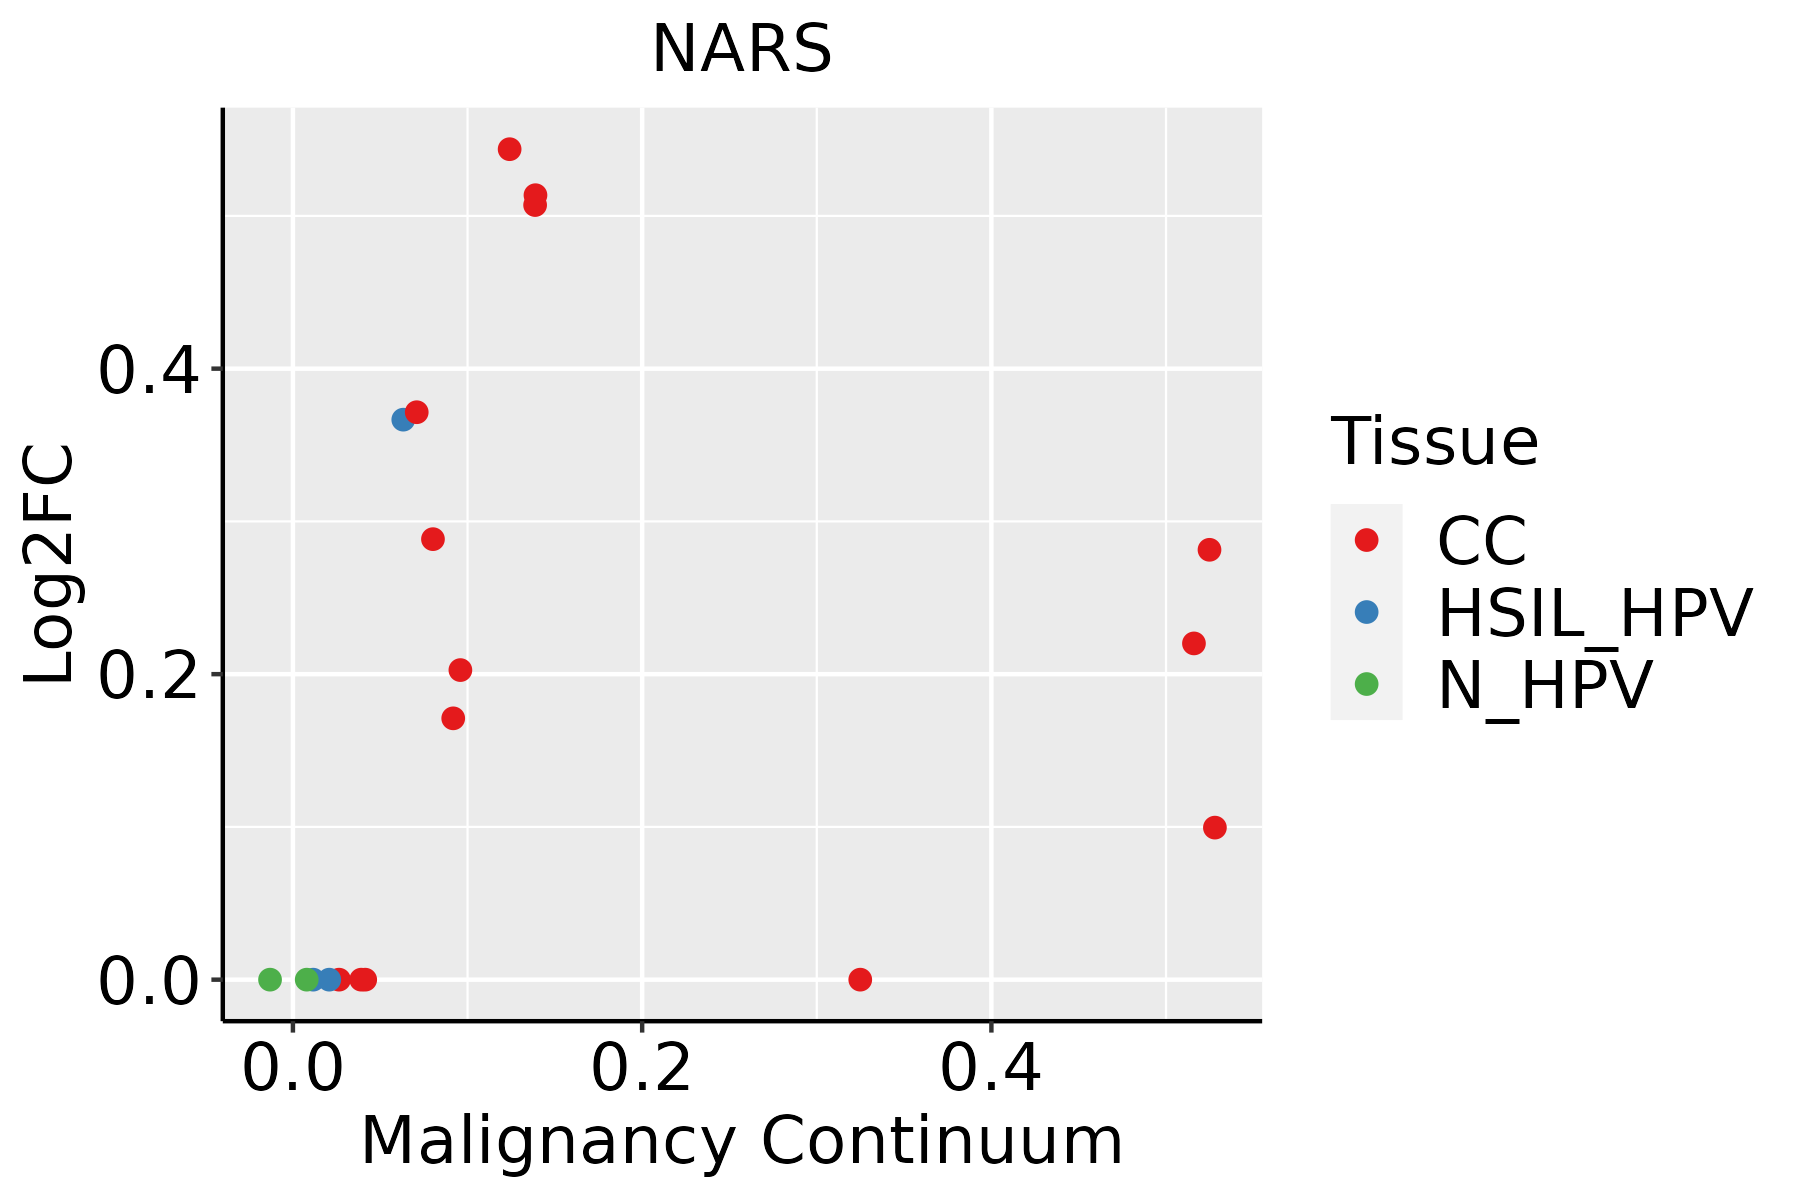 | CC: Cervix cancer |
| HSIL_HPV: HPV-infected high-grade squamous intraepithelial lesions | ||
| N_HPV: HPV-infected normal cervix | ||
| Esophagus | 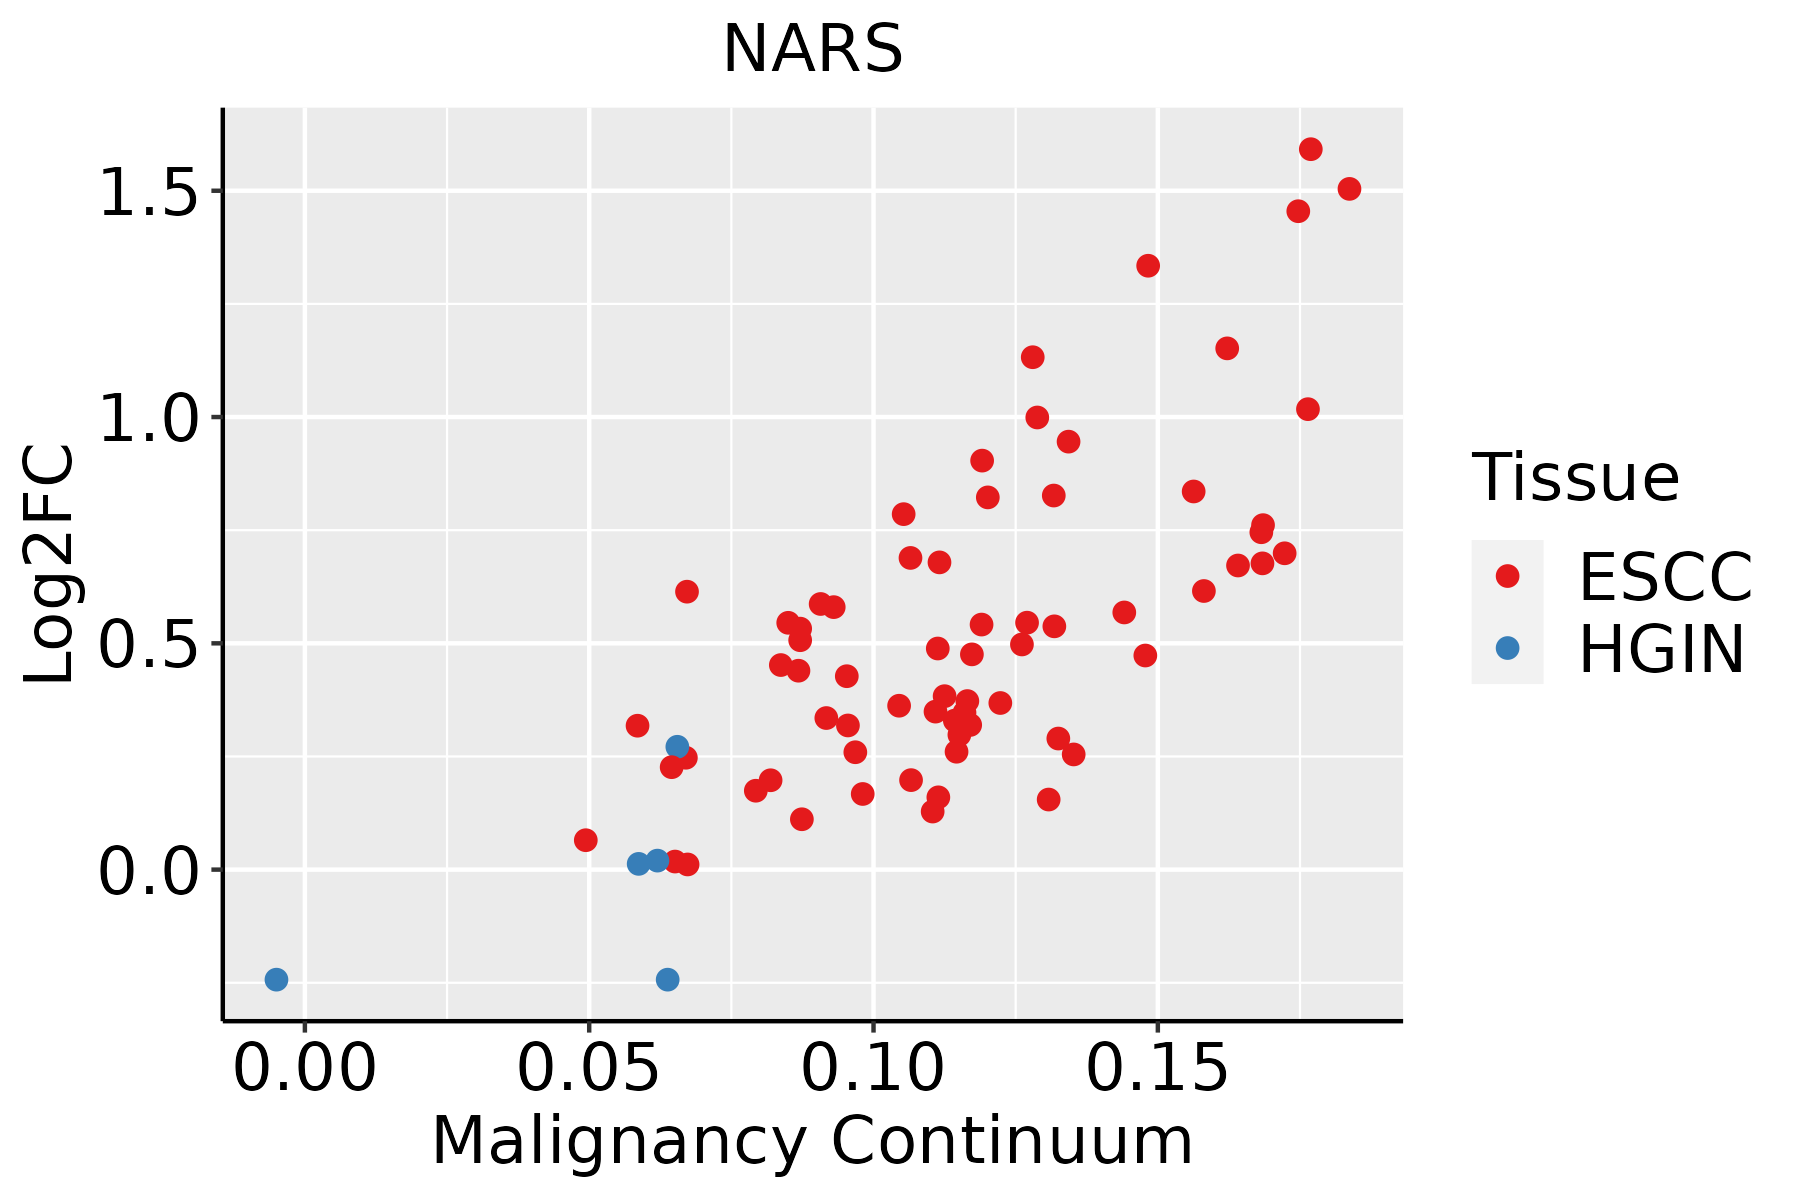 | ESCC: Esophageal squamous cell carcinoma |
| HGIN: High-grade intraepithelial neoplasias | ||
| LGIN: Low-grade intraepithelial neoplasias | ||
| Liver |  | HCC: Hepatocellular carcinoma |
| NAFLD: Non-alcoholic fatty liver disease | ||
| Oral Cavity | 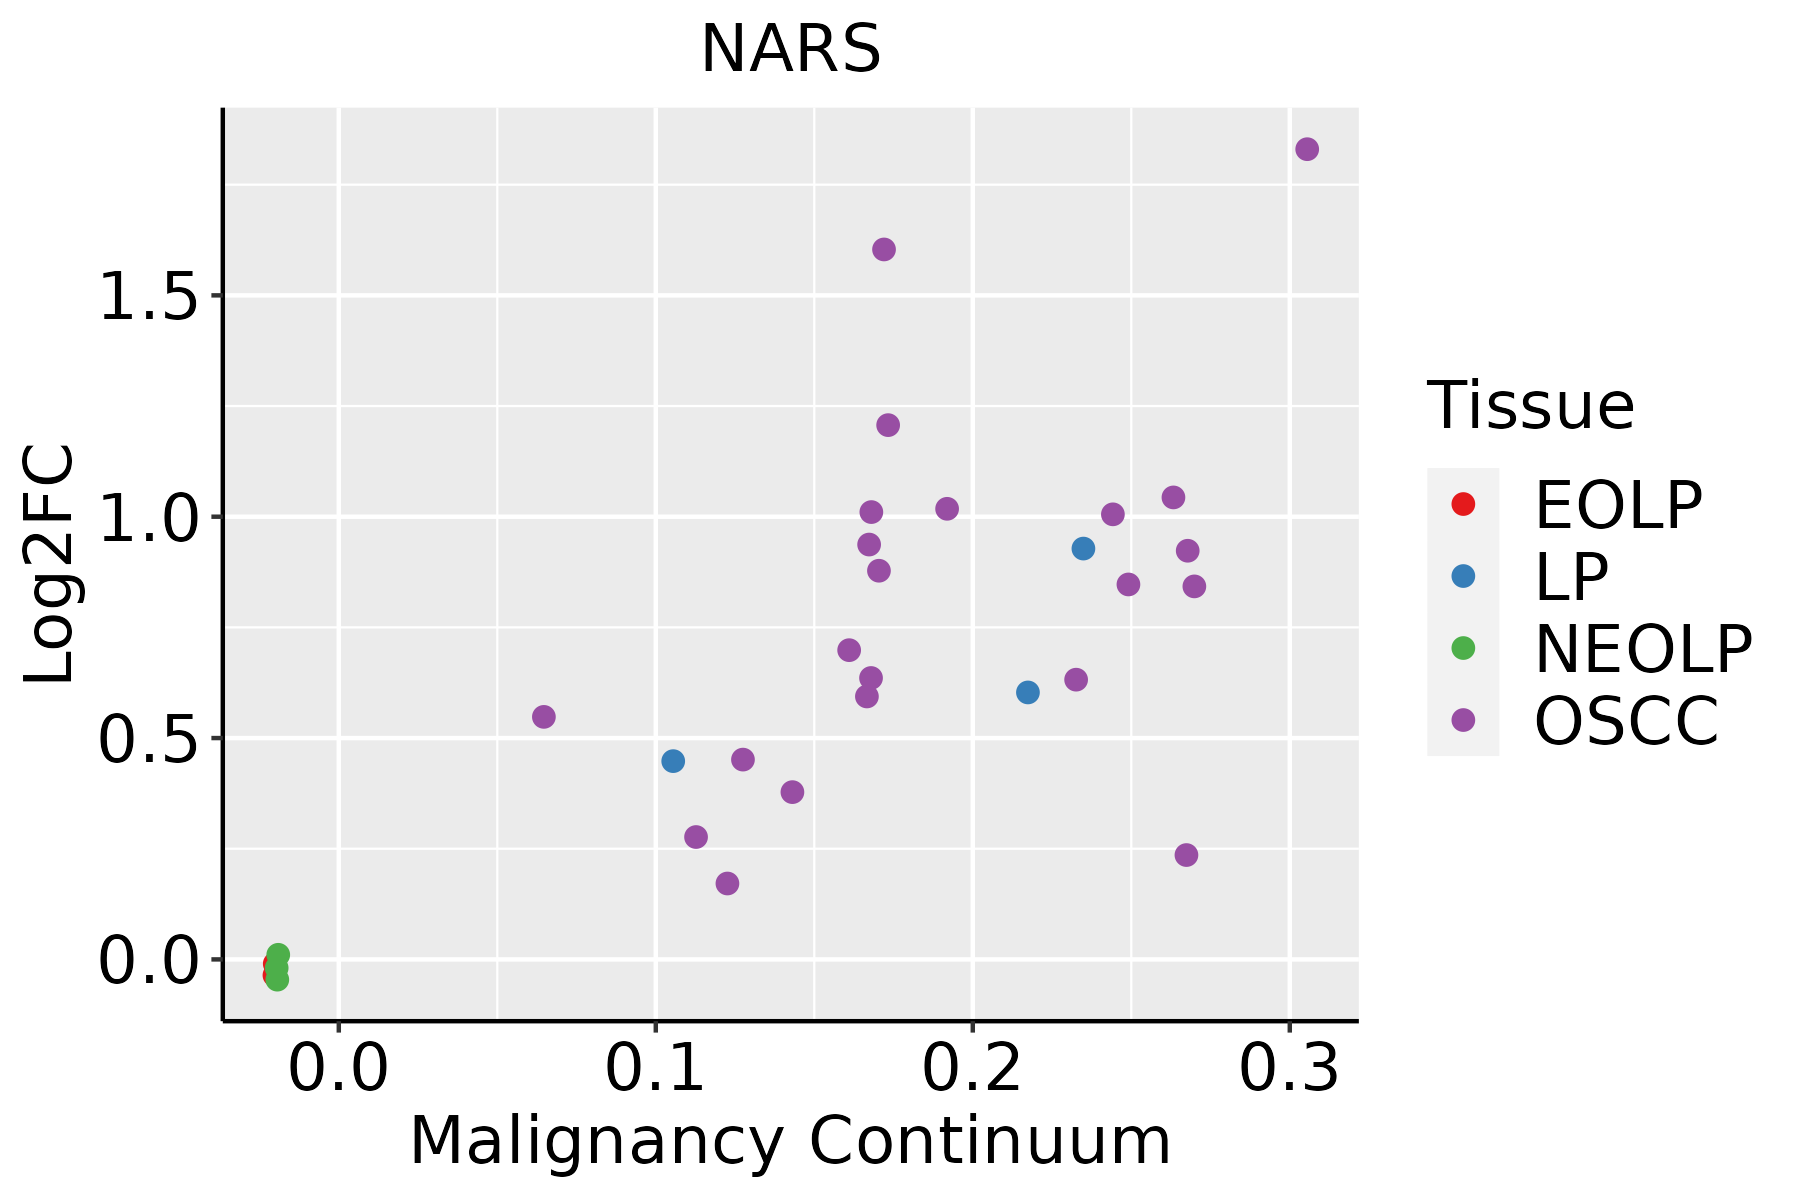 | EOLP: Erosive Oral lichen planus |
| LP: leukoplakia | ||
| NEOLP: Non-erosive oral lichen planus | ||
| OSCC: Oral squamous cell carcinoma | ||
| Skin |  | AK: Actinic keratosis |
| cSCC: Cutaneous squamous cell carcinoma | ||
| SCCIS:squamous cell carcinoma in situ | ||
| Thyroid | 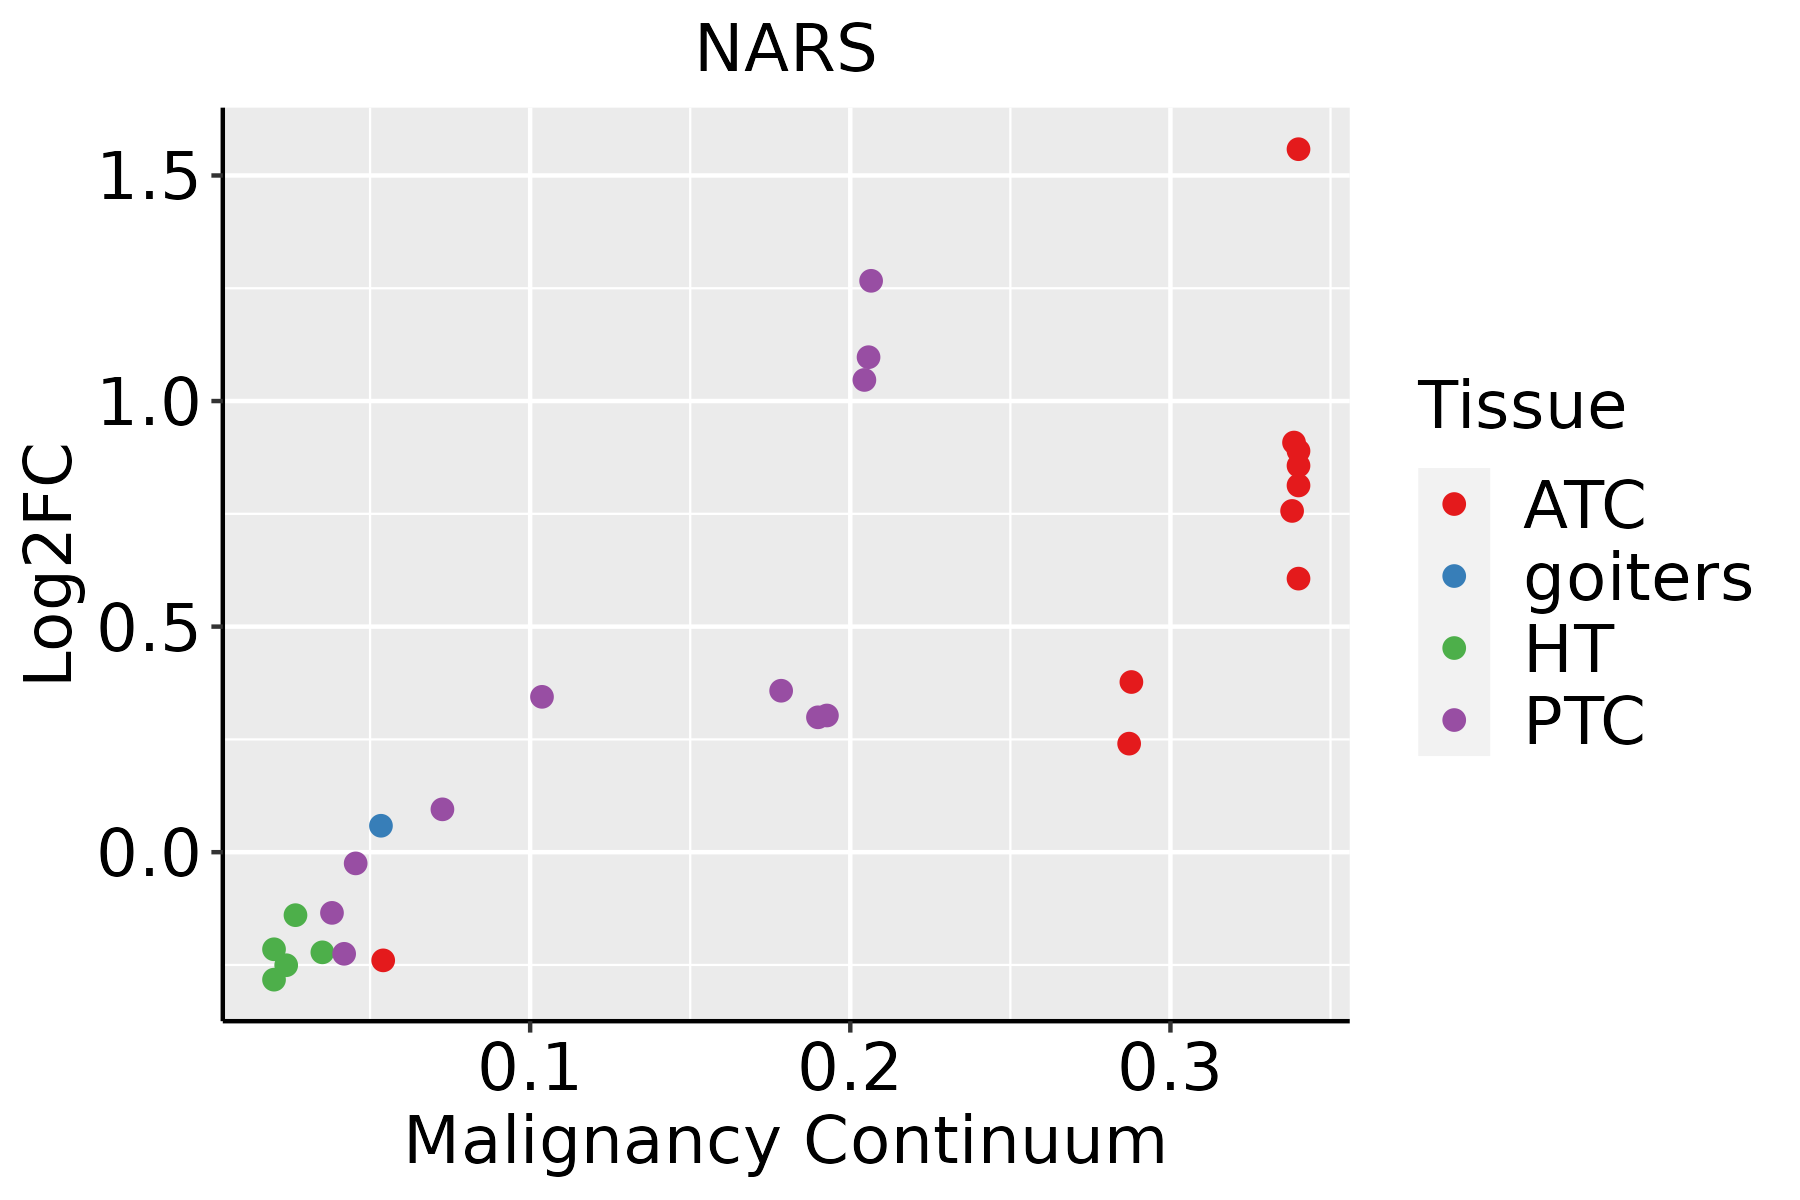 | ATC: Anaplastic thyroid cancer |
| HT: Hashimoto's thyroiditis | ||
| PTC: Papillary thyroid cancer |
| ∗log2FC in expression of this searched gene in stem-like cells from each diseased tissue sample relative to stem-like cells in normal samples in each tissue plotted against the malignancy continuum. Samples are colored based on if they are from different disease stage. |
Top |
Malignant transformation related pathway analysis |
| Find out the enriched GO biological processes and KEGG pathways involved in transition from healthy to precancer to cancer |
| Tissue | Disease Stage | Enriched GO biological Processes |
| Colorectum | AD |  |
| Colorectum | SER |  |
| Colorectum | MSS |  |
| Colorectum | MSI-H |  |
| Colorectum | FAP |  |
| ∗Top 15 enriched GO BP terms are showed in the bar plot of each disease state in each tissue. Each row represents a significant GO biological process which is colored according to the -log10(p.adjust). |
| Page: 1 2 3 4 5 6 7 8 9 |
| GO ID | Tissue | Disease Stage | Description | Gene Ratio | Bg Ratio | pvalue | p.adjust | Count |
| GO:0006418 | Colorectum | AD | tRNA aminoacylation for protein translation | 19/3918 | 41/18723 | 2.37e-04 | 3.03e-03 | 19 |
| GO:0043039 | Colorectum | AD | tRNA aminoacylation | 19/3918 | 44/18723 | 7.13e-04 | 7.21e-03 | 19 |
| GO:0043038 | Colorectum | AD | amino acid activation | 19/3918 | 45/18723 | 9.94e-04 | 9.28e-03 | 19 |
| GO:0006520 | Colorectum | AD | cellular amino acid metabolic process | 81/3918 | 284/18723 | 1.37e-03 | 1.19e-02 | 81 |
| GO:00064181 | Colorectum | SER | tRNA aminoacylation for protein translation | 17/2897 | 41/18723 | 5.75e-05 | 1.35e-03 | 17 |
| GO:00430391 | Colorectum | SER | tRNA aminoacylation | 17/2897 | 44/18723 | 1.64e-04 | 3.12e-03 | 17 |
| GO:00430381 | Colorectum | SER | amino acid activation | 17/2897 | 45/18723 | 2.25e-04 | 3.91e-03 | 17 |
| GO:00065201 | Colorectum | SER | cellular amino acid metabolic process | 61/2897 | 284/18723 | 4.20e-03 | 3.41e-02 | 61 |
| GO:003466012 | Esophagus | ESCC | ncRNA metabolic process | 346/8552 | 485/18723 | 4.35e-31 | 2.51e-28 | 346 |
| GO:00063992 | Esophagus | ESCC | tRNA metabolic process | 122/8552 | 179/18723 | 9.03e-10 | 2.19e-08 | 122 |
| GO:00346601 | Liver | HCC | ncRNA metabolic process | 332/7958 | 485/18723 | 1.48e-31 | 7.80e-29 | 332 |
| GO:00065202 | Liver | HCC | cellular amino acid metabolic process | 167/7958 | 284/18723 | 1.91e-08 | 4.56e-07 | 167 |
| GO:0006399 | Liver | HCC | tRNA metabolic process | 108/7958 | 179/18723 | 1.07e-06 | 1.59e-05 | 108 |
| GO:00346605 | Oral cavity | OSCC | ncRNA metabolic process | 296/7305 | 485/18723 | 2.94e-23 | 6.65e-21 | 296 |
| GO:00063991 | Oral cavity | OSCC | tRNA metabolic process | 101/7305 | 179/18723 | 1.65e-06 | 2.15e-05 | 101 |
| Page: 1 |
| Pathway ID | Tissue | Disease Stage | Description | Gene Ratio | Bg Ratio | pvalue | p.adjust | qvalue | Count |
| Page: 1 |
Top |
Cell-cell communication analysis |
| Identification of potential cell-cell interactions between two cell types and their ligand-receptor pairs for different disease states |
| Ligand | Receptor | LRpair | Pathway | Tissue | Disease Stage |
| Page: 1 |
Top |
Single-cell gene regulatory network inference analysis |
| Find out the significant the regulons (TFs) and the target genes of each regulon across cell types for different disease states |
| TF | Cell Type | Tissue | Disease Stage | Target Gene | RSS | Regulon Activity |
| ∗The dot plots of a searched regulon are shown for all cell subpopulations in each disease state of each tissue based on the regulon specific score inferred using pySCENIC and by calculating the average expression. |
| Page: 1 |
Top |
Somatic mutation of malignant transformation related genes |
| Annotation of somatic variants for genes involved in malignant transformation |
| Hugo Symbol | Variant Class | Variant Classification | dbSNP RS | HGVSc | HGVSp | HGVSp Short | SWISSPROT | BIOTYPE | SIFT | PolyPhen | Tumor Sample Barcode | Tissue | Histology | Sex | Age | Stage | Therapy Types | Drugs | Outcome |
| NARS | SNV | Missense_Mutation | c.780C>A | p.Phe260Leu | p.F260L | O43776 | protein_coding | tolerated(0.11) | benign(0.053) | TCGA-A1-A0SO-01 | Breast | breast invasive carcinoma | Female | >=65 | I/II | Chemotherapy | SD | ||
| NARS | insertion | Frame_Shift_Ins | novel | c.261_262insTTTCATGTTTTATTTAA | p.Ser88PhefsTer34 | p.S88Ffs*34 | O43776 | protein_coding | TCGA-A8-A06X-01 | Breast | breast invasive carcinoma | Female | >=65 | I/II | Unknown | Unknown | SD | ||
| NARS | SNV | Missense_Mutation | rs756870135 | c.1390N>A | p.Val464Met | p.V464M | O43776 | protein_coding | deleterious(0.01) | benign(0.378) | TCGA-2W-A8YY-01 | Cervix | cervical & endocervical cancer | Female | <65 | I/II | Chemotherapy | cisplatin | CR |
| NARS | SNV | Missense_Mutation | rs754289689 | c.888N>T | p.Leu296Phe | p.L296F | O43776 | protein_coding | deleterious(0) | probably_damaging(0.995) | TCGA-AA-3855-01 | Colorectum | colon adenocarcinoma | Male | >=65 | I/II | Unknown | Unknown | SD |
| NARS | SNV | Missense_Mutation | c.1565N>A | p.Arg522Gln | p.R522Q | O43776 | protein_coding | deleterious(0) | probably_damaging(1) | TCGA-AD-A5EJ-01 | Colorectum | colon adenocarcinoma | Female | >=65 | I/II | Unknown | Unknown | SD | |
| NARS | SNV | Missense_Mutation | novel | c.857N>C | p.Lys286Thr | p.K286T | O43776 | protein_coding | tolerated(0.07) | benign(0.142) | TCGA-CA-6717-01 | Colorectum | colon adenocarcinoma | Male | <65 | I/II | Chemotherapy | oxaliplatin | CR |
| NARS | SNV | Missense_Mutation | c.283N>A | p.Leu95Met | p.L95M | O43776 | protein_coding | deleterious(0.02) | probably_damaging(0.984) | TCGA-CM-4743-01 | Colorectum | colon adenocarcinoma | Male | >=65 | I/II | Chemotherapy | capecitabine | SD | |
| NARS | SNV | Missense_Mutation | c.263N>T | p.Ser88Ile | p.S88I | O43776 | protein_coding | tolerated(0.11) | benign(0) | TCGA-G4-6309-01 | Colorectum | colon adenocarcinoma | Female | <65 | III/IV | Chemotherapy | xeloda | PD | |
| NARS | SNV | Missense_Mutation | novel | c.225G>A | p.Met75Ile | p.M75I | O43776 | protein_coding | tolerated(0.37) | benign(0.01) | TCGA-AG-A002-01 | Colorectum | rectum adenocarcinoma | Male | <65 | I/II | Unknown | Unknown | SD |
| NARS | SNV | Missense_Mutation | c.279N>T | p.Lys93Asn | p.K93N | O43776 | protein_coding | tolerated(0.06) | benign(0.172) | TCGA-F5-6814-01 | Colorectum | rectum adenocarcinoma | Male | <65 | I/II | Unknown | Unknown | SD |
| Page: 1 2 3 4 5 |
Top |
Related drugs of malignant transformation related genes |
| Identification of chemicals and drugs interact with genes involved in malignant transfromation |
| (DGIdb 4.0) |
| Entrez ID | Symbol | Category | Interaction Types | Drug Claim Name | Drug Name | PMIDs |
| Page: 1 |

Copyright 2023-Present -The University of Texas Health Science Center at Houston |