
|
|||||
|
 | |
| |
| |
| |
| |
| |
|
Gene: NARF |
Gene summary for NARF |
| Gene information | Species | Human | Gene symbol | NARF | Gene ID | 26502 |
| Gene name | nuclear prelamin A recognition factor | |
| Gene Alias | IOP2 | |
| Cytomap | 17q25.3 | |
| Gene Type | protein-coding | GO ID | GO:0005575 | UniProtAcc | Q9UHQ1 |
Top |
Malignant transformation analysis |
| Identification of the aberrant gene expression in precancerous and cancerous lesions by comparing the gene expression of stem-like cells in diseased tissues with normal stem cells |
| Entrez ID | Symbol | Replicates | Species | Organ | Tissue | Adj P-value | Log2FC | Malignancy |
| 26502 | NARF | LZE4T | Human | Esophagus | ESCC | 1.61e-21 | 5.27e-01 | 0.0811 |
| 26502 | NARF | LZE5T | Human | Esophagus | ESCC | 1.00e-07 | 2.18e-01 | 0.0514 |
| 26502 | NARF | LZE7T | Human | Esophagus | ESCC | 4.01e-18 | 9.24e-01 | 0.0667 |
| 26502 | NARF | LZE8T | Human | Esophagus | ESCC | 9.71e-24 | 5.65e-01 | 0.067 |
| 26502 | NARF | LZE20T | Human | Esophagus | ESCC | 5.46e-12 | 2.44e-01 | 0.0662 |
| 26502 | NARF | LZE21D1 | Human | Esophagus | HGIN | 1.16e-04 | 4.26e-01 | 0.0632 |
| 26502 | NARF | LZE22D1 | Human | Esophagus | HGIN | 9.36e-04 | 2.76e-01 | 0.0595 |
| 26502 | NARF | LZE22T | Human | Esophagus | ESCC | 2.29e-08 | 9.66e-01 | 0.068 |
| 26502 | NARF | LZE24T | Human | Esophagus | ESCC | 1.33e-37 | 1.03e+00 | 0.0596 |
| 26502 | NARF | LZE22D3 | Human | Esophagus | HGIN | 1.90e-08 | 9.82e-01 | 0.0653 |
| 26502 | NARF | LZE21T | Human | Esophagus | ESCC | 1.35e-12 | 6.09e-01 | 0.0655 |
| 26502 | NARF | LZE6T | Human | Esophagus | ESCC | 4.50e-11 | 3.20e-01 | 0.0845 |
| 26502 | NARF | P1T-E | Human | Esophagus | ESCC | 1.19e-15 | 7.57e-01 | 0.0875 |
| 26502 | NARF | P2T-E | Human | Esophagus | ESCC | 1.69e-22 | 4.42e-01 | 0.1177 |
| 26502 | NARF | P4T-E | Human | Esophagus | ESCC | 1.81e-32 | 6.20e-01 | 0.1323 |
| 26502 | NARF | P5T-E | Human | Esophagus | ESCC | 1.42e-21 | 3.93e-01 | 0.1327 |
| 26502 | NARF | P8T-E | Human | Esophagus | ESCC | 3.14e-31 | 5.82e-01 | 0.0889 |
| 26502 | NARF | P9T-E | Human | Esophagus | ESCC | 2.88e-20 | 4.65e-01 | 0.1131 |
| 26502 | NARF | P10T-E | Human | Esophagus | ESCC | 5.44e-51 | 8.17e-01 | 0.116 |
| 26502 | NARF | P11T-E | Human | Esophagus | ESCC | 3.19e-33 | 1.42e+00 | 0.1426 |
| Page: 1 2 3 4 5 6 7 |
| Tissue | Expression Dynamics | Abbreviation |
| Esophagus | 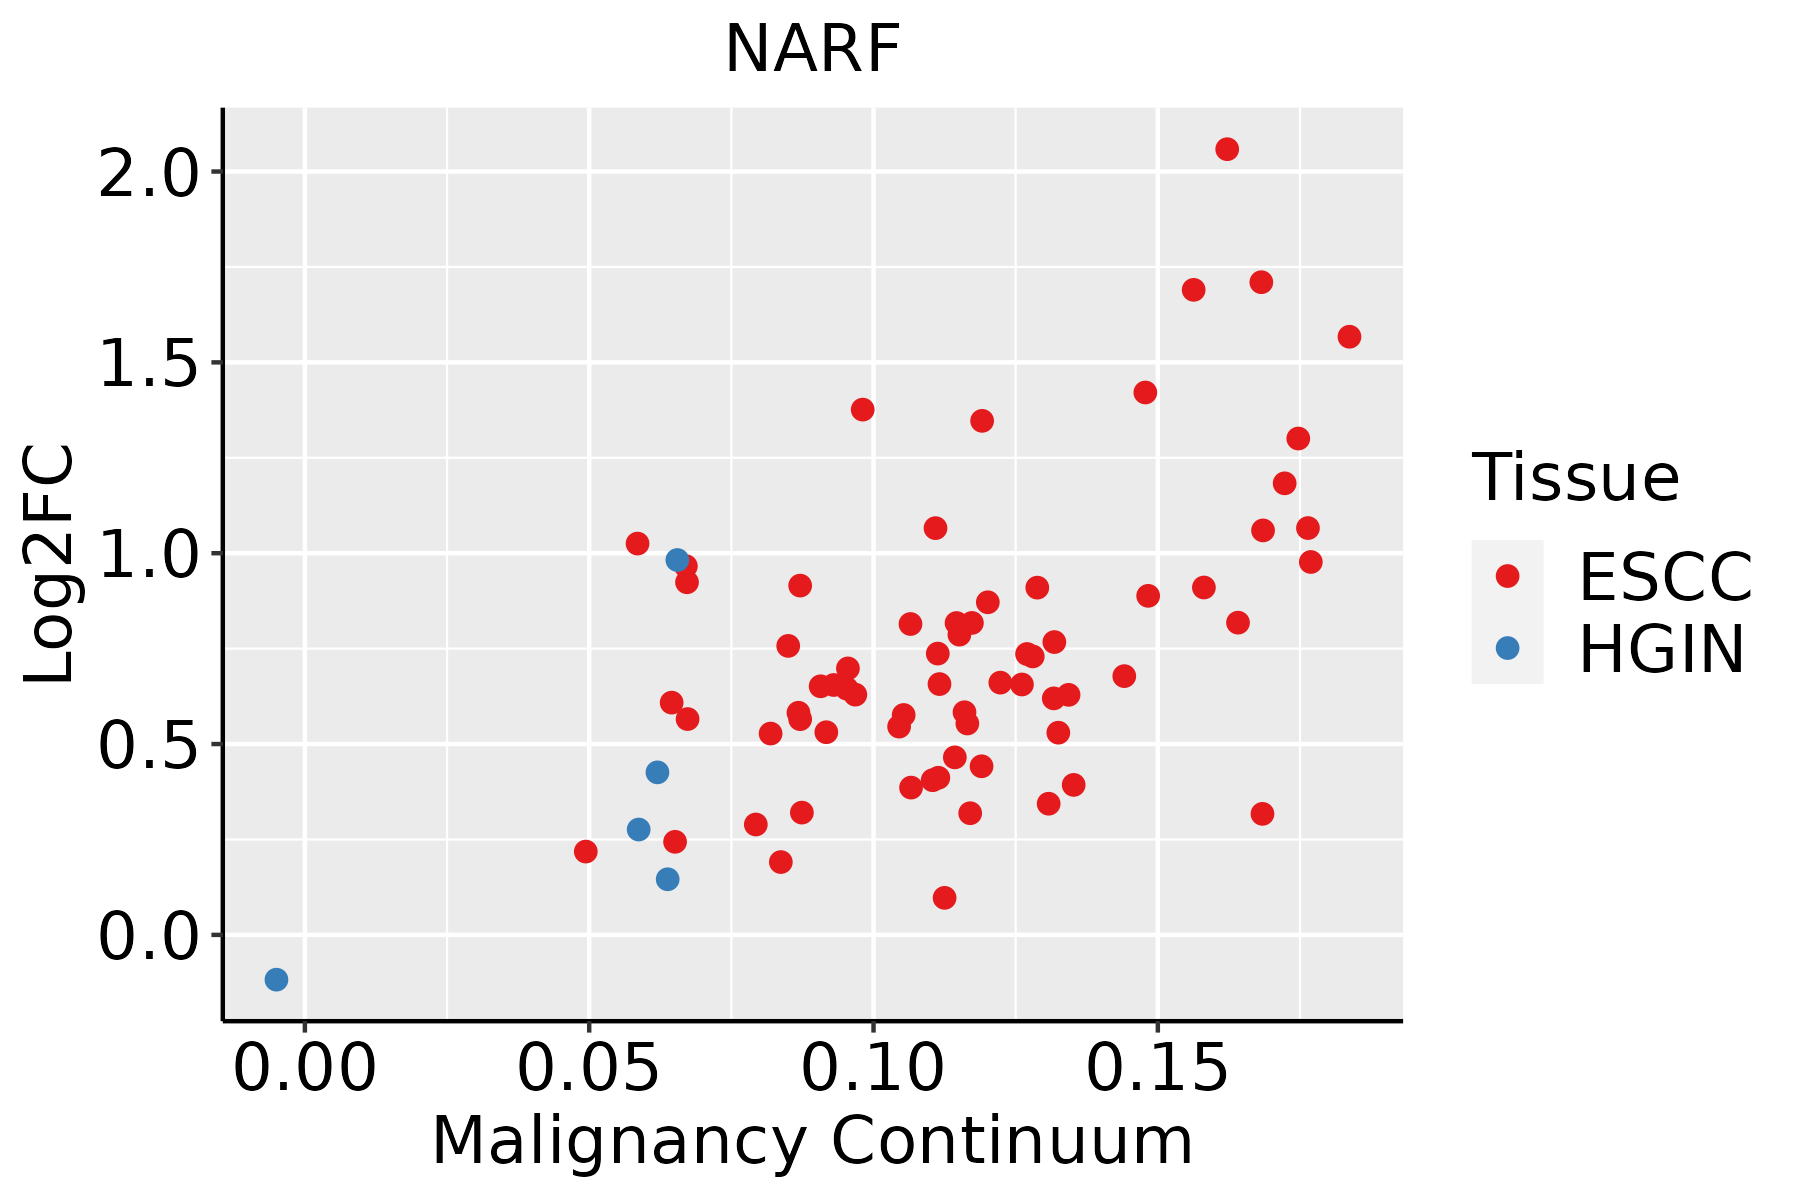 | ESCC: Esophageal squamous cell carcinoma |
| HGIN: High-grade intraepithelial neoplasias | ||
| LGIN: Low-grade intraepithelial neoplasias | ||
| Liver | 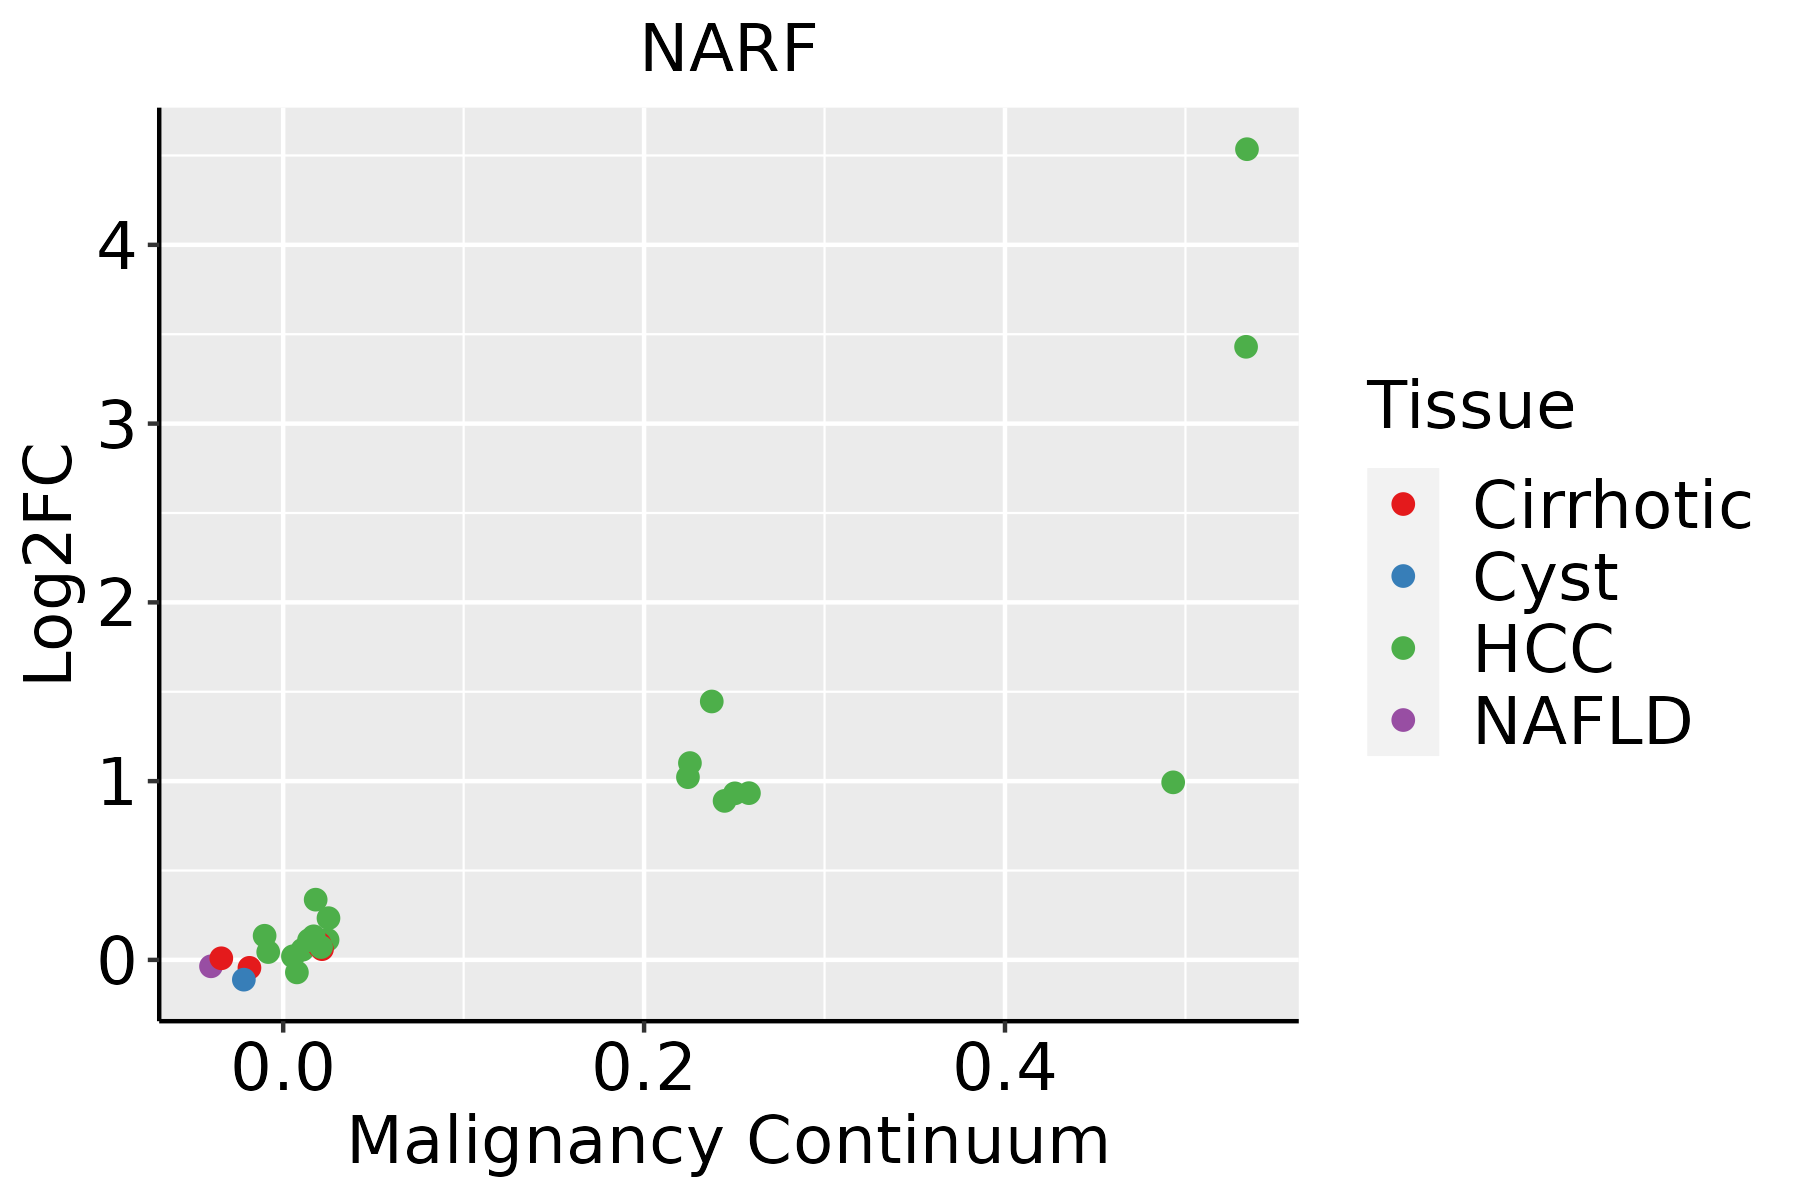 | HCC: Hepatocellular carcinoma |
| NAFLD: Non-alcoholic fatty liver disease | ||
| Oral Cavity | 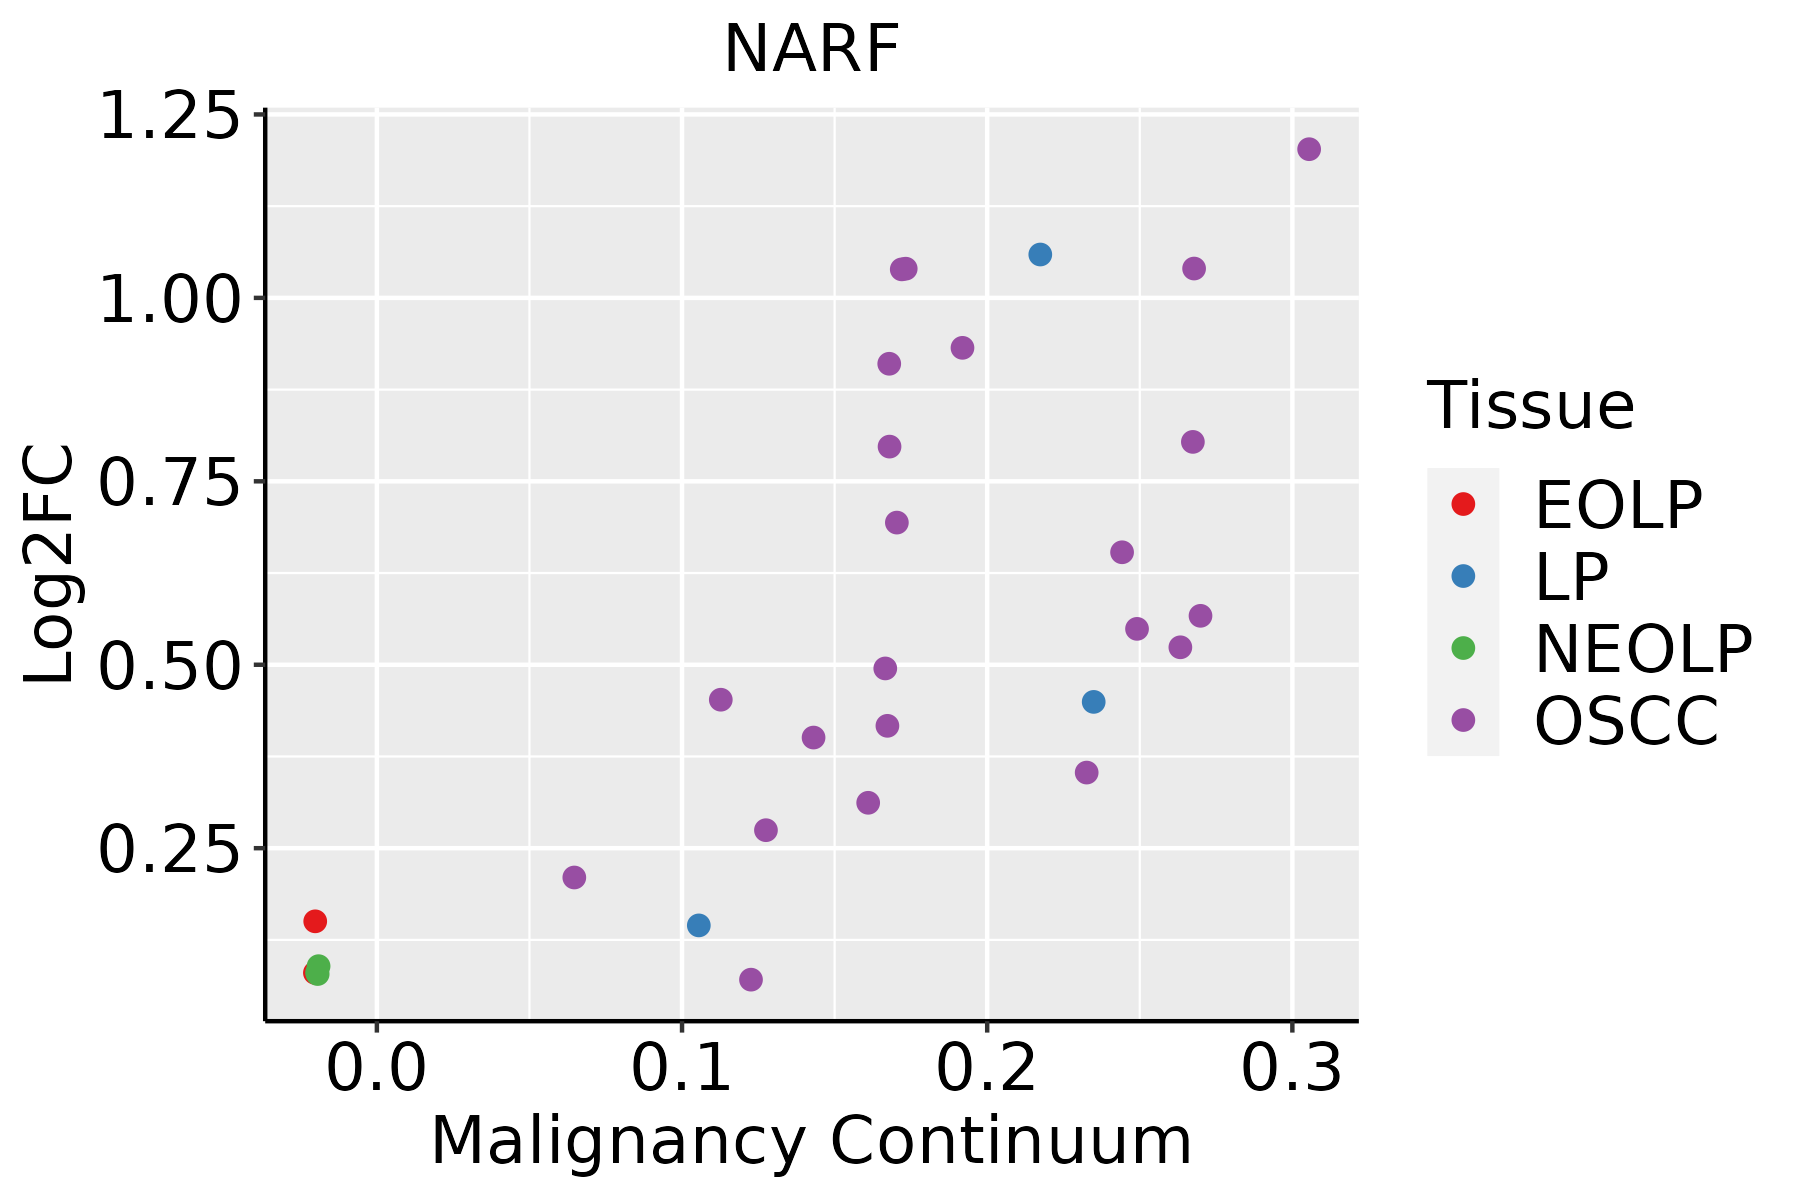 | EOLP: Erosive Oral lichen planus |
| LP: leukoplakia | ||
| NEOLP: Non-erosive oral lichen planus | ||
| OSCC: Oral squamous cell carcinoma | ||
| Prostate |  | BPH: Benign Prostatic Hyperplasia |
| Skin | 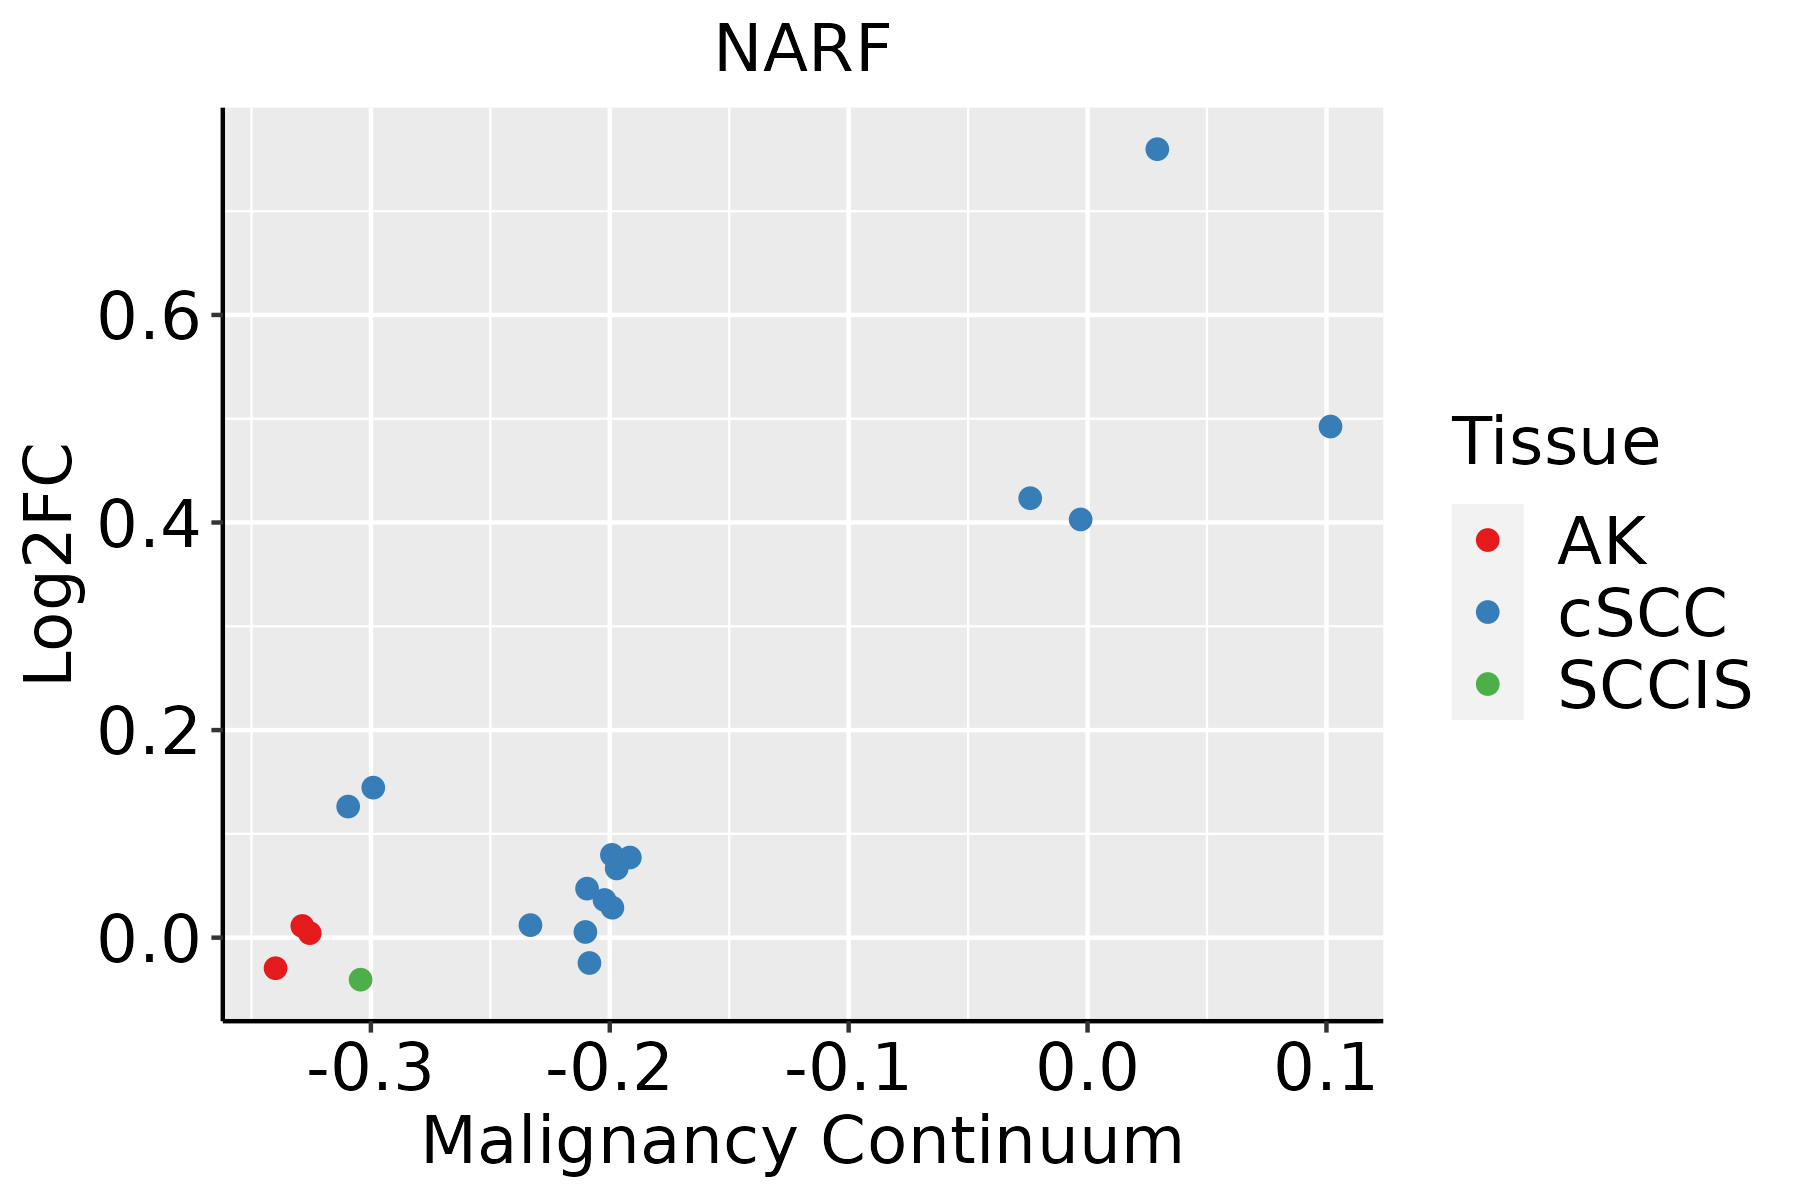 | AK: Actinic keratosis |
| cSCC: Cutaneous squamous cell carcinoma | ||
| SCCIS:squamous cell carcinoma in situ | ||
| Thyroid | 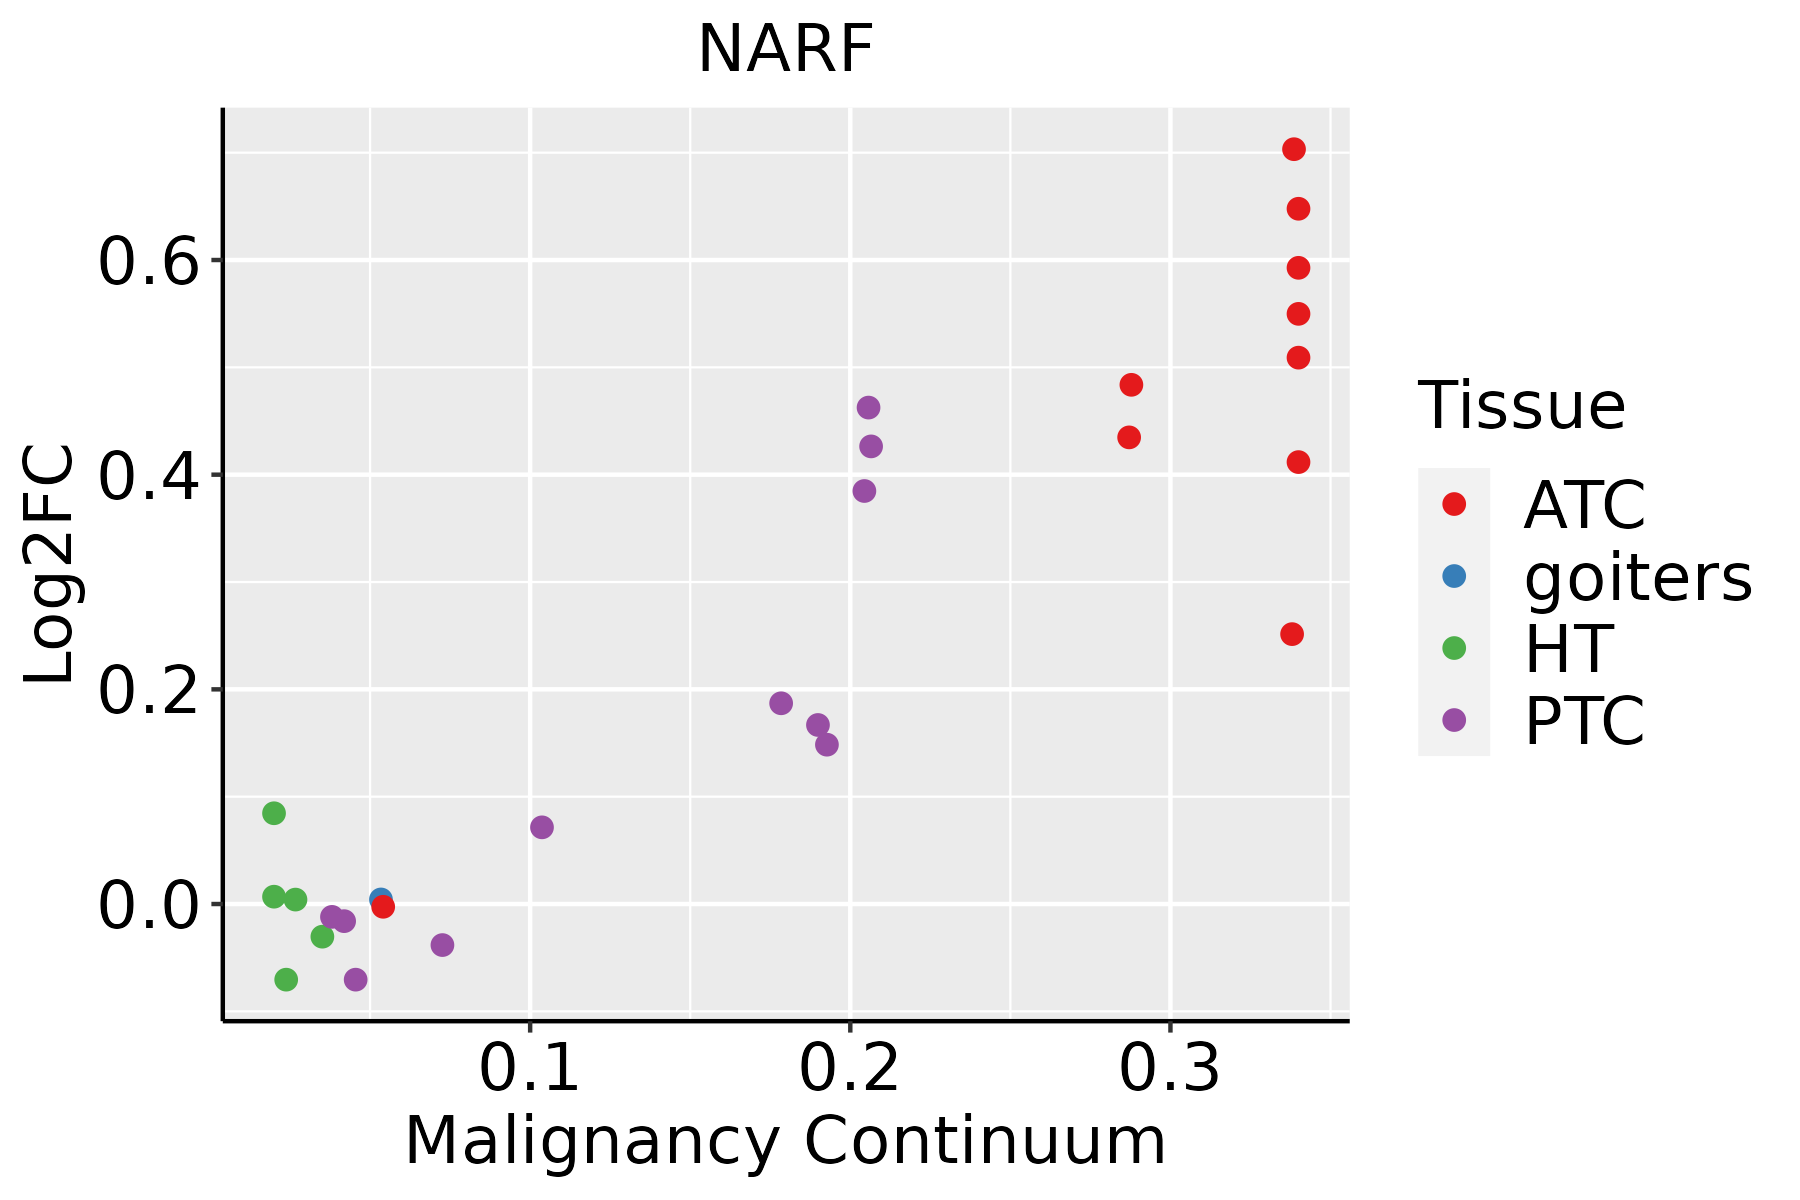 | ATC: Anaplastic thyroid cancer |
| HT: Hashimoto's thyroiditis | ||
| PTC: Papillary thyroid cancer |
| ∗log2FC in expression of this searched gene in stem-like cells from each diseased tissue sample relative to stem-like cells in normal samples in each tissue plotted against the malignancy continuum. Samples are colored based on if they are from different disease stage. |
Top |
Malignant transformation related pathway analysis |
| Find out the enriched GO biological processes and KEGG pathways involved in transition from healthy to precancer to cancer |
| Tissue | Disease Stage | Enriched GO biological Processes |
| Colorectum | AD |  |
| Colorectum | SER |  |
| Colorectum | MSS |  |
| Colorectum | MSI-H |  |
| Colorectum | FAP |  |
| ∗Top 15 enriched GO BP terms are showed in the bar plot of each disease state in each tissue. Each row represents a significant GO biological process which is colored according to the -log10(p.adjust). |
| Page: 1 2 3 4 5 6 7 8 9 |
| GO ID | Tissue | Disease Stage | Description | Gene Ratio | Bg Ratio | pvalue | p.adjust | Count |
| Page: 1 |
| Pathway ID | Tissue | Disease Stage | Description | Gene Ratio | Bg Ratio | pvalue | p.adjust | qvalue | Count |
| Page: 1 |
Top |
Cell-cell communication analysis |
| Identification of potential cell-cell interactions between two cell types and their ligand-receptor pairs for different disease states |
| Ligand | Receptor | LRpair | Pathway | Tissue | Disease Stage |
| Page: 1 |
Top |
Single-cell gene regulatory network inference analysis |
| Find out the significant the regulons (TFs) and the target genes of each regulon across cell types for different disease states |
| TF | Cell Type | Tissue | Disease Stage | Target Gene | RSS | Regulon Activity |
| ∗The dot plots of a searched regulon are shown for all cell subpopulations in each disease state of each tissue based on the regulon specific score inferred using pySCENIC and by calculating the average expression. |
| Page: 1 |
Top |
Somatic mutation of malignant transformation related genes |
| Annotation of somatic variants for genes involved in malignant transformation |
| Hugo Symbol | Variant Class | Variant Classification | dbSNP RS | HGVSc | HGVSp | HGVSp Short | SWISSPROT | BIOTYPE | SIFT | PolyPhen | Tumor Sample Barcode | Tissue | Histology | Sex | Age | Stage | Therapy Types | Drugs | Outcome |
| NARF | SNV | Missense_Mutation | novel | c.538G>A | p.Glu180Lys | p.E180K | Q9UHQ1 | protein_coding | deleterious(0) | probably_damaging(0.982) | TCGA-AO-A03O-01 | Breast | breast invasive carcinoma | Female | >=65 | I/II | Chemotherapy | doxorubicin | SD |
| NARF | SNV | Missense_Mutation | c.790N>A | p.Glu264Lys | p.E264K | Q9UHQ1 | protein_coding | deleterious(0.03) | possibly_damaging(0.861) | TCGA-BH-A18P-01 | Breast | breast invasive carcinoma | Female | <65 | I/II | Unknown | Unknown | PD | |
| NARF | SNV | Missense_Mutation | c.193G>A | p.Gly65Arg | p.G65R | Q9UHQ1 | protein_coding | tolerated(0.07) | benign(0.086) | TCGA-C8-A1HO-01 | Breast | breast invasive carcinoma | Female | <65 | III/IV | Chemotherapy | 5-fluorouracil | CR | |
| NARF | SNV | Missense_Mutation | novel | c.778G>A | p.Ala260Thr | p.A260T | Q9UHQ1 | protein_coding | tolerated(0.39) | benign(0.014) | TCGA-C8-A27B-01 | Breast | breast invasive carcinoma | Female | <65 | I/II | Chemotherapy | 5-fluorouracil | CR |
| NARF | SNV | Missense_Mutation | c.772N>A | p.Glu258Lys | p.E258K | Q9UHQ1 | protein_coding | deleterious(0.03) | possibly_damaging(0.536) | TCGA-E2-A10C-01 | Breast | breast invasive carcinoma | Female | <65 | I/II | Chemotherapy | cytoxan | SD | |
| NARF | insertion | Nonsense_Mutation | novel | c.1126_1127insAGCTATGATTGTGCCACTGCACTCCAGCCTGAGAGACAGAACAA | p.Gly376GlufsTer3 | p.G376Efs*3 | Q9UHQ1 | protein_coding | TCGA-AN-A04A-01 | Breast | breast invasive carcinoma | Female | <65 | III/IV | Unknown | Unknown | SD | ||
| NARF | insertion | Frame_Shift_Ins | novel | c.1270_1271insCC | p.Glu424AlafsTer67 | p.E424Afs*67 | Q9UHQ1 | protein_coding | TCGA-BH-A0B3-01 | Breast | breast invasive carcinoma | Female | <65 | I/II | Chemotherapy | cyclophosphamide | SD | ||
| NARF | insertion | Frame_Shift_Ins | novel | c.1272_1273insCCTGGCCAACATGGTAAAACCCTGTCTCTACTAAAAA | p.Trp425ProfsTer165 | p.W425Pfs*165 | Q9UHQ1 | protein_coding | TCGA-BH-A0B3-01 | Breast | breast invasive carcinoma | Female | <65 | I/II | Chemotherapy | cyclophosphamide | SD | ||
| NARF | insertion | Frame_Shift_Ins | novel | c.1228_1229insCTGTAATCCCAGCACTTTGGGA | p.Arg410ProfsTer175 | p.R410Pfs*175 | Q9UHQ1 | protein_coding | TCGA-BH-A0B8-01 | Breast | breast invasive carcinoma | Female | <65 | I/II | Hormone Therapy | arimidex | SD | ||
| NARF | deletion | In_Frame_Del | novel | c.1052_1099delNNNNNNNNNNNNNNNNNNNNNNNNNNNNNNNNNNNNNNNNNNNNNNNN | p.Ile352_His367del | p.I352_H367del | Q9UHQ1 | protein_coding | TCGA-EK-A2PM-01 | Cervix | cervical & endocervical cancer | Female | >=65 | I/II | Unknown | Unknown | SD |
| Page: 1 2 3 4 5 |
Top |
Related drugs of malignant transformation related genes |
| Identification of chemicals and drugs interact with genes involved in malignant transfromation |
| (DGIdb 4.0) |
| Entrez ID | Symbol | Category | Interaction Types | Drug Claim Name | Drug Name | PMIDs |
| Page: 1 |

Copyright 2023-Present -The University of Texas Health Science Center at Houston |