
|
|||||
|
 | |
| |
| |
| |
| |
| |
|
Gene: NAPSA |
Gene summary for NAPSA |
| Gene information | Species | Human | Gene symbol | NAPSA | Gene ID | 9476 |
| Gene name | napsin A aspartic peptidase | |
| Gene Alias | KAP | |
| Cytomap | 19q13.33 | |
| Gene Type | protein-coding | GO ID | GO:0001894 | UniProtAcc | O96009 |
Top |
Malignant transformation analysis |
| Identification of the aberrant gene expression in precancerous and cancerous lesions by comparing the gene expression of stem-like cells in diseased tissues with normal stem cells |
| Entrez ID | Symbol | Replicates | Species | Organ | Tissue | Adj P-value | Log2FC | Malignancy |
| 9476 | NAPSA | TD9 | Human | Lung | IAC | 6.91e-07 | -3.18e-01 | 0.088 |
| 9476 | NAPSA | RNA-P17T-P17T-2 | Human | Lung | IAC | 2.76e-09 | -1.34e+00 | 0.3371 |
| 9476 | NAPSA | RNA-P17T-P17T-4 | Human | Lung | IAC | 9.50e-08 | -1.41e+00 | 0.343 |
| 9476 | NAPSA | RNA-P17T-P17T-6 | Human | Lung | IAC | 7.60e-17 | -1.02e+00 | 0.3385 |
| 9476 | NAPSA | RNA-P17T-P17T-8 | Human | Lung | IAC | 1.56e-14 | -1.08e+00 | 0.3329 |
| 9476 | NAPSA | RNA-P18T-P18T-2 | Human | Lung | IAC | 3.55e-02 | -1.09e+00 | 0.1129 |
| 9476 | NAPSA | RNA-P18T-P18T-6 | Human | Lung | IAC | 1.20e-05 | -3.95e-01 | 0.0856 |
| 9476 | NAPSA | RNA-P18T-P18T-8 | Human | Lung | IAC | 1.08e-02 | -1.49e+00 | 0.1151 |
| 9476 | NAPSA | RNA-P3T-P3T-1 | Human | Lung | IAC | 8.81e-19 | -1.12e+00 | 0.1829 |
| 9476 | NAPSA | RNA-P3T-P3T-2 | Human | Lung | IAC | 7.07e-15 | -1.24e+00 | 0.1835 |
| 9476 | NAPSA | RNA-P3T-P3T-4 | Human | Lung | IAC | 9.35e-24 | -1.34e+00 | 0.1859 |
| 9476 | NAPSA | RNA-P6T1-P6T1-1 | Human | Lung | MIAC | 5.28e-05 | -8.88e-01 | -0.0238 |
| 9476 | NAPSA | RNA-P6T1-P6T1-2 | Human | Lung | MIAC | 9.47e-06 | -1.15e+00 | -0.0186 |
| 9476 | NAPSA | RNA-P6T1-P6T1-3 | Human | Lung | MIAC | 2.29e-06 | -6.87e-01 | -0.0296 |
| 9476 | NAPSA | RNA-P6T1-P6T1-4 | Human | Lung | MIAC | 8.55e-10 | -6.26e-01 | -0.0263 |
| 9476 | NAPSA | RNA-P6T2-P6T2-1 | Human | Lung | IAC | 6.69e-38 | -4.28e-01 | -0.0166 |
| 9476 | NAPSA | RNA-P6T2-P6T2-2 | Human | Lung | IAC | 9.96e-40 | -3.51e-01 | -0.0132 |
| 9476 | NAPSA | RNA-P6T2-P6T2-3 | Human | Lung | IAC | 3.53e-46 | -4.46e-01 | -0.013 |
| 9476 | NAPSA | RNA-P6T2-P6T2-4 | Human | Lung | IAC | 2.73e-41 | -4.51e-01 | -0.0121 |
| 9476 | NAPSA | RNA-P7T1-P7T1-2 | Human | Lung | AIS | 3.37e-03 | 9.46e-03 | -0.0876 |
| Page: 1 |
| Tissue | Expression Dynamics | Abbreviation |
| Lung | 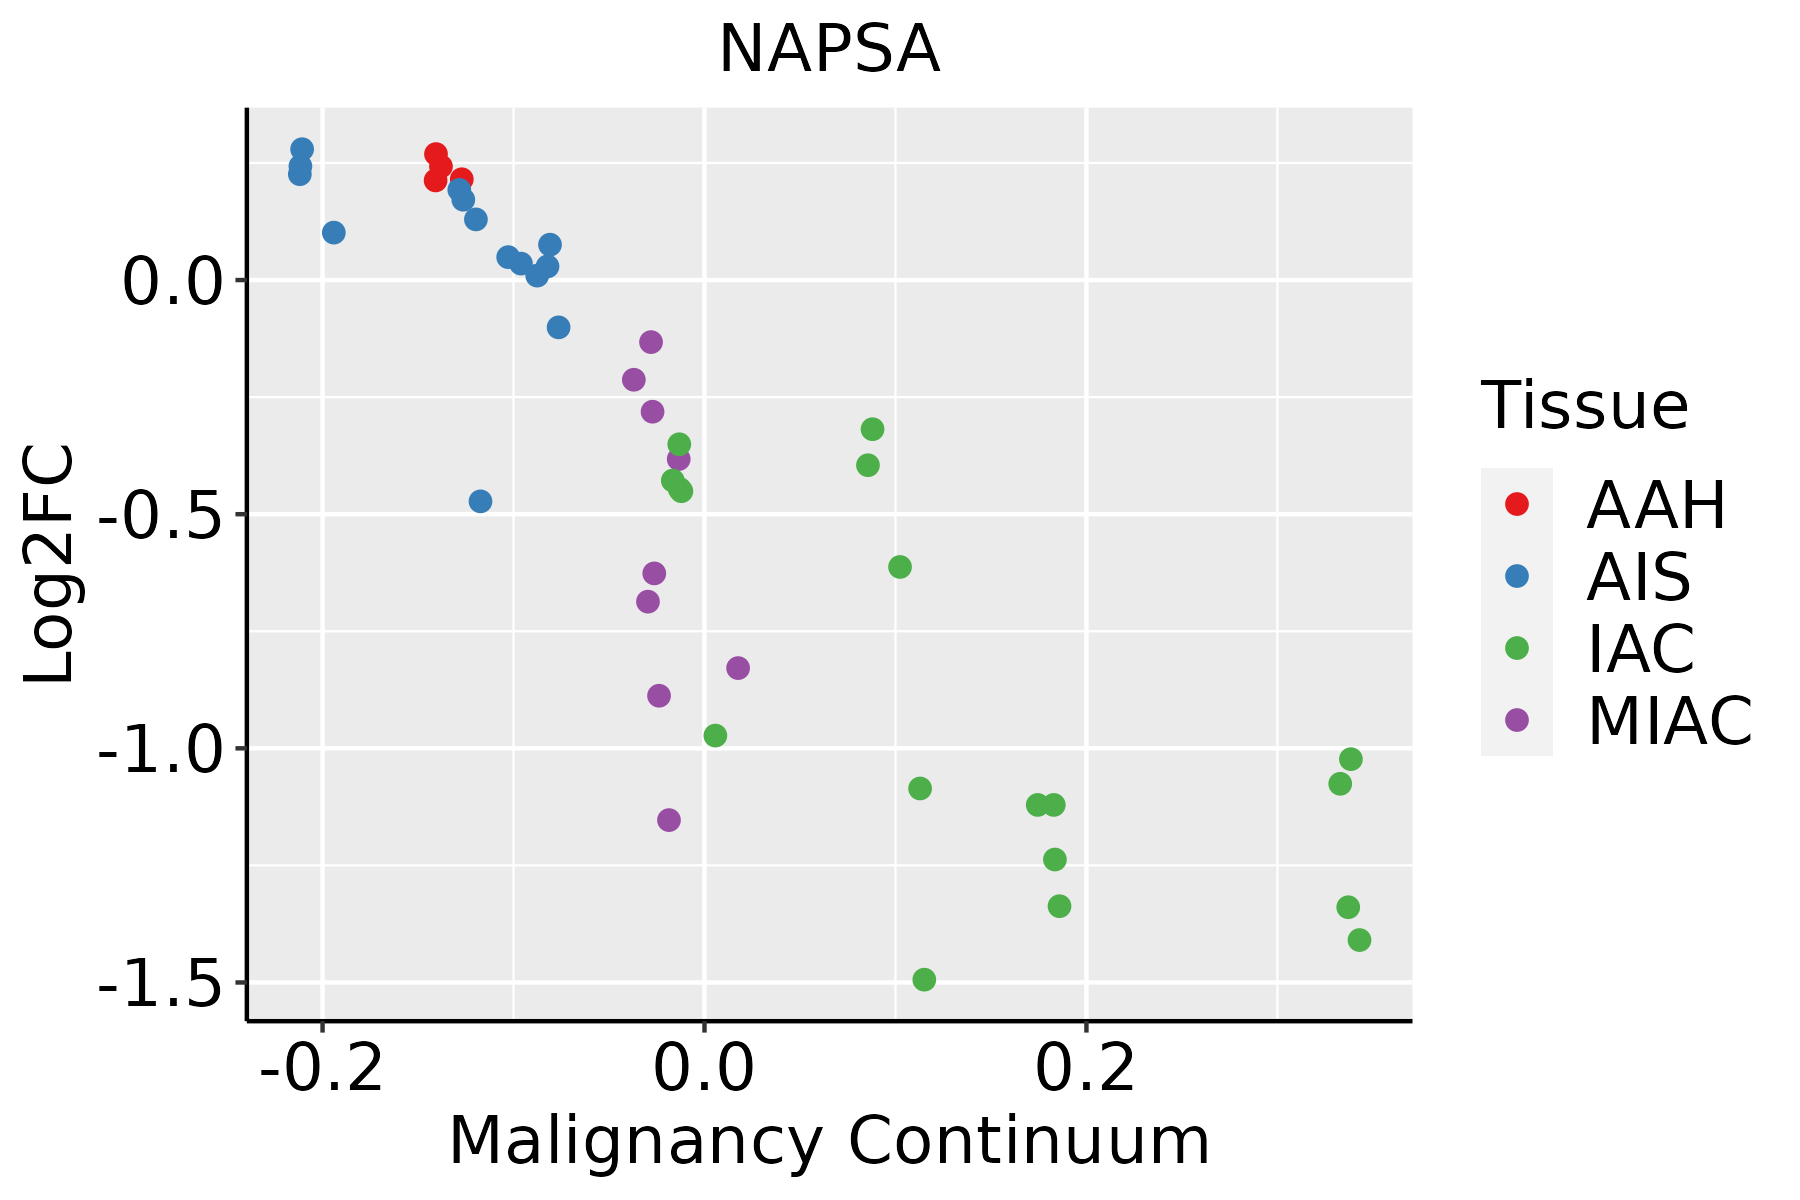 | AAH: Atypical adenomatous hyperplasia |
| AIS: Adenocarcinoma in situ | ||
| IAC: Invasive lung adenocarcinoma | ||
| MIA: Minimally invasive adenocarcinoma |
| ∗log2FC in expression of this searched gene in stem-like cells from each diseased tissue sample relative to stem-like cells in normal samples in each tissue plotted against the malignancy continuum. Samples are colored based on if they are from different disease stage. |
Top |
Malignant transformation related pathway analysis |
| Find out the enriched GO biological processes and KEGG pathways involved in transition from healthy to precancer to cancer |
| Tissue | Disease Stage | Enriched GO biological Processes |
| Colorectum | AD |  |
| Colorectum | SER |  |
| Colorectum | MSS |  |
| Colorectum | MSI-H |  |
| Colorectum | FAP |  |
| ∗Top 15 enriched GO BP terms are showed in the bar plot of each disease state in each tissue. Each row represents a significant GO biological process which is colored according to the -log10(p.adjust). |
| Page: 1 2 3 4 5 6 7 8 9 |
| GO ID | Tissue | Disease Stage | Description | Gene Ratio | Bg Ratio | pvalue | p.adjust | Count |
| GO:0048875 | Lung | IAC | chemical homeostasis within a tissue | 11/2061 | 14/18723 | 7.44e-09 | 1.05e-06 | 11 |
| GO:0043129 | Lung | IAC | surfactant homeostasis | 10/2061 | 12/18723 | 1.37e-08 | 1.77e-06 | 10 |
| GO:00018947 | Lung | IAC | tissue homeostasis | 46/2061 | 268/18723 | 1.50e-03 | 1.60e-02 | 46 |
| GO:00602497 | Lung | IAC | anatomical structure homeostasis | 51/2061 | 314/18723 | 2.91e-03 | 2.61e-02 | 51 |
| GO:00488751 | Lung | AIS | chemical homeostasis within a tissue | 9/1849 | 14/18723 | 1.11e-06 | 7.51e-05 | 9 |
| GO:00431291 | Lung | AIS | surfactant homeostasis | 8/1849 | 12/18723 | 3.07e-06 | 1.64e-04 | 8 |
| GO:000189412 | Lung | AIS | tissue homeostasis | 41/1849 | 268/18723 | 3.13e-03 | 3.01e-02 | 41 |
| GO:00431293 | Lung | MIAC | surfactant homeostasis | 6/967 | 12/18723 | 1.32e-05 | 9.85e-04 | 6 |
| GO:00488753 | Lung | MIAC | chemical homeostasis within a tissue | 6/967 | 14/18723 | 3.92e-05 | 2.08e-03 | 6 |
| GO:000189432 | Lung | MIAC | tissue homeostasis | 27/967 | 268/18723 | 7.22e-04 | 1.63e-02 | 27 |
| GO:006024922 | Lung | MIAC | anatomical structure homeostasis | 29/967 | 314/18723 | 1.83e-03 | 2.97e-02 | 29 |
| Page: 1 |
| Pathway ID | Tissue | Disease Stage | Description | Gene Ratio | Bg Ratio | pvalue | p.adjust | qvalue | Count |
| Page: 1 |
Top |
Cell-cell communication analysis |
| Identification of potential cell-cell interactions between two cell types and their ligand-receptor pairs for different disease states |
| Ligand | Receptor | LRpair | Pathway | Tissue | Disease Stage |
| Page: 1 |
Top |
Single-cell gene regulatory network inference analysis |
| Find out the significant the regulons (TFs) and the target genes of each regulon across cell types for different disease states |
| TF | Cell Type | Tissue | Disease Stage | Target Gene | RSS | Regulon Activity |
| ∗The dot plots of a searched regulon are shown for all cell subpopulations in each disease state of each tissue based on the regulon specific score inferred using pySCENIC and by calculating the average expression. |
| Page: 1 |
Top |
Somatic mutation of malignant transformation related genes |
| Annotation of somatic variants for genes involved in malignant transformation |
| Hugo Symbol | Variant Class | Variant Classification | dbSNP RS | HGVSc | HGVSp | HGVSp Short | SWISSPROT | BIOTYPE | SIFT | PolyPhen | Tumor Sample Barcode | Tissue | Histology | Sex | Age | Stage | Therapy Types | Drugs | Outcome |
| NAPSA | insertion | Frame_Shift_Ins | novel | c.956_957insG | p.Ile320AsnfsTer17 | p.I320Nfs*17 | O96009 | protein_coding | TCGA-AO-A0JD-01 | Breast | breast invasive carcinoma | Female | <65 | III/IV | Chemotherapy | cyclophosphamide | SD | ||
| NAPSA | insertion | Nonsense_Mutation | novel | c.955_956insTGGCAGTGGGGGTTGGCCGTAATTGGTAAGGGTTTACC | p.Glu319ValfsTer10 | p.E319Vfs*10 | O96009 | protein_coding | TCGA-AO-A0JD-01 | Breast | breast invasive carcinoma | Female | <65 | III/IV | Chemotherapy | cyclophosphamide | SD | ||
| NAPSA | deletion | Frame_Shift_Del | novel | c.857delN | p.Thr286SerfsTer105 | p.T286Sfs*105 | O96009 | protein_coding | TCGA-EW-A2FV-01 | Breast | breast invasive carcinoma | Female | <65 | III/IV | Chemotherapy | docetaxel | SD | ||
| NAPSA | SNV | Missense_Mutation | c.362N>A | p.Arg121Gln | p.R121Q | O96009 | protein_coding | deleterious(0.01) | probably_damaging(0.998) | TCGA-HG-A2PA-01 | Cervix | cervical & endocervical cancer | Female | <65 | I/II | Unspecific | Taxol | PD | |
| NAPSA | SNV | Missense_Mutation | c.1091C>A | p.Pro364His | p.P364H | O96009 | protein_coding | deleterious(0) | probably_damaging(0.947) | TCGA-A6-A565-01 | Colorectum | colon adenocarcinoma | Female | <65 | III/IV | Unspecific | 5FU | PD | |
| NAPSA | SNV | Missense_Mutation | rs186910155 | c.433C>T | p.Arg145Trp | p.R145W | O96009 | protein_coding | deleterious(0) | probably_damaging(0.971) | TCGA-AA-A01P-01 | Colorectum | colon adenocarcinoma | Female | >=65 | III/IV | Unknown | Unknown | PD |
| NAPSA | SNV | Missense_Mutation | novel | c.94N>A | p.His32Asn | p.H32N | O96009 | protein_coding | tolerated(0.08) | benign(0.014) | TCGA-AZ-4315-01 | Colorectum | colon adenocarcinoma | Male | <65 | I/II | Unknown | Unknown | SD |
| NAPSA | SNV | Missense_Mutation | c.1027G>A | p.Val343Ile | p.V343I | O96009 | protein_coding | tolerated(0.39) | probably_damaging(0.995) | TCGA-AZ-4614-01 | Colorectum | colon adenocarcinoma | Female | >=65 | I/II | Unknown | Unknown | PD | |
| NAPSA | SNV | Missense_Mutation | rs779771946 | c.973N>A | p.Ala325Thr | p.A325T | O96009 | protein_coding | tolerated(0.84) | benign(0.019) | TCGA-CA-5796-01 | Colorectum | colon adenocarcinoma | Female | <65 | I/II | Chemotherapy | oxaliplatin | CR |
| NAPSA | SNV | Missense_Mutation | novel | c.287N>G | p.Asp96Gly | p.D96G | O96009 | protein_coding | deleterious(0) | probably_damaging(0.999) | TCGA-EI-6917-01 | Colorectum | rectum adenocarcinoma | Male | <65 | III/IV | Chemotherapy | 5fluorouracil+oxaciplatina+l-folinian | SD |
| Page: 1 2 3 4 5 |
Top |
Related drugs of malignant transformation related genes |
| Identification of chemicals and drugs interact with genes involved in malignant transfromation |
| (DGIdb 4.0) |
| Entrez ID | Symbol | Category | Interaction Types | Drug Claim Name | Drug Name | PMIDs |
| Page: 1 |

Copyright 2023-Present -The University of Texas Health Science Center at Houston |