
|
|||||
|
 | |
| |
| |
| |
| |
| |
|
Gene: NAPRT1 |
Gene summary for NAPRT1 |
| Gene information | Species | Human | Gene symbol | NAPRT1 | Gene ID | 93100 |
| Gene name | nicotinate phosphoribosyltransferase | |
| Gene Alias | NAPRT1 | |
| Cytomap | 8q24.3 | |
| Gene Type | protein-coding | GO ID | GO:0006139 | UniProtAcc | Q6XQN6 |
Top |
Malignant transformation analysis |
| Identification of the aberrant gene expression in precancerous and cancerous lesions by comparing the gene expression of stem-like cells in diseased tissues with normal stem cells |
| Entrez ID | Symbol | Replicates | Species | Organ | Tissue | Adj P-value | Log2FC | Malignancy |
| 93100 | NAPRT1 | Pt13.a | Human | Liver | HCC | 5.18e-27 | 4.74e-01 | 0.021 |
| 93100 | NAPRT1 | Pt13.b | Human | Liver | HCC | 9.90e-52 | 6.77e-01 | 0.0251 |
| 93100 | NAPRT1 | Pt14.a | Human | Liver | HCC | 1.06e-18 | 5.97e-01 | 0.0169 |
| 93100 | NAPRT1 | Pt14.b | Human | Liver | HCC | 1.91e-25 | 7.07e-01 | 0.018 |
| 93100 | NAPRT1 | Pt14.d | Human | Liver | HCC | 7.14e-15 | 3.36e-01 | 0.0143 |
| 93100 | NAPRT1 | P1_S1_AK | Human | Skin | AK | 9.41e-05 | -9.94e-02 | -0.3399 |
| 93100 | NAPRT1 | P2_S3_AK | Human | Skin | AK | 4.43e-05 | -9.94e-02 | -0.3287 |
| 93100 | NAPRT1 | P2_S4_SCCIS | Human | Skin | SCCIS | 2.00e-04 | -9.94e-02 | -0.3043 |
| 93100 | NAPRT1 | P3_S6_AK | Human | Skin | AK | 4.43e-05 | -9.94e-02 | -0.3256 |
| 93100 | NAPRT1 | P5_S10_cSCC | Human | Skin | cSCC | 9.41e-05 | -9.94e-02 | -0.299 |
| 93100 | NAPRT1 | P1_cSCC | Human | Skin | cSCC | 3.21e-50 | 1.56e+00 | 0.0292 |
| 93100 | NAPRT1 | P2_cSCC | Human | Skin | cSCC | 3.40e-27 | 7.55e-01 | -0.024 |
| 93100 | NAPRT1 | P4_cSCC | Human | Skin | cSCC | 6.40e-37 | 9.22e-01 | -0.00290000000000005 |
| 93100 | NAPRT1 | P10_cSCC | Human | Skin | cSCC | 1.33e-38 | 1.10e+00 | 0.1017 |
| 93100 | NAPRT1 | cSCC_p1 | Human | Skin | cSCC | 4.43e-05 | -9.94e-02 | -0.1916 |
| 93100 | NAPRT1 | cSCC_p10 | Human | Skin | cSCC | 4.43e-05 | -9.94e-02 | -0.2095 |
| 93100 | NAPRT1 | cSCC_p11 | Human | Skin | cSCC | 4.43e-05 | -9.94e-02 | -0.2102 |
| 93100 | NAPRT1 | cSCC_p3 | Human | Skin | cSCC | 4.43e-05 | -9.94e-02 | -0.2085 |
| 93100 | NAPRT1 | cSCC_p4 | Human | Skin | cSCC | 4.01e-03 | -9.94e-02 | -0.2022 |
| 93100 | NAPRT1 | cSCC_p6 | Human | Skin | cSCC | 2.00e-04 | -9.94e-02 | -0.1989 |
| Page: 1 2 |
| Tissue | Expression Dynamics | Abbreviation |
| GC | 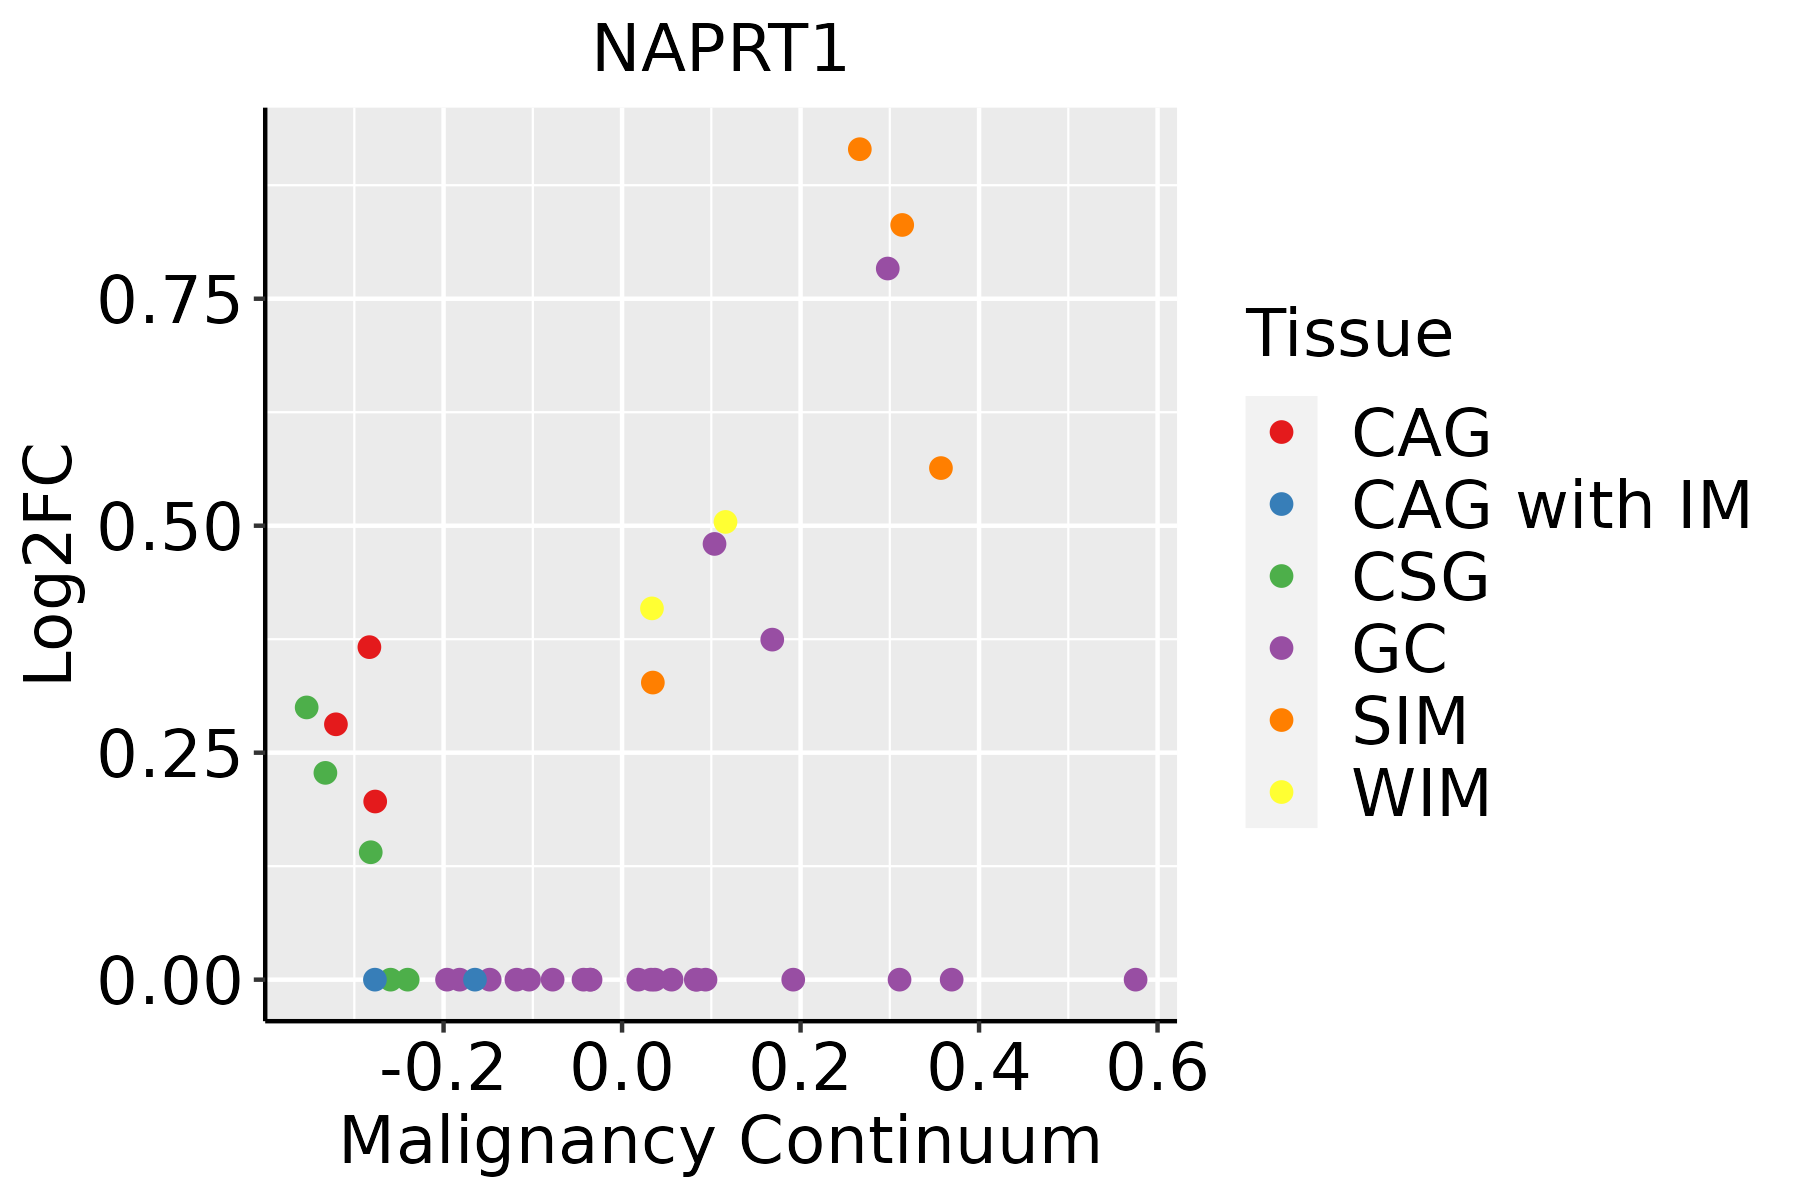 | CAG: Chronic atrophic gastritis |
| CAG with IM: Chronic atrophic gastritis with intestinal metaplasia | ||
| CSG: Chronic superficial gastritis | ||
| GC: Gastric cancer | ||
| SIM: Severe intestinal metaplasia | ||
| WIM: Wild intestinal metaplasia | ||
| Liver | 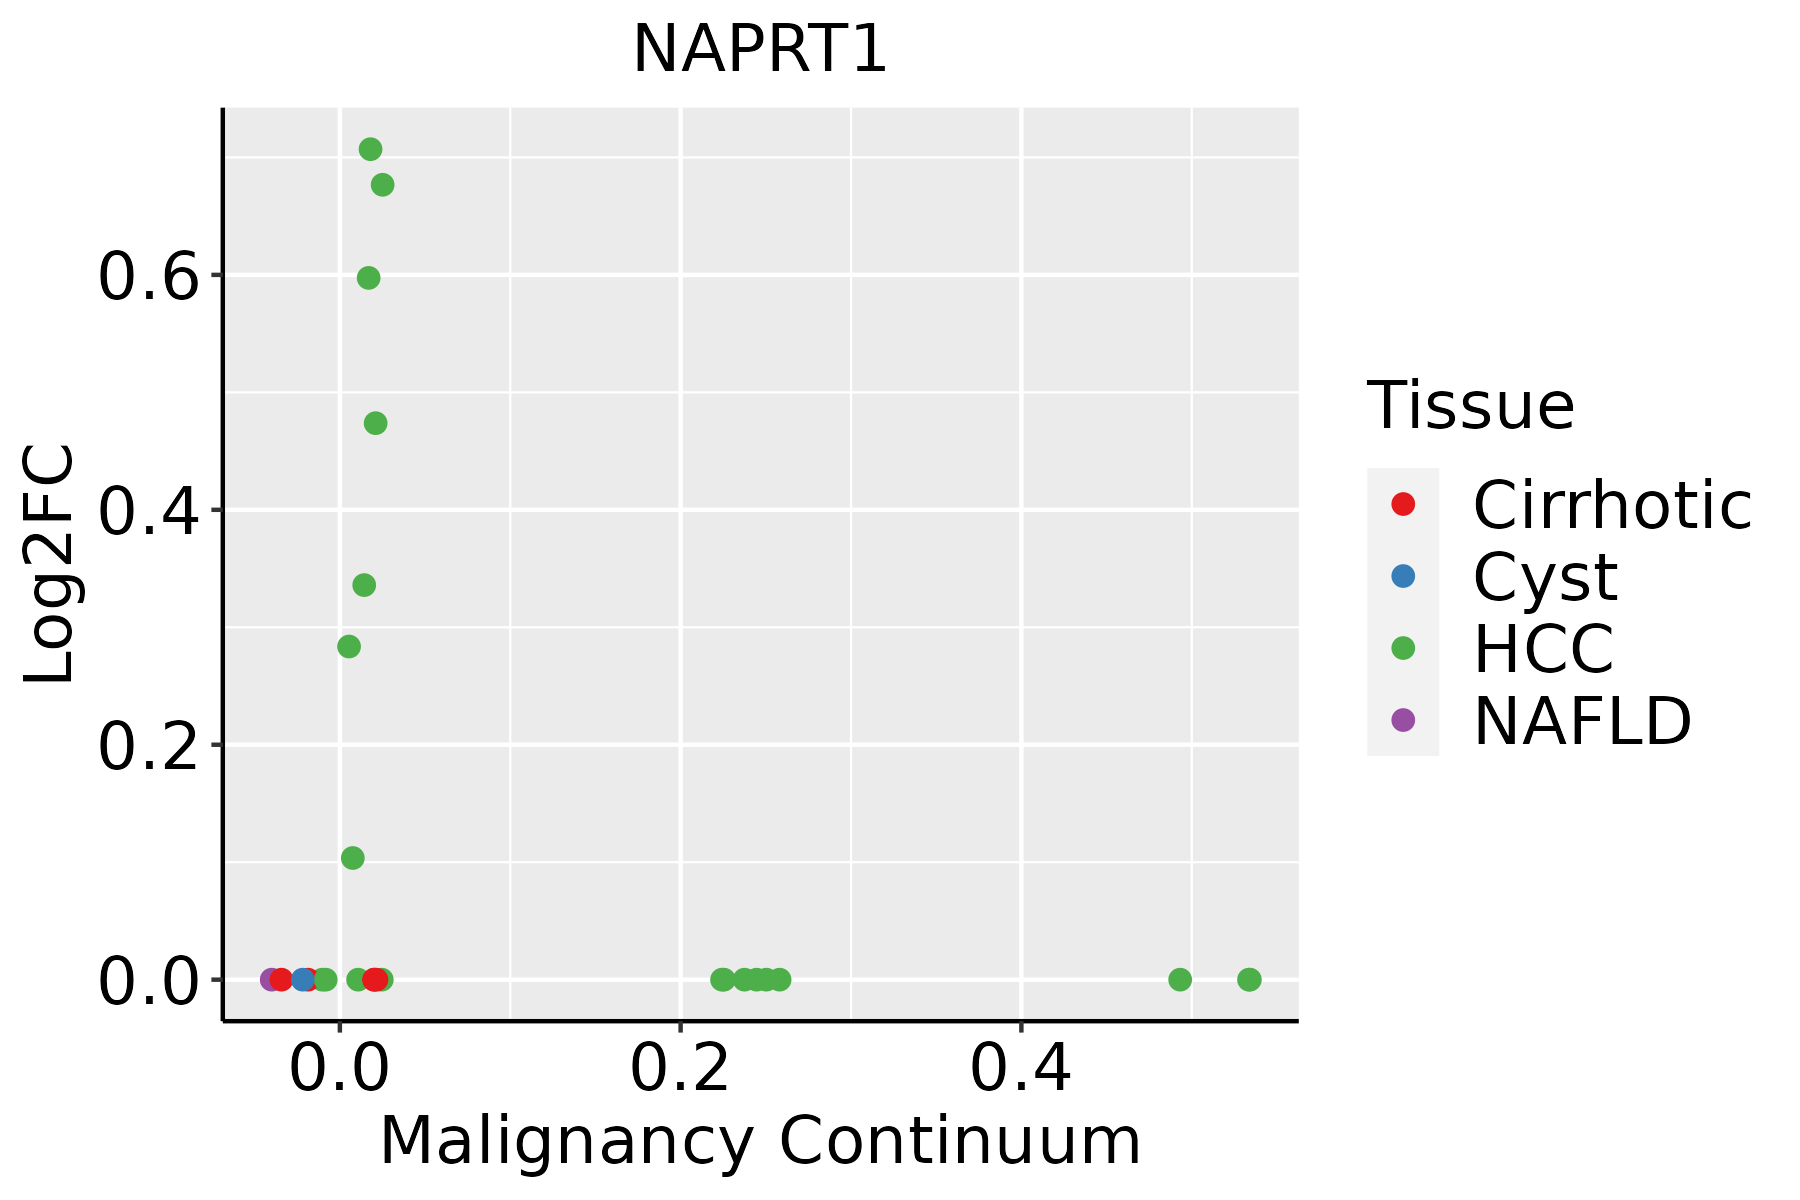 | HCC: Hepatocellular carcinoma |
| NAFLD: Non-alcoholic fatty liver disease | ||
| Skin |  | AK: Actinic keratosis |
| cSCC: Cutaneous squamous cell carcinoma | ||
| SCCIS:squamous cell carcinoma in situ |
| ∗log2FC in expression of this searched gene in stem-like cells from each diseased tissue sample relative to stem-like cells in normal samples in each tissue plotted against the malignancy continuum. Samples are colored based on if they are from different disease stage. |
Top |
Malignant transformation related pathway analysis |
| Find out the enriched GO biological processes and KEGG pathways involved in transition from healthy to precancer to cancer |
| Tissue | Disease Stage | Enriched GO biological Processes |
| Colorectum | AD |  |
| Colorectum | SER |  |
| Colorectum | MSS |  |
| Colorectum | MSI-H |  |
| Colorectum | FAP |  |
| ∗Top 15 enriched GO BP terms are showed in the bar plot of each disease state in each tissue. Each row represents a significant GO biological process which is colored according to the -log10(p.adjust). |
| Page: 1 2 3 4 5 6 7 8 9 |
| GO ID | Tissue | Disease Stage | Description | Gene Ratio | Bg Ratio | pvalue | p.adjust | Count |
| Page: 1 |
| Pathway ID | Tissue | Disease Stage | Description | Gene Ratio | Bg Ratio | pvalue | p.adjust | qvalue | Count |
| hsa012405 | Esophagus | ESCC | Biosynthesis of cofactors | 97/4205 | 153/8465 | 3.88e-04 | 1.35e-03 | 6.94e-04 | 97 |
| hsa0124012 | Esophagus | ESCC | Biosynthesis of cofactors | 97/4205 | 153/8465 | 3.88e-04 | 1.35e-03 | 6.94e-04 | 97 |
| hsa01240 | Liver | Cirrhotic | Biosynthesis of cofactors | 66/2530 | 153/8465 | 3.11e-04 | 1.99e-03 | 1.23e-03 | 66 |
| hsa012401 | Liver | Cirrhotic | Biosynthesis of cofactors | 66/2530 | 153/8465 | 3.11e-04 | 1.99e-03 | 1.23e-03 | 66 |
| hsa012402 | Liver | HCC | Biosynthesis of cofactors | 103/4020 | 153/8465 | 4.67e-07 | 5.05e-06 | 2.81e-06 | 103 |
| hsa012403 | Liver | HCC | Biosynthesis of cofactors | 103/4020 | 153/8465 | 4.67e-07 | 5.05e-06 | 2.81e-06 | 103 |
| hsa012404 | Oral cavity | OSCC | Biosynthesis of cofactors | 88/3704 | 153/8465 | 3.84e-04 | 1.20e-03 | 6.12e-04 | 88 |
| hsa0124011 | Oral cavity | OSCC | Biosynthesis of cofactors | 88/3704 | 153/8465 | 3.84e-04 | 1.20e-03 | 6.12e-04 | 88 |
| hsa0124021 | Oral cavity | LP | Biosynthesis of cofactors | 57/2418 | 153/8465 | 1.17e-02 | 3.91e-02 | 2.52e-02 | 57 |
| hsa0124031 | Oral cavity | LP | Biosynthesis of cofactors | 57/2418 | 153/8465 | 1.17e-02 | 3.91e-02 | 2.52e-02 | 57 |
| Page: 1 |
Top |
Cell-cell communication analysis |
| Identification of potential cell-cell interactions between two cell types and their ligand-receptor pairs for different disease states |
| Ligand | Receptor | LRpair | Pathway | Tissue | Disease Stage |
| Page: 1 |
Top |
Single-cell gene regulatory network inference analysis |
| Find out the significant the regulons (TFs) and the target genes of each regulon across cell types for different disease states |
| TF | Cell Type | Tissue | Disease Stage | Target Gene | RSS | Regulon Activity |
| ∗The dot plots of a searched regulon are shown for all cell subpopulations in each disease state of each tissue based on the regulon specific score inferred using pySCENIC and by calculating the average expression. |
| Page: 1 |
Top |
Somatic mutation of malignant transformation related genes |
| Annotation of somatic variants for genes involved in malignant transformation |
| Hugo Symbol | Variant Class | Variant Classification | dbSNP RS | HGVSc | HGVSp | HGVSp Short | SWISSPROT | BIOTYPE | SIFT | PolyPhen | Tumor Sample Barcode | Tissue | Histology | Sex | Age | Stage | Therapy Types | Drugs | Outcome |
| Page: 1 |
Top |
Related drugs of malignant transformation related genes |
| Identification of chemicals and drugs interact with genes involved in malignant transfromation |
| (DGIdb 4.0) |
| Entrez ID | Symbol | Category | Interaction Types | Drug Claim Name | Drug Name | PMIDs |
| Page: 1 |

Copyright 2023-Present -The University of Texas Health Science Center at Houston |