
|
|||||
|
 | |
| |
| |
| |
| |
| |
|
Gene: NAPRT |
Gene summary for NAPRT |
| Gene information | Species | Human | Gene symbol | NAPRT | Gene ID | 93100 |
| Gene name | nicotinate phosphoribosyltransferase | |
| Gene Alias | NAPRT1 | |
| Cytomap | 8q24.3 | |
| Gene Type | protein-coding | GO ID | GO:0006139 | UniProtAcc | Q6XQN6 |
Top |
Malignant transformation analysis |
| Identification of the aberrant gene expression in precancerous and cancerous lesions by comparing the gene expression of stem-like cells in diseased tissues with normal stem cells |
| Entrez ID | Symbol | Replicates | Species | Organ | Tissue | Adj P-value | Log2FC | Malignancy |
| 93100 | NAPRT | LZE4T | Human | Esophagus | ESCC | 3.87e-17 | 5.93e-01 | 0.0811 |
| 93100 | NAPRT | LZE5T | Human | Esophagus | ESCC | 2.04e-07 | 5.21e-01 | 0.0514 |
| 93100 | NAPRT | LZE7T | Human | Esophagus | ESCC | 1.68e-06 | 2.58e-01 | 0.0667 |
| 93100 | NAPRT | LZE8T | Human | Esophagus | ESCC | 1.04e-05 | 5.77e-02 | 0.067 |
| 93100 | NAPRT | LZE20T | Human | Esophagus | ESCC | 1.00e-11 | 5.08e-01 | 0.0662 |
| 93100 | NAPRT | LZE22D1 | Human | Esophagus | HGIN | 2.25e-07 | 2.00e-01 | 0.0595 |
| 93100 | NAPRT | LZE22T | Human | Esophagus | ESCC | 1.77e-07 | 6.68e-01 | 0.068 |
| 93100 | NAPRT | LZE24T | Human | Esophagus | ESCC | 4.69e-24 | 7.01e-01 | 0.0596 |
| 93100 | NAPRT | LZE21T | Human | Esophagus | ESCC | 2.72e-07 | 9.85e-01 | 0.0655 |
| 93100 | NAPRT | P1T-E | Human | Esophagus | ESCC | 7.20e-20 | 9.23e-01 | 0.0875 |
| 93100 | NAPRT | P2T-E | Human | Esophagus | ESCC | 8.53e-21 | 2.52e-01 | 0.1177 |
| 93100 | NAPRT | P4T-E | Human | Esophagus | ESCC | 1.54e-03 | -2.90e-02 | 0.1323 |
| 93100 | NAPRT | P5T-E | Human | Esophagus | ESCC | 5.66e-18 | 4.06e-01 | 0.1327 |
| 93100 | NAPRT | P8T-E | Human | Esophagus | ESCC | 4.21e-29 | 5.96e-01 | 0.0889 |
| 93100 | NAPRT | P9T-E | Human | Esophagus | ESCC | 5.29e-39 | 9.74e-01 | 0.1131 |
| 93100 | NAPRT | P10T-E | Human | Esophagus | ESCC | 1.47e-30 | 5.30e-01 | 0.116 |
| 93100 | NAPRT | P11T-E | Human | Esophagus | ESCC | 1.22e-22 | 1.39e+00 | 0.1426 |
| 93100 | NAPRT | P15T-E | Human | Esophagus | ESCC | 1.41e-23 | 4.34e-01 | 0.1149 |
| 93100 | NAPRT | P16T-E | Human | Esophagus | ESCC | 1.62e-23 | 3.08e-01 | 0.1153 |
| 93100 | NAPRT | P17T-E | Human | Esophagus | ESCC | 7.59e-04 | 1.29e-01 | 0.1278 |
| Page: 1 2 3 4 5 6 7 |
| Tissue | Expression Dynamics | Abbreviation |
| Esophagus | 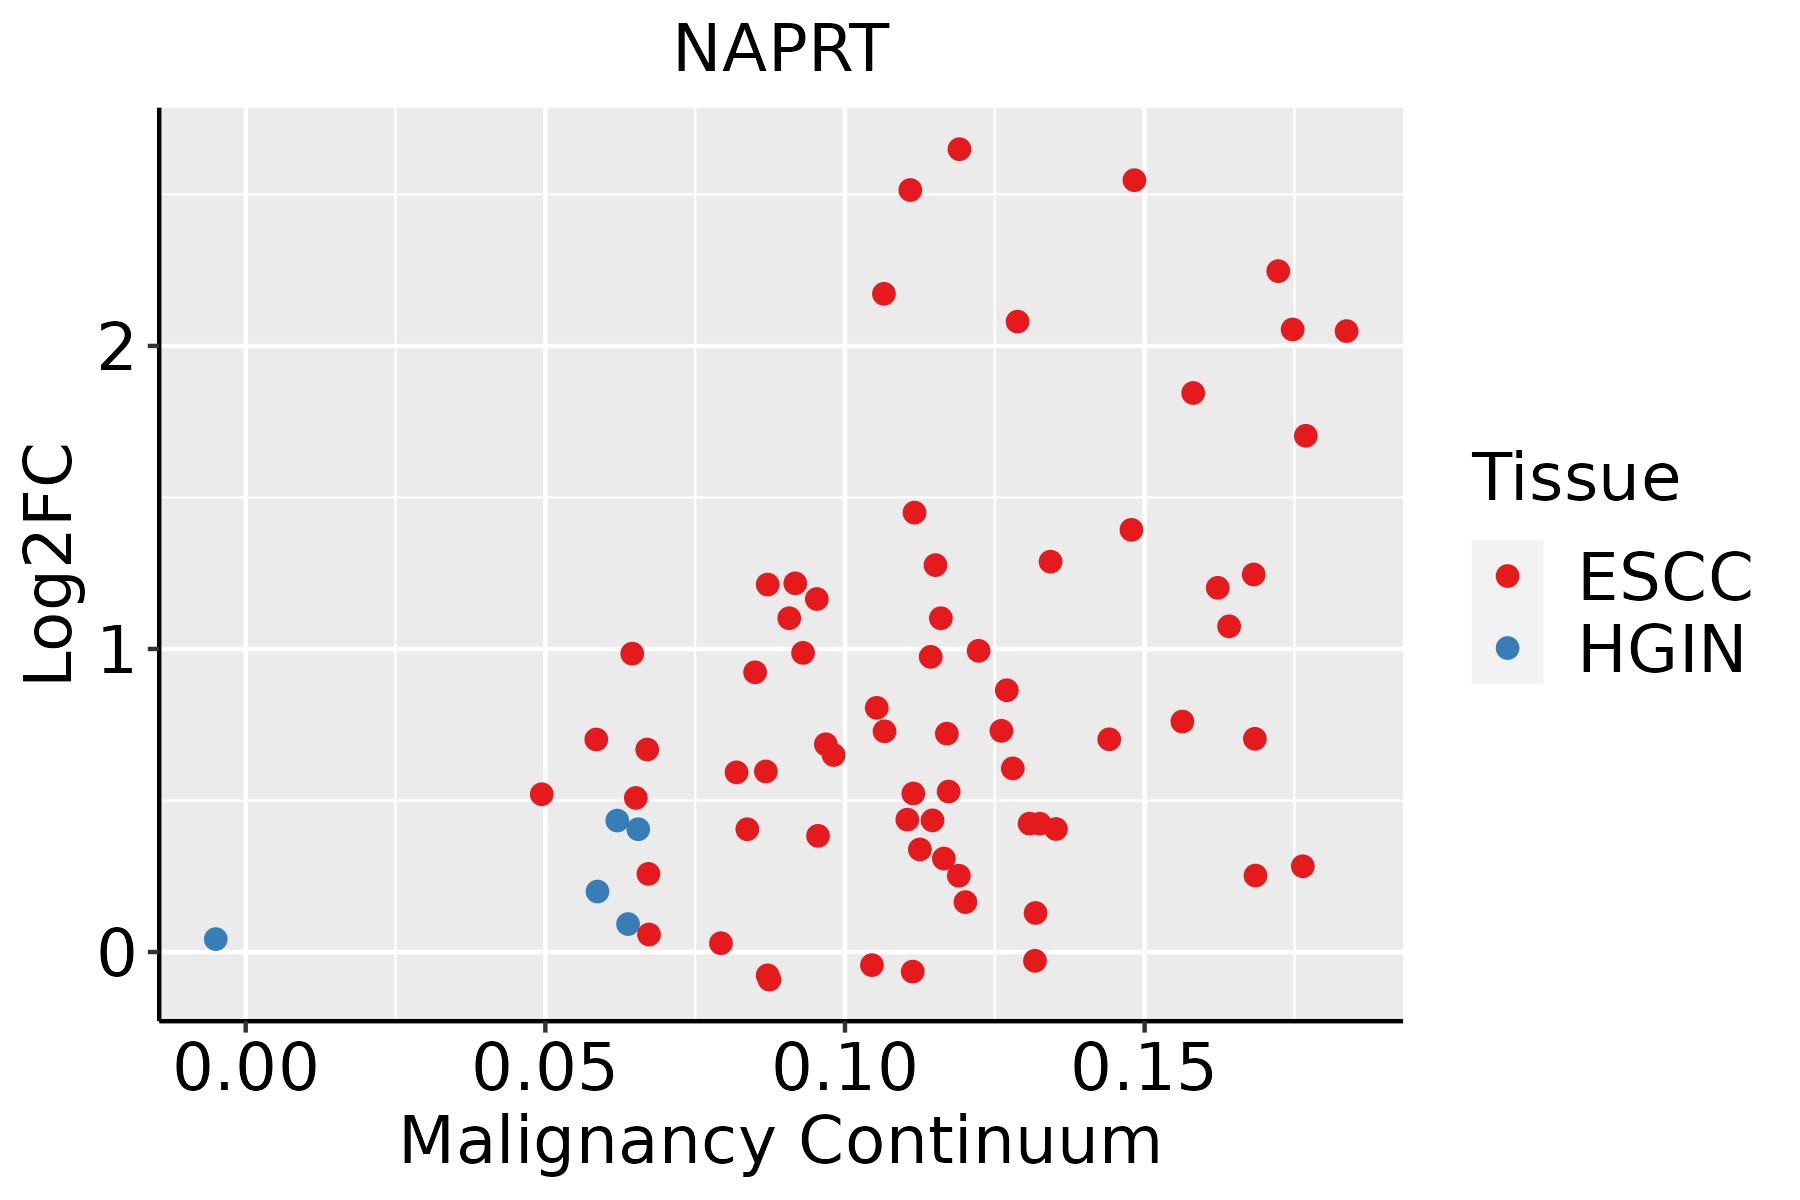 | ESCC: Esophageal squamous cell carcinoma |
| HGIN: High-grade intraepithelial neoplasias | ||
| LGIN: Low-grade intraepithelial neoplasias | ||
| GC | 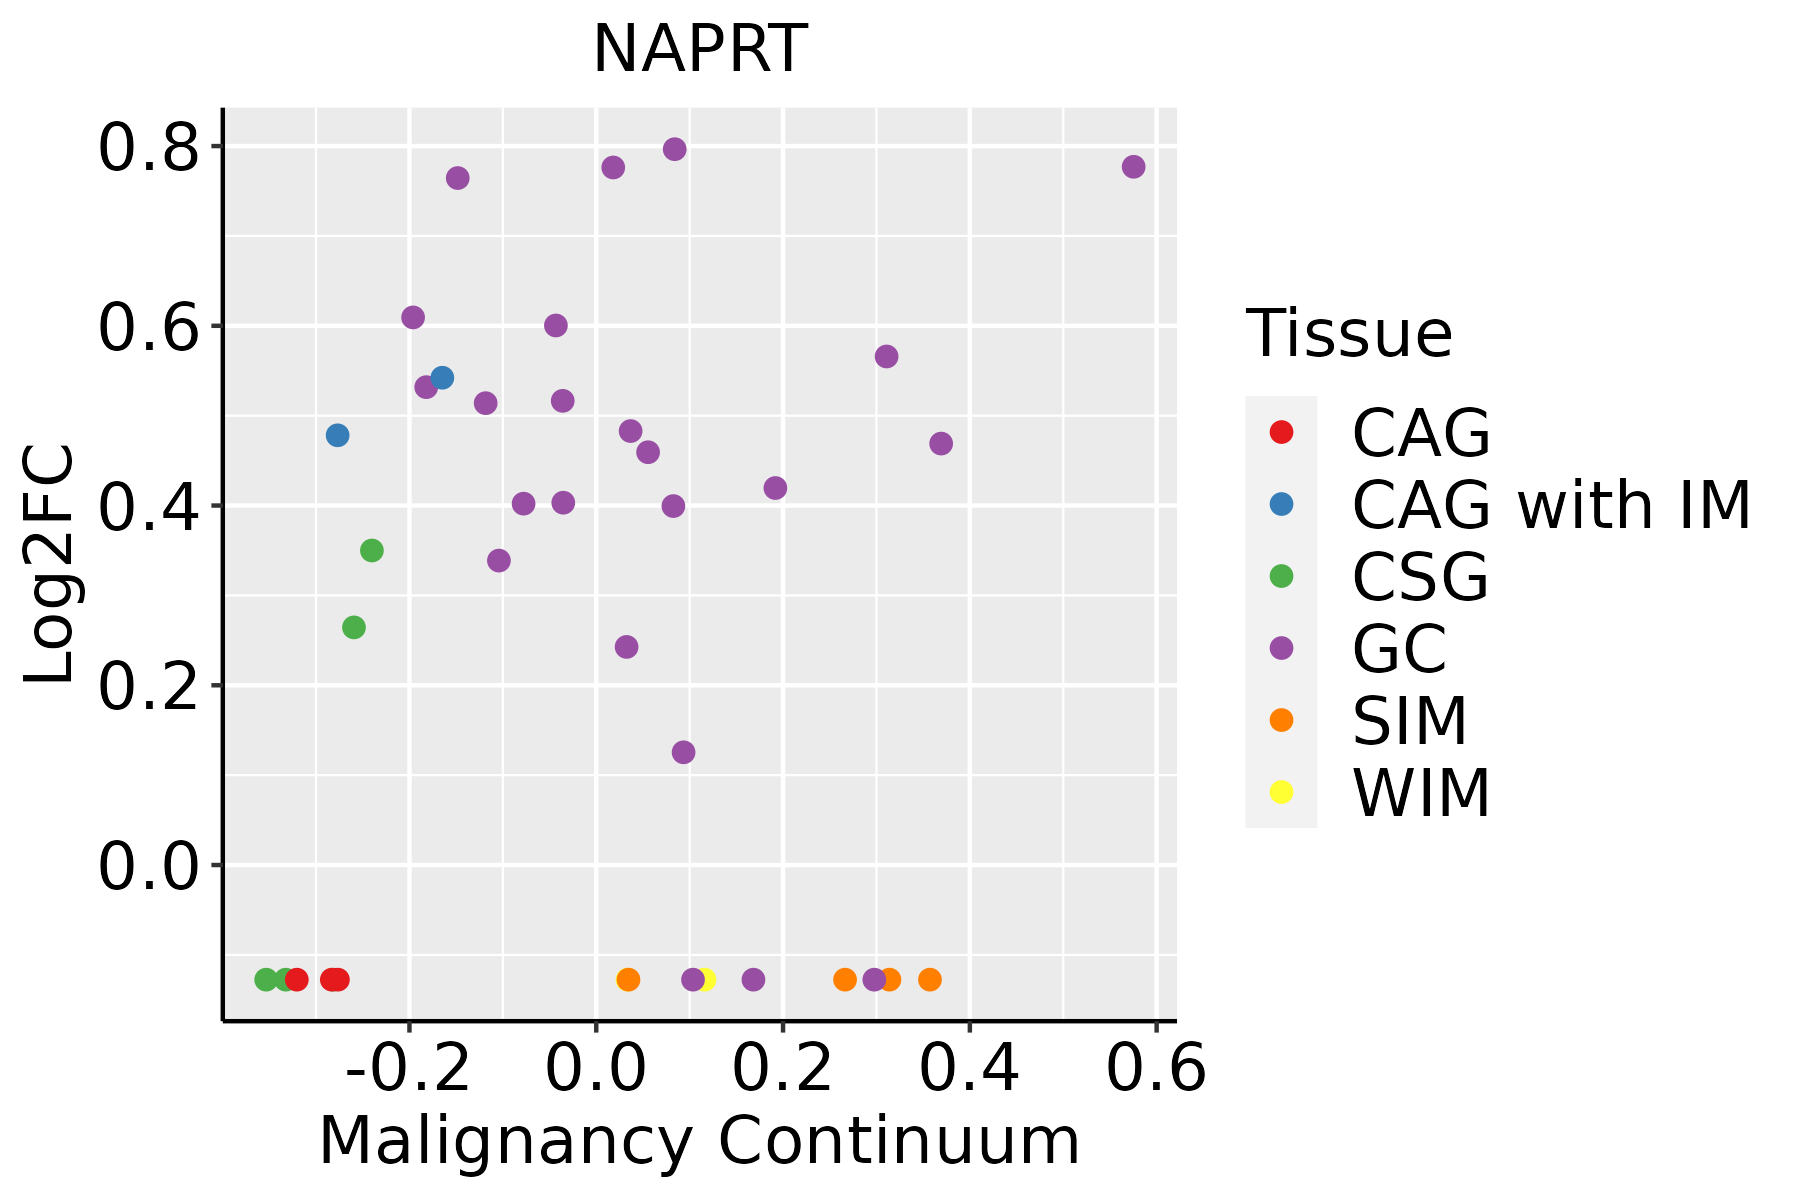 | CAG: Chronic atrophic gastritis |
| CAG with IM: Chronic atrophic gastritis with intestinal metaplasia | ||
| CSG: Chronic superficial gastritis | ||
| GC: Gastric cancer | ||
| SIM: Severe intestinal metaplasia | ||
| WIM: Wild intestinal metaplasia | ||
| Liver | 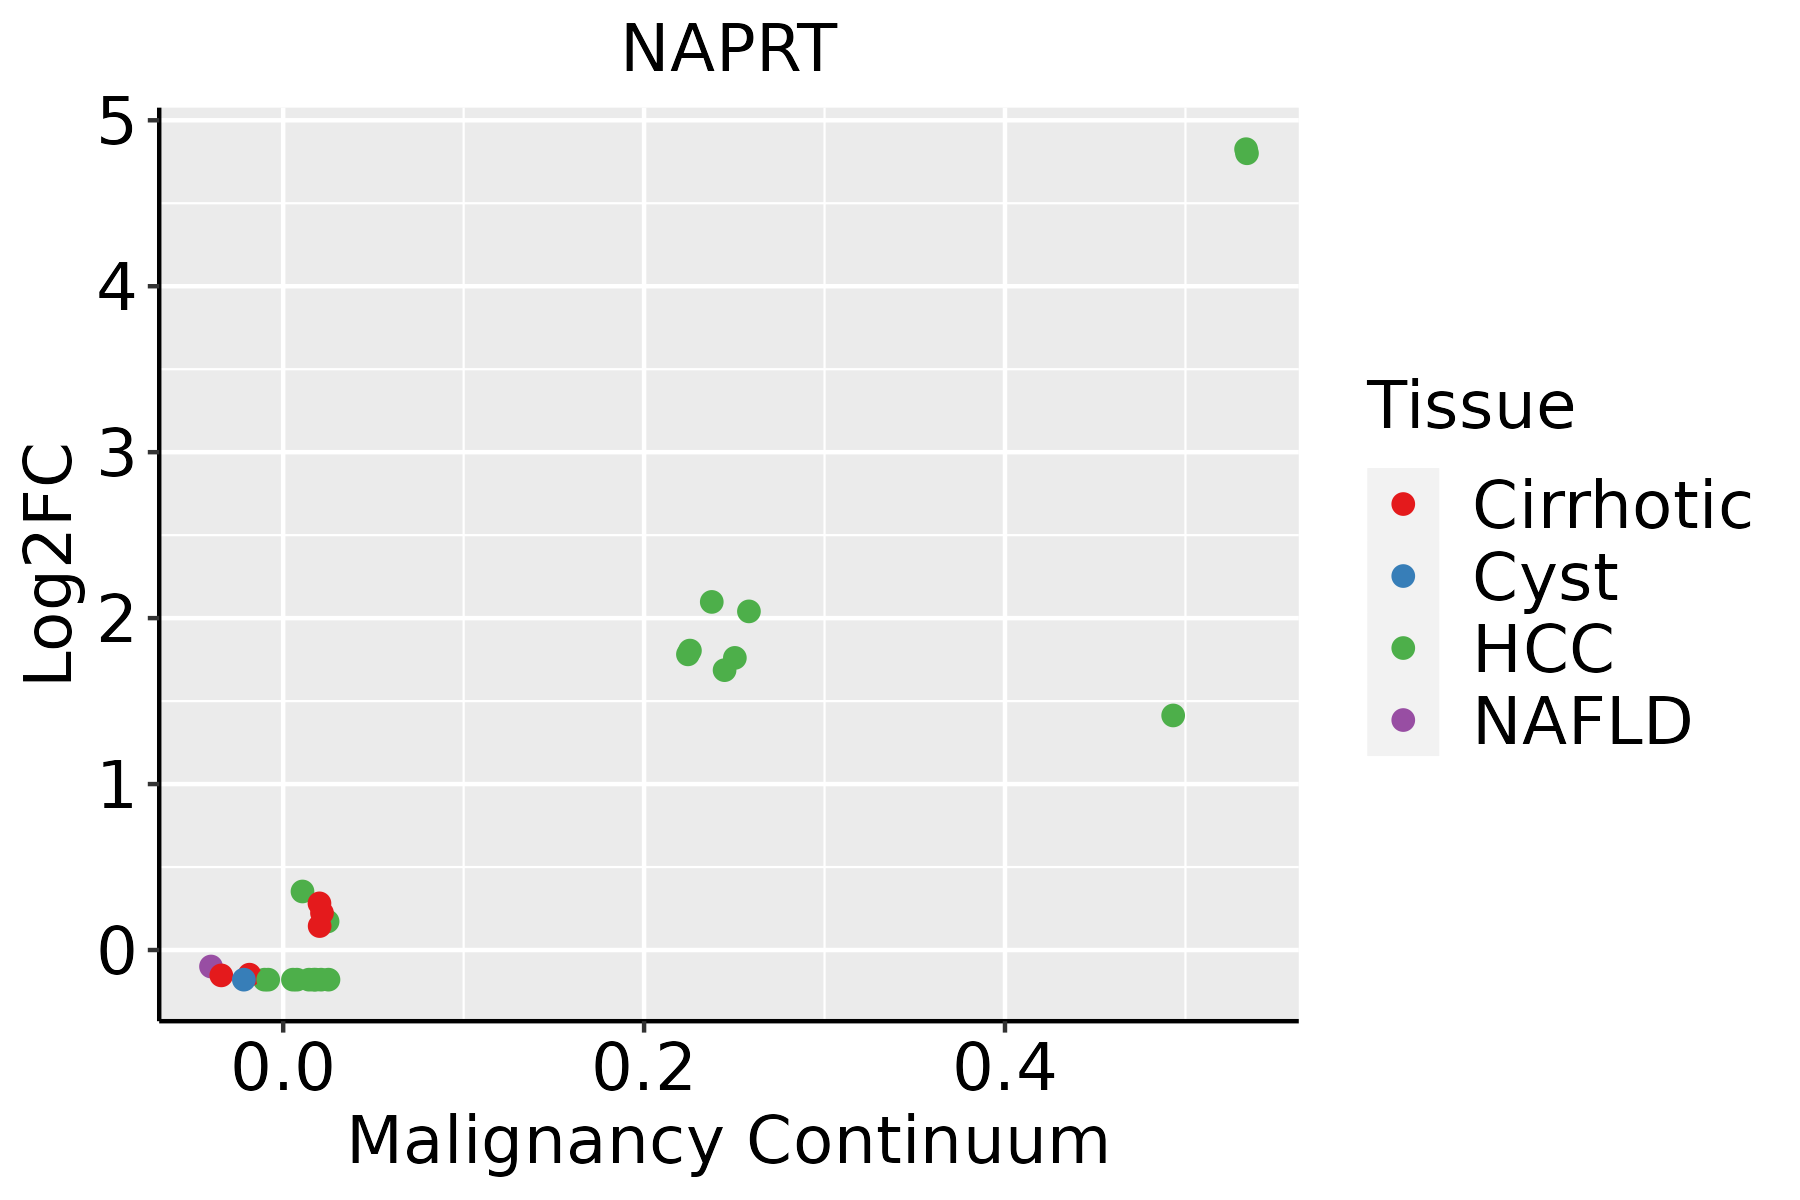 | HCC: Hepatocellular carcinoma |
| NAFLD: Non-alcoholic fatty liver disease | ||
| Oral Cavity | 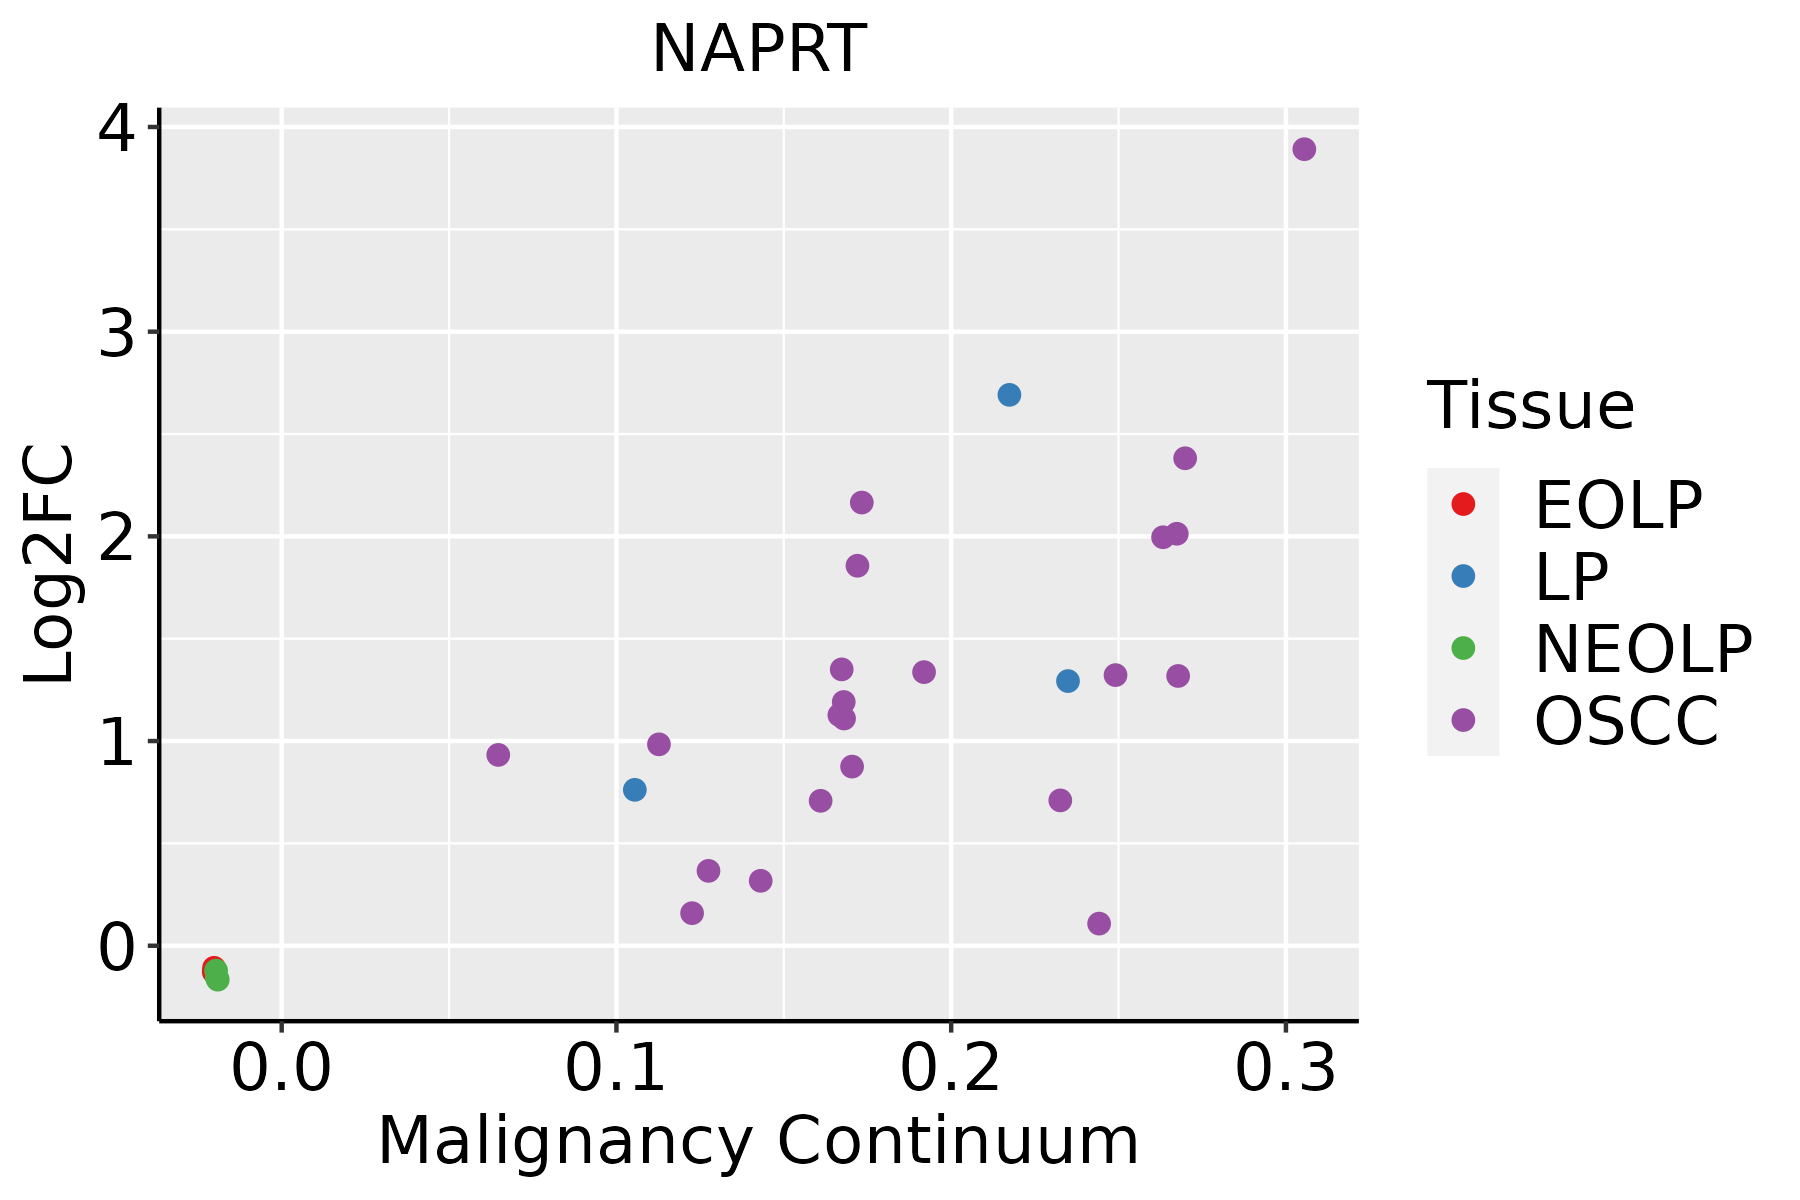 | EOLP: Erosive Oral lichen planus |
| LP: leukoplakia | ||
| NEOLP: Non-erosive oral lichen planus | ||
| OSCC: Oral squamous cell carcinoma | ||
| Thyroid | 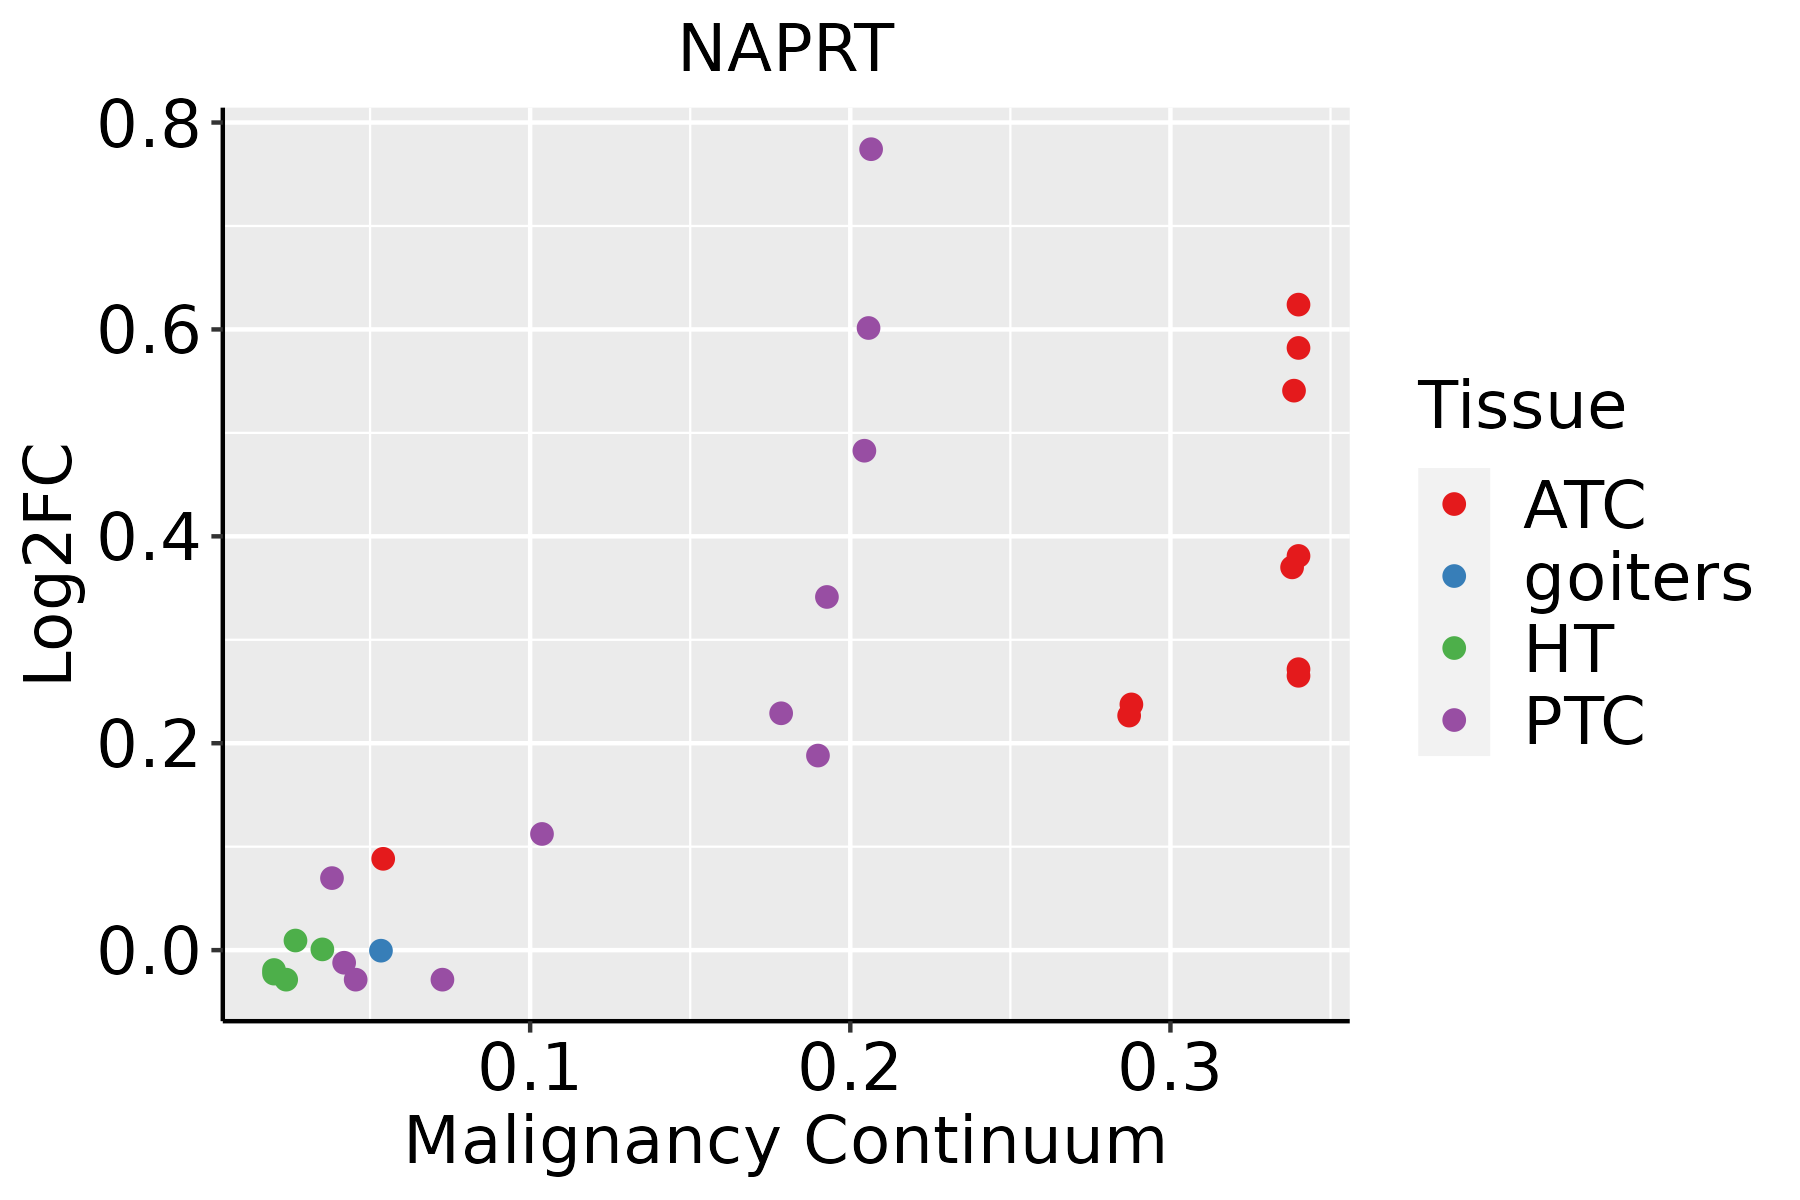 | ATC: Anaplastic thyroid cancer |
| HT: Hashimoto's thyroiditis | ||
| PTC: Papillary thyroid cancer |
| ∗log2FC in expression of this searched gene in stem-like cells from each diseased tissue sample relative to stem-like cells in normal samples in each tissue plotted against the malignancy continuum. Samples are colored based on if they are from different disease stage. |
Top |
Malignant transformation related pathway analysis |
| Find out the enriched GO biological processes and KEGG pathways involved in transition from healthy to precancer to cancer |
| Tissue | Disease Stage | Enriched GO biological Processes |
| Colorectum | AD |  |
| Colorectum | SER |  |
| Colorectum | MSS |  |
| Colorectum | MSI-H |  |
| Colorectum | FAP |  |
| ∗Top 15 enriched GO BP terms are showed in the bar plot of each disease state in each tissue. Each row represents a significant GO biological process which is colored according to the -log10(p.adjust). |
| Page: 1 2 3 4 5 6 7 8 9 |
| GO ID | Tissue | Disease Stage | Description | Gene Ratio | Bg Ratio | pvalue | p.adjust | Count |
| GO:000697927 | Esophagus | HGIN | response to oxidative stress | 107/2587 | 446/18723 | 3.91e-09 | 2.76e-07 | 107 |
| GO:000911720 | Esophagus | HGIN | nucleotide metabolic process | 92/2587 | 489/18723 | 1.11e-03 | 1.36e-02 | 92 |
| GO:00091659 | Esophagus | HGIN | nucleotide biosynthetic process | 53/2587 | 254/18723 | 1.24e-03 | 1.49e-02 | 53 |
| GO:000675320 | Esophagus | HGIN | nucleoside phosphate metabolic process | 93/2587 | 497/18723 | 1.25e-03 | 1.49e-02 | 93 |
| GO:19012939 | Esophagus | HGIN | nucleoside phosphate biosynthetic process | 53/2587 | 256/18723 | 1.49e-03 | 1.73e-02 | 53 |
| GO:0006979111 | Esophagus | ESCC | response to oxidative stress | 303/8552 | 446/18723 | 7.15e-22 | 1.30e-19 | 303 |
| GO:0006753110 | Esophagus | ESCC | nucleoside phosphate metabolic process | 288/8552 | 497/18723 | 1.80e-08 | 3.50e-07 | 288 |
| GO:0009117111 | Esophagus | ESCC | nucleotide metabolic process | 282/8552 | 489/18723 | 4.70e-08 | 8.50e-07 | 282 |
| GO:000916516 | Esophagus | ESCC | nucleotide biosynthetic process | 150/8552 | 254/18723 | 1.12e-05 | 1.06e-04 | 150 |
| GO:190129316 | Esophagus | ESCC | nucleoside phosphate biosynthetic process | 151/8552 | 256/18723 | 1.15e-05 | 1.08e-04 | 151 |
| GO:00430941 | Esophagus | ESCC | cellular metabolic compound salvage | 18/8552 | 26/18723 | 1.32e-02 | 4.31e-02 | 18 |
| GO:000697912 | Liver | Cirrhotic | response to oxidative stress | 196/4634 | 446/18723 | 2.80e-19 | 5.86e-17 | 196 |
| GO:000675312 | Liver | Cirrhotic | nucleoside phosphate metabolic process | 190/4634 | 497/18723 | 1.10e-11 | 6.96e-10 | 190 |
| GO:000911712 | Liver | Cirrhotic | nucleotide metabolic process | 187/4634 | 489/18723 | 1.55e-11 | 9.63e-10 | 187 |
| GO:00091654 | Liver | Cirrhotic | nucleotide biosynthetic process | 89/4634 | 254/18723 | 1.45e-04 | 1.40e-03 | 89 |
| GO:19012934 | Liver | Cirrhotic | nucleoside phosphate biosynthetic process | 89/4634 | 256/18723 | 1.97e-04 | 1.82e-03 | 89 |
| GO:000697922 | Liver | HCC | response to oxidative stress | 281/7958 | 446/18723 | 9.75e-19 | 1.24e-16 | 281 |
| GO:000911722 | Liver | HCC | nucleotide metabolic process | 300/7958 | 489/18723 | 1.61e-17 | 1.71e-15 | 300 |
| GO:000675322 | Liver | HCC | nucleoside phosphate metabolic process | 304/7958 | 497/18723 | 1.78e-17 | 1.85e-15 | 304 |
| GO:000916512 | Liver | HCC | nucleotide biosynthetic process | 150/7958 | 254/18723 | 6.79e-08 | 1.40e-06 | 150 |
| Page: 1 2 3 |
| Pathway ID | Tissue | Disease Stage | Description | Gene Ratio | Bg Ratio | pvalue | p.adjust | qvalue | Count |
| hsa012405 | Esophagus | ESCC | Biosynthesis of cofactors | 97/4205 | 153/8465 | 3.88e-04 | 1.35e-03 | 6.94e-04 | 97 |
| hsa0124012 | Esophagus | ESCC | Biosynthesis of cofactors | 97/4205 | 153/8465 | 3.88e-04 | 1.35e-03 | 6.94e-04 | 97 |
| hsa01240 | Liver | Cirrhotic | Biosynthesis of cofactors | 66/2530 | 153/8465 | 3.11e-04 | 1.99e-03 | 1.23e-03 | 66 |
| hsa012401 | Liver | Cirrhotic | Biosynthesis of cofactors | 66/2530 | 153/8465 | 3.11e-04 | 1.99e-03 | 1.23e-03 | 66 |
| hsa012402 | Liver | HCC | Biosynthesis of cofactors | 103/4020 | 153/8465 | 4.67e-07 | 5.05e-06 | 2.81e-06 | 103 |
| hsa012403 | Liver | HCC | Biosynthesis of cofactors | 103/4020 | 153/8465 | 4.67e-07 | 5.05e-06 | 2.81e-06 | 103 |
| hsa012404 | Oral cavity | OSCC | Biosynthesis of cofactors | 88/3704 | 153/8465 | 3.84e-04 | 1.20e-03 | 6.12e-04 | 88 |
| hsa0124011 | Oral cavity | OSCC | Biosynthesis of cofactors | 88/3704 | 153/8465 | 3.84e-04 | 1.20e-03 | 6.12e-04 | 88 |
| hsa0124021 | Oral cavity | LP | Biosynthesis of cofactors | 57/2418 | 153/8465 | 1.17e-02 | 3.91e-02 | 2.52e-02 | 57 |
| hsa0124031 | Oral cavity | LP | Biosynthesis of cofactors | 57/2418 | 153/8465 | 1.17e-02 | 3.91e-02 | 2.52e-02 | 57 |
| Page: 1 |
Top |
Cell-cell communication analysis |
| Identification of potential cell-cell interactions between two cell types and their ligand-receptor pairs for different disease states |
| Ligand | Receptor | LRpair | Pathway | Tissue | Disease Stage |
| Page: 1 |
Top |
Single-cell gene regulatory network inference analysis |
| Find out the significant the regulons (TFs) and the target genes of each regulon across cell types for different disease states |
| TF | Cell Type | Tissue | Disease Stage | Target Gene | RSS | Regulon Activity |
| ∗The dot plots of a searched regulon are shown for all cell subpopulations in each disease state of each tissue based on the regulon specific score inferred using pySCENIC and by calculating the average expression. |
| Page: 1 |
Top |
Somatic mutation of malignant transformation related genes |
| Annotation of somatic variants for genes involved in malignant transformation |
| Hugo Symbol | Variant Class | Variant Classification | dbSNP RS | HGVSc | HGVSp | HGVSp Short | SWISSPROT | BIOTYPE | SIFT | PolyPhen | Tumor Sample Barcode | Tissue | Histology | Sex | Age | Stage | Therapy Types | Drugs | Outcome |
| NAPRT | SNV | Missense_Mutation | c.1325N>G | p.Glu442Gly | p.E442G | Q6XQN6 | protein_coding | tolerated(0.14) | benign(0.13) | TCGA-EW-A1IW-01 | Breast | breast invasive carcinoma | Female | >=65 | I/II | Hormone Therapy | aromasin | SD | |
| NAPRT | SNV | Missense_Mutation | novel | c.1174N>T | p.Gly392Cys | p.G392C | Q6XQN6 | protein_coding | deleterious(0) | probably_damaging(1) | TCGA-OL-A5RW-01 | Breast | breast invasive carcinoma | Female | <65 | I/II | Chemotherapy | adriamycin | CR |
| NAPRT | SNV | Missense_Mutation | rs199590650 | c.1528N>T | p.Arg510Trp | p.R510W | Q6XQN6 | protein_coding | deleterious(0.02) | possibly_damaging(0.72) | TCGA-2W-A8YY-01 | Cervix | cervical & endocervical cancer | Female | <65 | I/II | Chemotherapy | cisplatin | CR |
| NAPRT | SNV | Missense_Mutation | novel | c.1324N>C | p.Glu442Gln | p.E442Q | Q6XQN6 | protein_coding | tolerated(0.14) | benign(0.236) | TCGA-JW-A5VL-01 | Cervix | cervical & endocervical cancer | Female | <65 | I/II | Unknown | Unknown | SD |
| NAPRT | SNV | Missense_Mutation | rs780656692 | c.514N>T | p.Arg172Trp | p.R172W | Q6XQN6 | protein_coding | deleterious(0) | probably_damaging(0.998) | TCGA-AA-3947-01 | Colorectum | colon adenocarcinoma | Female | <65 | I/II | Unknown | Unknown | SD |
| NAPRT | SNV | Missense_Mutation | c.1169N>T | p.Ser390Phe | p.S390F | Q6XQN6 | protein_coding | deleterious(0.02) | probably_damaging(0.987) | TCGA-AZ-4614-01 | Colorectum | colon adenocarcinoma | Female | >=65 | I/II | Unknown | Unknown | PD | |
| NAPRT | deletion | Frame_Shift_Del | c.1205delG | p.Gly402AlafsTer5 | p.G402Afs*5 | Q6XQN6 | protein_coding | TCGA-F4-6856-01 | Colorectum | colon adenocarcinoma | Male | <65 | I/II | Ancillary | leucovorin | CR | |||
| NAPRT | SNV | Missense_Mutation | rs373219862 | c.667N>A | p.Glu223Lys | p.E223K | Q6XQN6 | protein_coding | tolerated(0.05) | possibly_damaging(0.535) | TCGA-A5-A0G1-01 | Endometrium | uterine corpus endometrioid carcinoma | Female | >=65 | I/II | Unknown | Unknown | SD |
| NAPRT | SNV | Missense_Mutation | rs369217099 | c.1078G>A | p.Glu360Lys | p.E360K | Q6XQN6 | protein_coding | deleterious(0) | probably_damaging(0.985) | TCGA-A5-A2K5-01 | Endometrium | uterine corpus endometrioid carcinoma | Female | >=65 | I/II | Unknown | Unknown | SD |
| NAPRT | SNV | Missense_Mutation | c.1579N>T | p.Ala527Ser | p.A527S | Q6XQN6 | protein_coding | tolerated(0.7) | benign(0.006) | TCGA-B5-A11E-01 | Endometrium | uterine corpus endometrioid carcinoma | Female | <65 | I/II | Unknown | Unknown | SD |
| Page: 1 2 3 |
Top |
Related drugs of malignant transformation related genes |
| Identification of chemicals and drugs interact with genes involved in malignant transfromation |
| (DGIdb 4.0) |
| Entrez ID | Symbol | Category | Interaction Types | Drug Claim Name | Drug Name | PMIDs |
| 93100 | NAPRT | NA | GNE-617 | 24097869 |
| Page: 1 |

Copyright 2023-Present -The University of Texas Health Science Center at Houston |