
|
|||||
|
 | |
| |
| |
| |
| |
| |
|
Gene: NAPG |
Gene summary for NAPG |
| Gene information | Species | Human | Gene symbol | NAPG | Gene ID | 8774 |
| Gene name | NSF attachment protein gamma | |
| Gene Alias | GAMMASNAP | |
| Cytomap | 18p11.22 | |
| Gene Type | protein-coding | GO ID | GO:0006810 | UniProtAcc | Q6FHY4 |
Top |
Malignant transformation analysis |
| Identification of the aberrant gene expression in precancerous and cancerous lesions by comparing the gene expression of stem-like cells in diseased tissues with normal stem cells |
| Entrez ID | Symbol | Replicates | Species | Organ | Tissue | Adj P-value | Log2FC | Malignancy |
| 8774 | NAPG | LZE2T | Human | Esophagus | ESCC | 3.39e-12 | 7.05e-01 | 0.082 |
| 8774 | NAPG | LZE4T | Human | Esophagus | ESCC | 2.07e-10 | 3.07e-01 | 0.0811 |
| 8774 | NAPG | LZE7T | Human | Esophagus | ESCC | 9.30e-04 | 3.26e-01 | 0.0667 |
| 8774 | NAPG | LZE8T | Human | Esophagus | ESCC | 3.91e-02 | 1.28e-01 | 0.067 |
| 8774 | NAPG | LZE20T | Human | Esophagus | ESCC | 2.68e-04 | 2.09e-01 | 0.0662 |
| 8774 | NAPG | LZE24T | Human | Esophagus | ESCC | 1.40e-18 | 4.17e-01 | 0.0596 |
| 8774 | NAPG | LZE21T | Human | Esophagus | ESCC | 1.26e-06 | 2.93e-01 | 0.0655 |
| 8774 | NAPG | LZE6T | Human | Esophagus | ESCC | 6.78e-03 | 8.27e-02 | 0.0845 |
| 8774 | NAPG | P1T-E | Human | Esophagus | ESCC | 2.13e-09 | 4.83e-01 | 0.0875 |
| 8774 | NAPG | P2T-E | Human | Esophagus | ESCC | 1.06e-27 | 4.24e-01 | 0.1177 |
| 8774 | NAPG | P4T-E | Human | Esophagus | ESCC | 6.72e-39 | 7.97e-01 | 0.1323 |
| 8774 | NAPG | P5T-E | Human | Esophagus | ESCC | 2.38e-47 | 8.72e-01 | 0.1327 |
| 8774 | NAPG | P8T-E | Human | Esophagus | ESCC | 4.88e-27 | 3.88e-01 | 0.0889 |
| 8774 | NAPG | P9T-E | Human | Esophagus | ESCC | 1.76e-18 | 4.11e-01 | 0.1131 |
| 8774 | NAPG | P10T-E | Human | Esophagus | ESCC | 2.38e-20 | 3.82e-01 | 0.116 |
| 8774 | NAPG | P11T-E | Human | Esophagus | ESCC | 6.28e-10 | 5.68e-01 | 0.1426 |
| 8774 | NAPG | P12T-E | Human | Esophagus | ESCC | 7.70e-31 | 5.56e-01 | 0.1122 |
| 8774 | NAPG | P15T-E | Human | Esophagus | ESCC | 1.00e-32 | 6.09e-01 | 0.1149 |
| 8774 | NAPG | P16T-E | Human | Esophagus | ESCC | 1.15e-14 | 2.83e-01 | 0.1153 |
| 8774 | NAPG | P17T-E | Human | Esophagus | ESCC | 3.07e-15 | 4.49e-01 | 0.1278 |
| Page: 1 2 3 4 5 6 |
| Tissue | Expression Dynamics | Abbreviation |
| Esophagus |  | ESCC: Esophageal squamous cell carcinoma |
| HGIN: High-grade intraepithelial neoplasias | ||
| LGIN: Low-grade intraepithelial neoplasias | ||
| Liver | 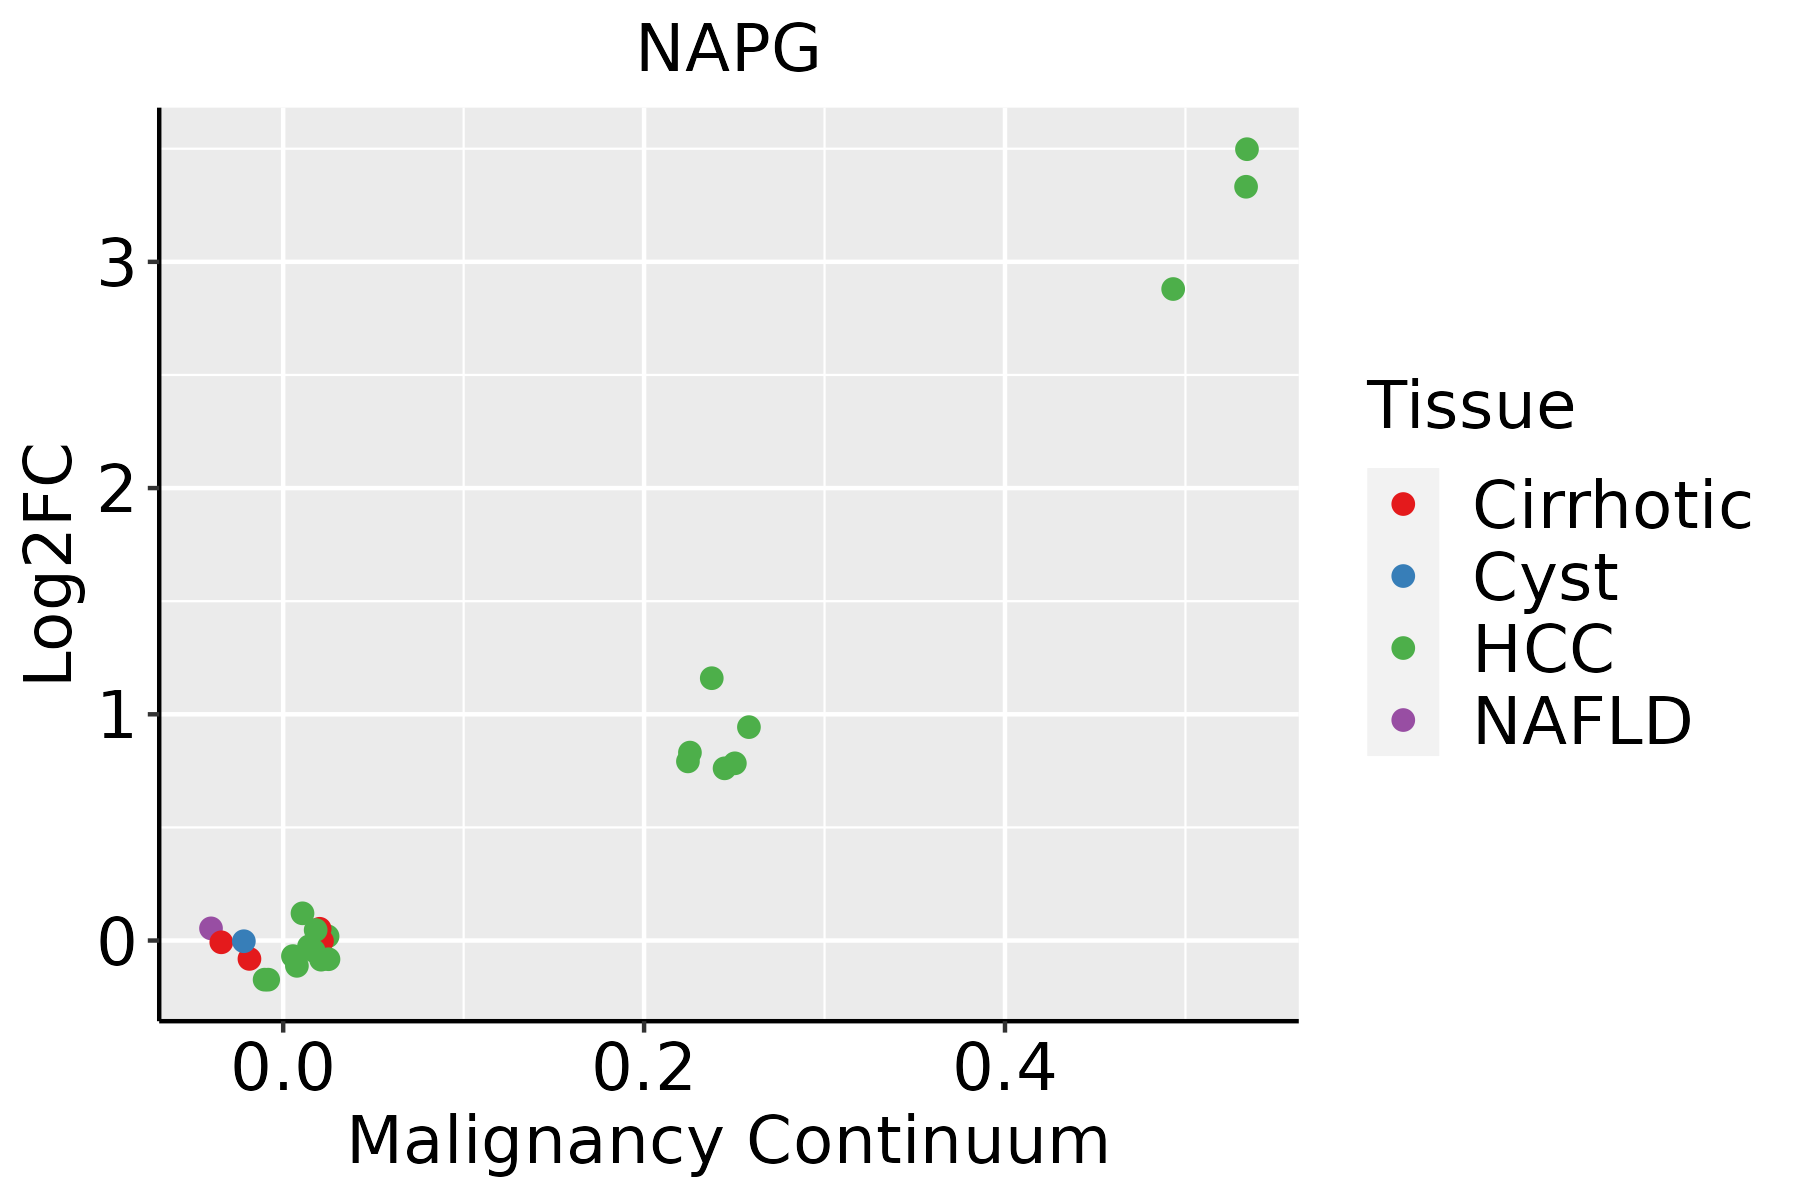 | HCC: Hepatocellular carcinoma |
| NAFLD: Non-alcoholic fatty liver disease | ||
| Oral Cavity |  | EOLP: Erosive Oral lichen planus |
| LP: leukoplakia | ||
| NEOLP: Non-erosive oral lichen planus | ||
| OSCC: Oral squamous cell carcinoma | ||
| Skin | 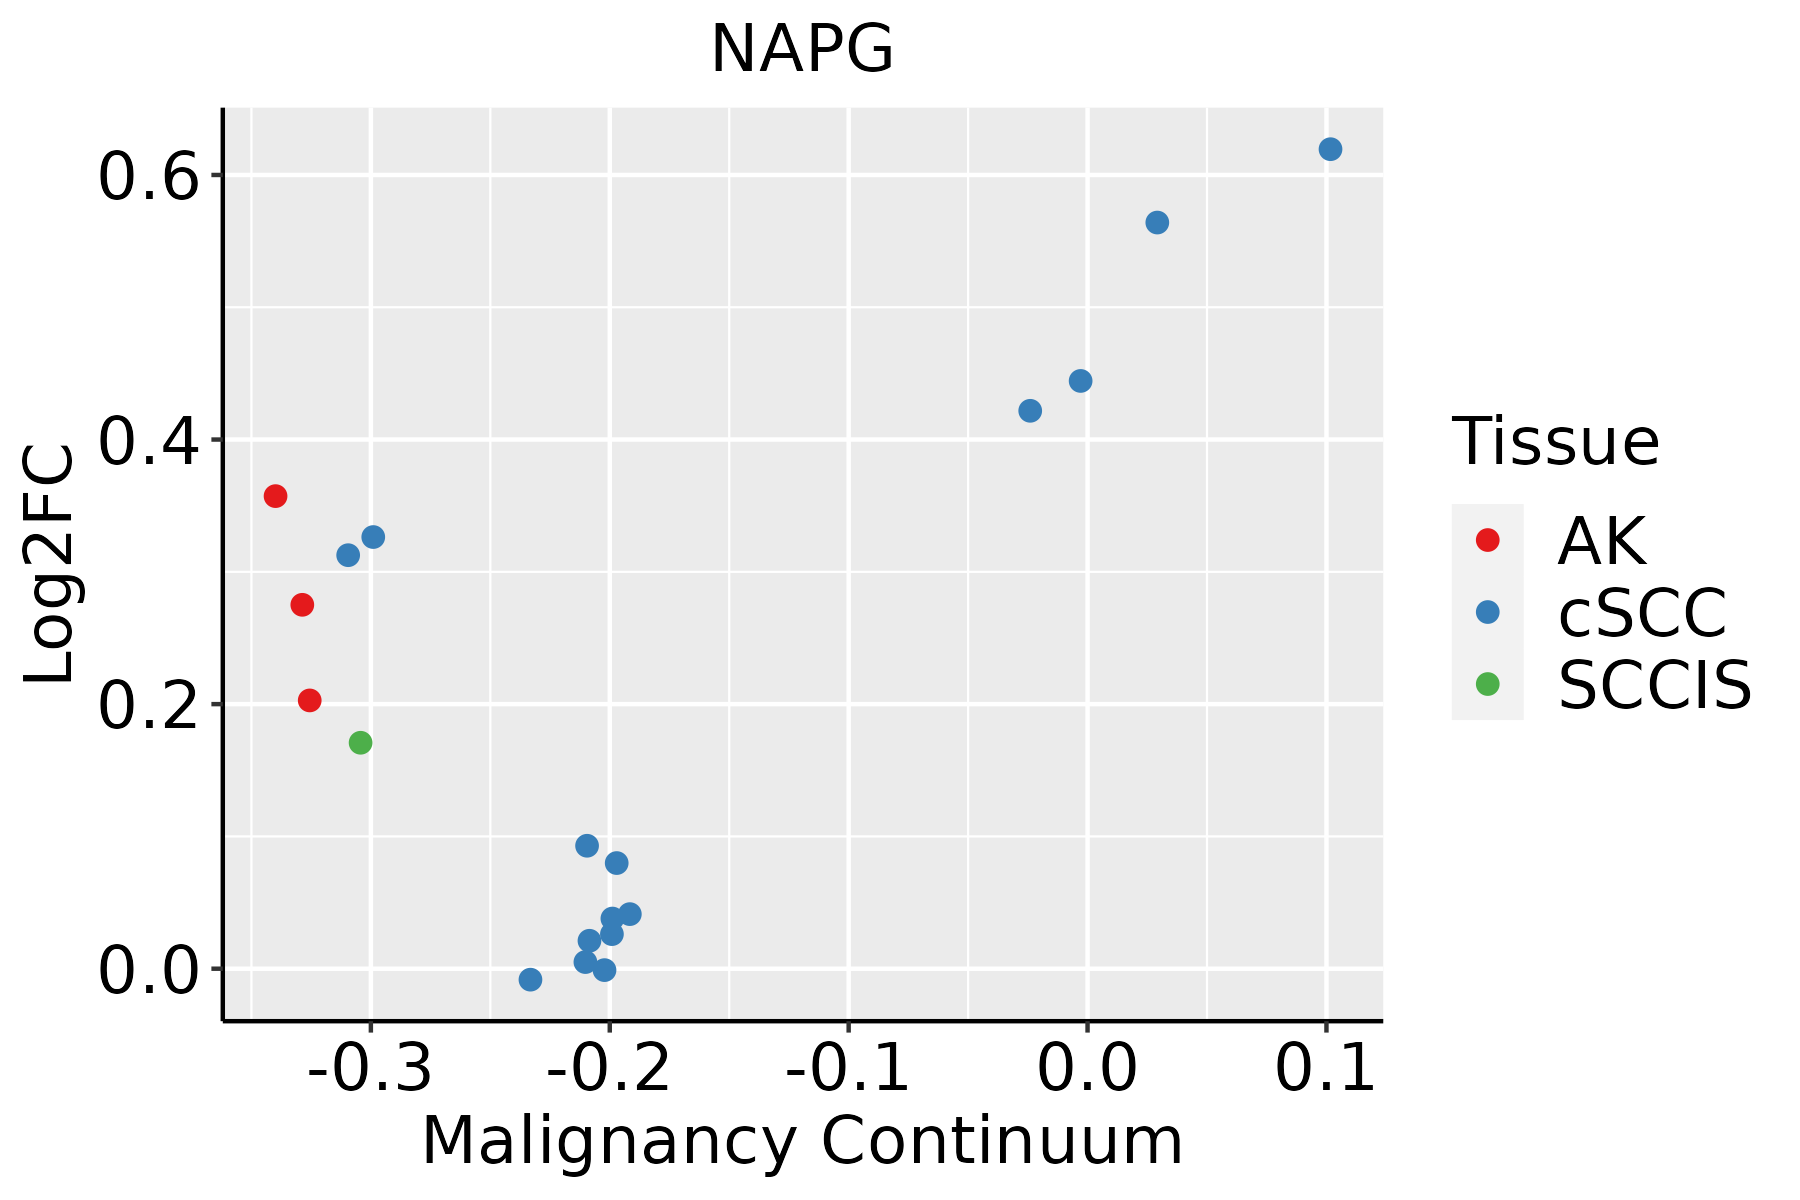 | AK: Actinic keratosis |
| cSCC: Cutaneous squamous cell carcinoma | ||
| SCCIS:squamous cell carcinoma in situ | ||
| Thyroid | 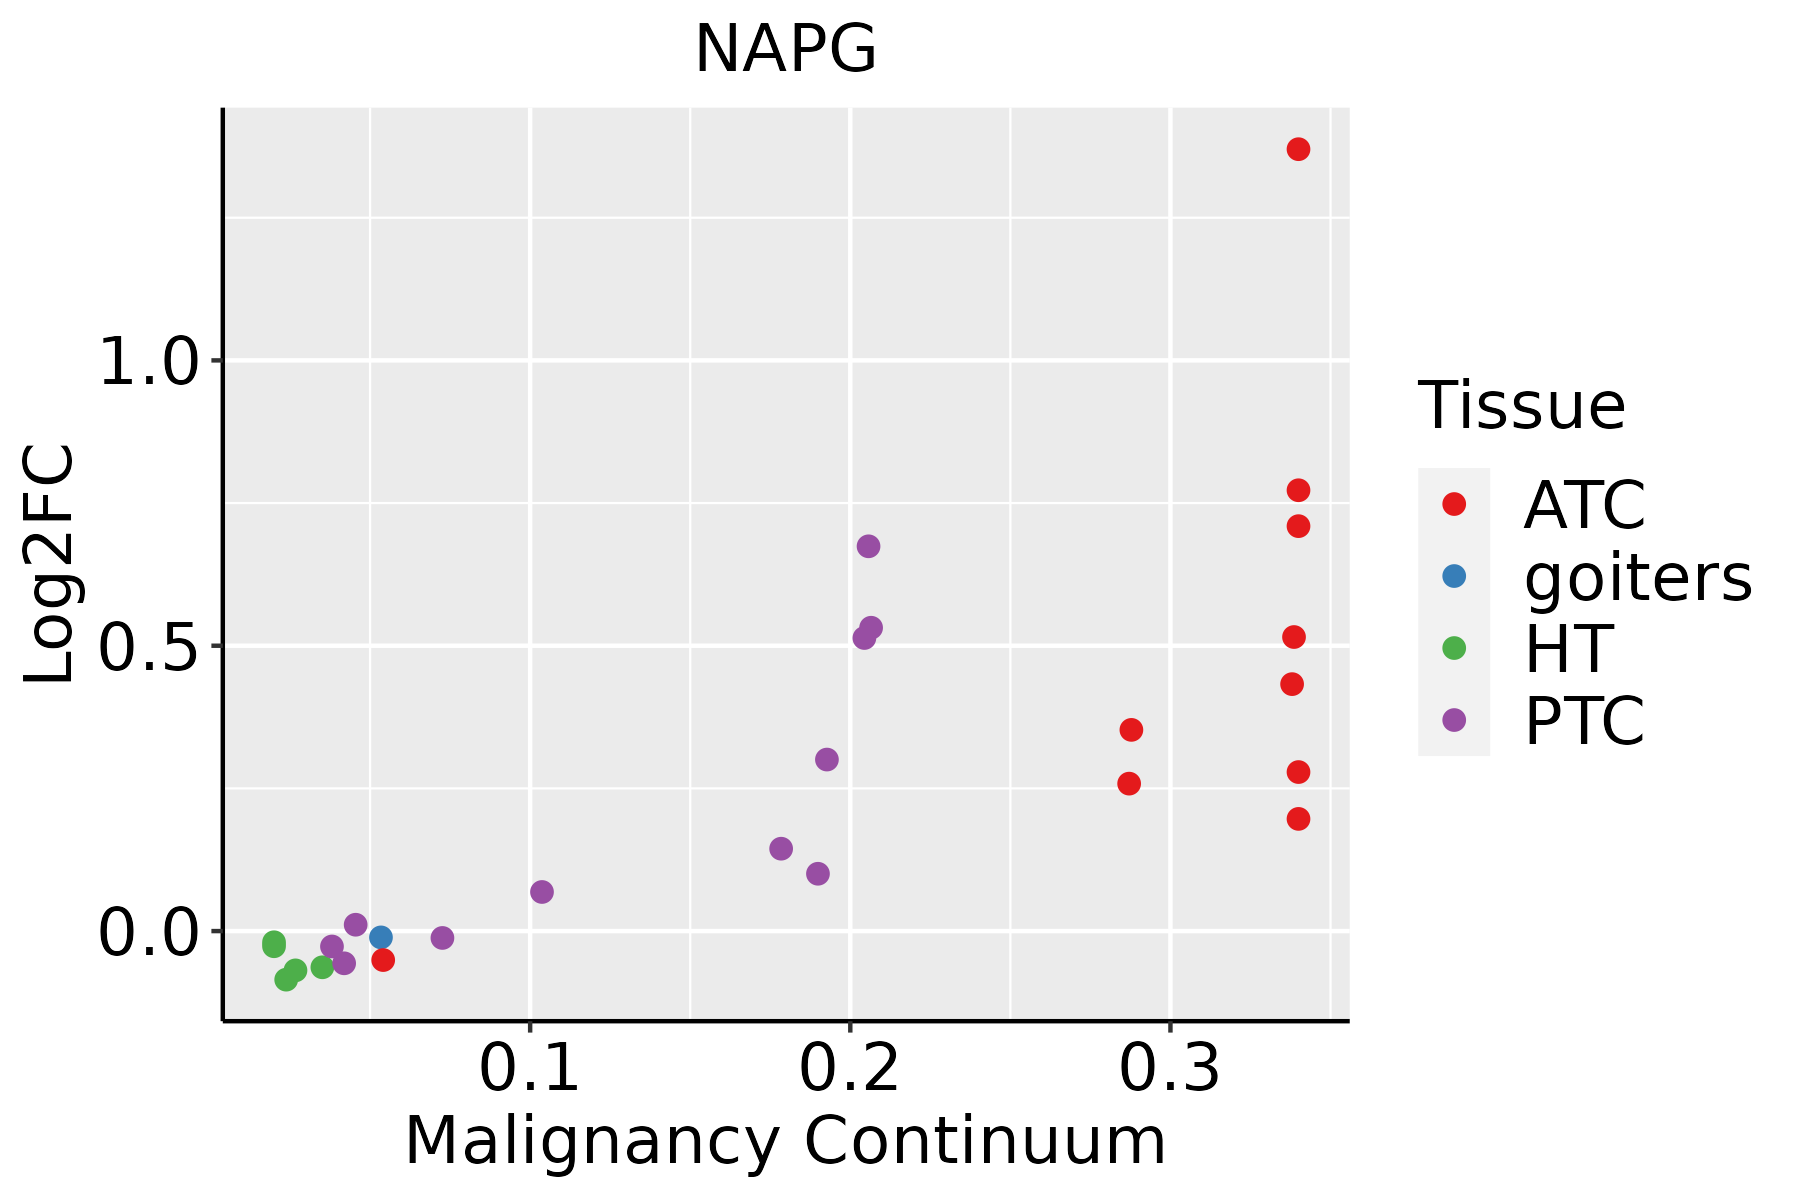 | ATC: Anaplastic thyroid cancer |
| HT: Hashimoto's thyroiditis | ||
| PTC: Papillary thyroid cancer |
| ∗log2FC in expression of this searched gene in stem-like cells from each diseased tissue sample relative to stem-like cells in normal samples in each tissue plotted against the malignancy continuum. Samples are colored based on if they are from different disease stage. |
Top |
Malignant transformation related pathway analysis |
| Find out the enriched GO biological processes and KEGG pathways involved in transition from healthy to precancer to cancer |
| Tissue | Disease Stage | Enriched GO biological Processes |
| Colorectum | AD |  |
| Colorectum | SER |  |
| Colorectum | MSS |  |
| Colorectum | MSI-H |  |
| Colorectum | FAP |  |
| ∗Top 15 enriched GO BP terms are showed in the bar plot of each disease state in each tissue. Each row represents a significant GO biological process which is colored according to the -log10(p.adjust). |
| Page: 1 2 3 4 5 6 7 8 9 |
| GO ID | Tissue | Disease Stage | Description | Gene Ratio | Bg Ratio | pvalue | p.adjust | Count |
| GO:004819318 | Esophagus | ESCC | Golgi vesicle transport | 231/8552 | 296/18723 | 1.82e-30 | 9.63e-28 | 231 |
| GO:0031647111 | Esophagus | ESCC | regulation of protein stability | 223/8552 | 298/18723 | 5.76e-25 | 1.52e-22 | 223 |
| GO:0050821111 | Esophagus | ESCC | protein stabilization | 140/8552 | 191/18723 | 6.50e-15 | 3.61e-13 | 140 |
| GO:00068914 | Esophagus | ESCC | intra-Golgi vesicle-mediated transport | 26/8552 | 33/18723 | 1.06e-04 | 7.43e-04 | 26 |
| GO:00610254 | Esophagus | ESCC | membrane fusion | 98/8552 | 163/18723 | 1.39e-04 | 9.41e-04 | 98 |
| GO:004819321 | Liver | HCC | Golgi vesicle transport | 217/7958 | 296/18723 | 2.58e-27 | 1.02e-24 | 217 |
| GO:003164722 | Liver | HCC | regulation of protein stability | 211/7958 | 298/18723 | 2.29e-23 | 5.01e-21 | 211 |
| GO:005082122 | Liver | HCC | protein stabilization | 139/7958 | 191/18723 | 1.61e-17 | 1.71e-15 | 139 |
| GO:0061025 | Liver | HCC | membrane fusion | 88/7958 | 163/18723 | 1.98e-03 | 1.00e-02 | 88 |
| GO:0006891 | Liver | HCC | intra-Golgi vesicle-mediated transport | 22/7958 | 33/18723 | 4.38e-03 | 1.90e-02 | 22 |
| GO:004819315 | Oral cavity | OSCC | Golgi vesicle transport | 209/7305 | 296/18723 | 1.39e-28 | 6.30e-26 | 209 |
| GO:003164720 | Oral cavity | OSCC | regulation of protein stability | 193/7305 | 298/18723 | 1.30e-19 | 1.95e-17 | 193 |
| GO:005082120 | Oral cavity | OSCC | protein stabilization | 122/7305 | 191/18723 | 2.69e-12 | 1.09e-10 | 122 |
| GO:00068913 | Oral cavity | OSCC | intra-Golgi vesicle-mediated transport | 23/7305 | 33/18723 | 3.47e-04 | 2.12e-03 | 23 |
| GO:00610253 | Oral cavity | OSCC | membrane fusion | 84/7305 | 163/18723 | 7.56e-04 | 4.12e-03 | 84 |
| GO:003164728 | Skin | AK | regulation of protein stability | 64/1910 | 298/18723 | 5.93e-09 | 4.14e-07 | 64 |
| GO:005082128 | Skin | AK | protein stabilization | 47/1910 | 191/18723 | 7.41e-09 | 4.99e-07 | 47 |
| GO:004819319 | Skin | AK | Golgi vesicle transport | 47/1910 | 296/18723 | 1.46e-03 | 1.06e-02 | 47 |
| GO:00068915 | Skin | AK | intra-Golgi vesicle-mediated transport | 9/1910 | 33/18723 | 4.68e-03 | 2.69e-02 | 9 |
| GO:0048193110 | Skin | cSCC | Golgi vesicle transport | 153/4864 | 296/18723 | 1.85e-21 | 3.41e-19 | 153 |
| Page: 1 2 |
| Pathway ID | Tissue | Disease Stage | Description | Gene Ratio | Bg Ratio | pvalue | p.adjust | qvalue | Count |
| Page: 1 |
Top |
Cell-cell communication analysis |
| Identification of potential cell-cell interactions between two cell types and their ligand-receptor pairs for different disease states |
| Ligand | Receptor | LRpair | Pathway | Tissue | Disease Stage |
| Page: 1 |
Top |
Single-cell gene regulatory network inference analysis |
| Find out the significant the regulons (TFs) and the target genes of each regulon across cell types for different disease states |
| TF | Cell Type | Tissue | Disease Stage | Target Gene | RSS | Regulon Activity |
| ∗The dot plots of a searched regulon are shown for all cell subpopulations in each disease state of each tissue based on the regulon specific score inferred using pySCENIC and by calculating the average expression. |
| Page: 1 |
Top |
Somatic mutation of malignant transformation related genes |
| Annotation of somatic variants for genes involved in malignant transformation |
| Hugo Symbol | Variant Class | Variant Classification | dbSNP RS | HGVSc | HGVSp | HGVSp Short | SWISSPROT | BIOTYPE | SIFT | PolyPhen | Tumor Sample Barcode | Tissue | Histology | Sex | Age | Stage | Therapy Types | Drugs | Outcome |
| NAPG | deletion | Frame_Shift_Del | c.69delN | p.Leu25Ter | p.L25* | Q99747 | protein_coding | TCGA-AN-A0AK-01 | Breast | breast invasive carcinoma | Female | >=65 | I/II | Unknown | Unknown | SD | |||
| NAPG | SNV | Missense_Mutation | c.505N>G | p.Arg169Gly | p.R169G | Q99747 | protein_coding | deleterious(0.03) | benign(0.234) | TCGA-AA-3811-01 | Colorectum | colon adenocarcinoma | Female | >=65 | III/IV | Unknown | Unknown | PD | |
| NAPG | SNV | Missense_Mutation | c.209N>T | p.Ala70Val | p.A70V | Q99747 | protein_coding | tolerated(0.09) | benign(0.015) | TCGA-AA-A01R-01 | Colorectum | colon adenocarcinoma | Male | <65 | III/IV | Chemotherapy | 5-fluorouracil | PD | |
| NAPG | deletion | Frame_Shift_Del | c.69delN | p.Leu25Ter | p.L25* | Q99747 | protein_coding | TCGA-AA-A02R-01 | Colorectum | colon adenocarcinoma | Female | >=65 | I/II | Unknown | Unknown | PD | |||
| NAPG | insertion | Frame_Shift_Ins | novel | c.538_539insA | p.Asn182LysfsTer4 | p.N182Kfs*4 | Q99747 | protein_coding | TCGA-AD-5900-01 | Colorectum | colon adenocarcinoma | Male | >=65 | I/II | Unknown | Unknown | SD | ||
| NAPG | SNV | Missense_Mutation | novel | c.707A>G | p.Glu236Gly | p.E236G | Q99747 | protein_coding | deleterious(0.01) | benign(0.053) | TCGA-A5-A2K5-01 | Endometrium | uterine corpus endometrioid carcinoma | Female | >=65 | I/II | Unknown | Unknown | SD |
| NAPG | SNV | Missense_Mutation | novel | c.909G>T | p.Glu303Asp | p.E303D | Q99747 | protein_coding | tolerated(0.74) | probably_damaging(0.978) | TCGA-AJ-A2QO-01 | Endometrium | uterine corpus endometrioid carcinoma | Female | >=65 | I/II | Unknown | Unknown | SD |
| NAPG | SNV | Missense_Mutation | novel | c.732N>T | p.Gln244His | p.Q244H | Q99747 | protein_coding | deleterious(0.01) | possibly_damaging(0.568) | TCGA-AJ-A3EK-01 | Endometrium | uterine corpus endometrioid carcinoma | Female | <65 | I/II | Chemotherapy | carboplatin | CR |
| NAPG | SNV | Missense_Mutation | novel | c.814N>C | p.Ser272Arg | p.S272R | Q99747 | protein_coding | deleterious(0.02) | possibly_damaging(0.483) | TCGA-AJ-A5DW-01 | Endometrium | uterine corpus endometrioid carcinoma | Female | <65 | I/II | Unknown | Unknown | SD |
| NAPG | SNV | Missense_Mutation | c.245N>A | p.Gly82Glu | p.G82E | Q99747 | protein_coding | deleterious(0.01) | probably_damaging(1) | TCGA-AP-A051-01 | Endometrium | uterine corpus endometrioid carcinoma | Female | >=65 | I/II | Unknown | Unknown | SD |
| Page: 1 2 3 |
Top |
Related drugs of malignant transformation related genes |
| Identification of chemicals and drugs interact with genes involved in malignant transfromation |
| (DGIdb 4.0) |
| Entrez ID | Symbol | Category | Interaction Types | Drug Claim Name | Drug Name | PMIDs |
| Page: 1 |

Copyright 2023-Present -The University of Texas Health Science Center at Houston |