
|
|||||
|
 | |
| |
| |
| |
| |
| |
|
Gene: NAPEPLD |
Gene summary for NAPEPLD |
| Gene information | Species | Human | Gene symbol | NAPEPLD | Gene ID | 222236 |
| Gene name | N-acyl phosphatidylethanolamine phospholipase D | |
| Gene Alias | C7orf18 | |
| Cytomap | 7q22.1 | |
| Gene Type | protein-coding | GO ID | GO:0001523 | UniProtAcc | Q6IQ20 |
Top |
Malignant transformation analysis |
| Identification of the aberrant gene expression in precancerous and cancerous lesions by comparing the gene expression of stem-like cells in diseased tissues with normal stem cells |
| Entrez ID | Symbol | Replicates | Species | Organ | Tissue | Adj P-value | Log2FC | Malignancy |
| 222236 | NAPEPLD | HTA11_347_2000001011 | Human | Colorectum | AD | 1.63e-13 | 6.90e-01 | -0.1954 |
| 222236 | NAPEPLD | HTA11_99999970781_79442 | Human | Colorectum | MSS | 5.52e-05 | -4.00e-01 | 0.294 |
| 222236 | NAPEPLD | HTA11_99999974143_84620 | Human | Colorectum | MSS | 1.21e-03 | -3.05e-01 | 0.3005 |
| 222236 | NAPEPLD | A001-C-207 | Human | Colorectum | FAP | 4.74e-08 | -3.98e-01 | 0.1278 |
| 222236 | NAPEPLD | A015-C-203 | Human | Colorectum | FAP | 5.92e-24 | -4.05e-01 | -0.1294 |
| 222236 | NAPEPLD | A015-C-204 | Human | Colorectum | FAP | 2.87e-06 | -3.70e-01 | -0.0228 |
| 222236 | NAPEPLD | A014-C-040 | Human | Colorectum | FAP | 2.07e-02 | -2.30e-01 | -0.1184 |
| 222236 | NAPEPLD | A002-C-201 | Human | Colorectum | FAP | 3.09e-09 | -1.54e-01 | 0.0324 |
| 222236 | NAPEPLD | A001-C-119 | Human | Colorectum | FAP | 1.56e-10 | -4.90e-01 | -0.1557 |
| 222236 | NAPEPLD | A001-C-108 | Human | Colorectum | FAP | 8.64e-23 | -4.70e-01 | -0.0272 |
| 222236 | NAPEPLD | A002-C-205 | Human | Colorectum | FAP | 1.30e-19 | -3.34e-01 | -0.1236 |
| 222236 | NAPEPLD | A001-C-104 | Human | Colorectum | FAP | 1.85e-02 | -2.92e-01 | 0.0184 |
| 222236 | NAPEPLD | A015-C-005 | Human | Colorectum | FAP | 1.58e-05 | -3.32e-01 | -0.0336 |
| 222236 | NAPEPLD | A015-C-006 | Human | Colorectum | FAP | 5.48e-15 | -4.80e-01 | -0.0994 |
| 222236 | NAPEPLD | A015-C-106 | Human | Colorectum | FAP | 2.26e-15 | -3.55e-01 | -0.0511 |
| 222236 | NAPEPLD | A002-C-114 | Human | Colorectum | FAP | 2.41e-15 | -2.96e-01 | -0.1561 |
| 222236 | NAPEPLD | A015-C-104 | Human | Colorectum | FAP | 4.18e-26 | -4.50e-01 | -0.1899 |
| 222236 | NAPEPLD | A001-C-014 | Human | Colorectum | FAP | 1.27e-15 | -4.23e-01 | 0.0135 |
| 222236 | NAPEPLD | A002-C-016 | Human | Colorectum | FAP | 5.44e-13 | -1.63e-01 | 0.0521 |
| 222236 | NAPEPLD | A015-C-002 | Human | Colorectum | FAP | 4.94e-11 | -3.96e-01 | -0.0763 |
| Page: 1 2 3 4 5 |
| Tissue | Expression Dynamics | Abbreviation |
| Colorectum (GSE201348) |  | FAP: Familial adenomatous polyposis |
| CRC: Colorectal cancer | ||
| Colorectum (HTA11) |  | AD: Adenomas |
| SER: Sessile serrated lesions | ||
| MSI-H: Microsatellite-high colorectal cancer | ||
| MSS: Microsatellite stable colorectal cancer | ||
| Thyroid | 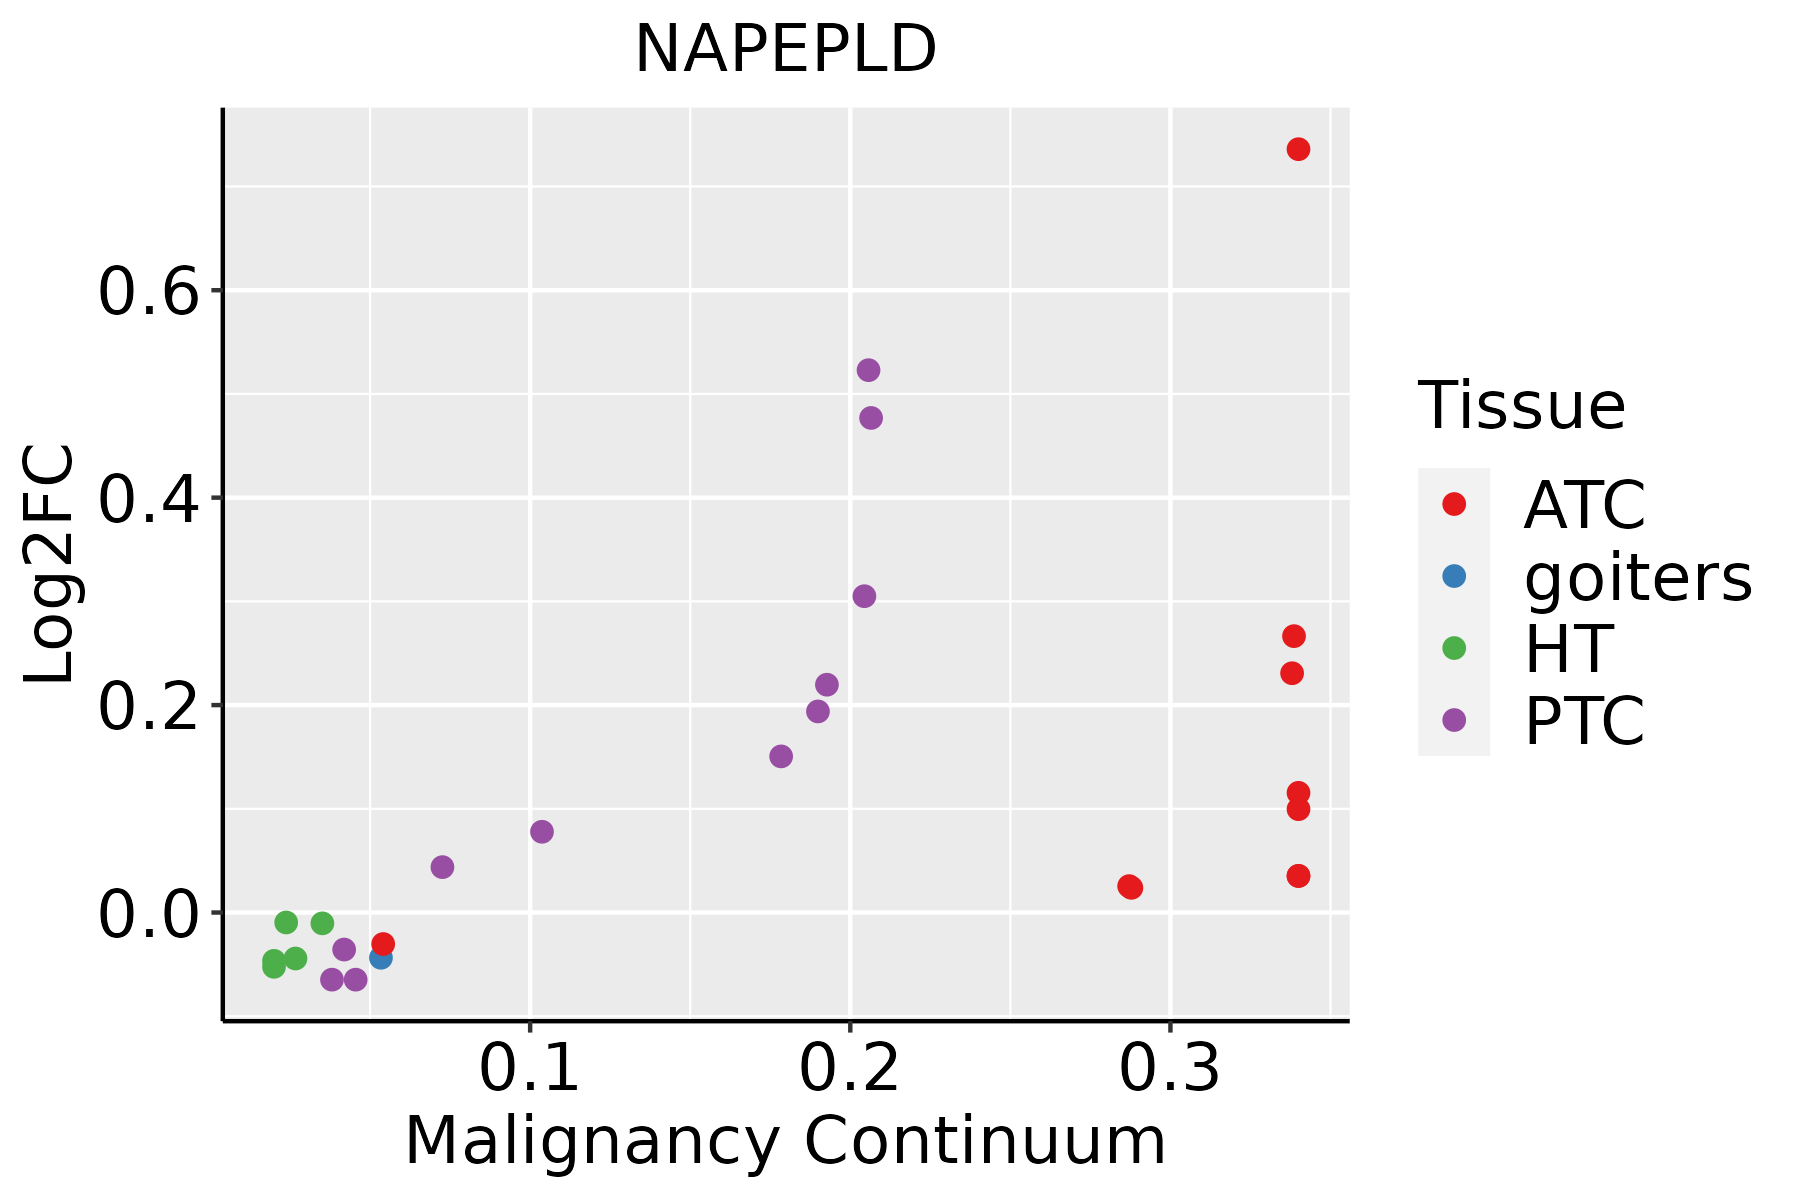 | ATC: Anaplastic thyroid cancer |
| HT: Hashimoto's thyroiditis | ||
| PTC: Papillary thyroid cancer |
| ∗log2FC in expression of this searched gene in stem-like cells from each diseased tissue sample relative to stem-like cells in normal samples in each tissue plotted against the malignancy continuum. Samples are colored based on if they are from different disease stage. |
Top |
Malignant transformation related pathway analysis |
| Find out the enriched GO biological processes and KEGG pathways involved in transition from healthy to precancer to cancer |
| Tissue | Disease Stage | Enriched GO biological Processes |
| Colorectum | AD |  |
| Colorectum | SER |  |
| Colorectum | MSS |  |
| Colorectum | MSI-H |  |
| Colorectum | FAP |  |
| ∗Top 15 enriched GO BP terms are showed in the bar plot of each disease state in each tissue. Each row represents a significant GO biological process which is colored according to the -log10(p.adjust). |
| Page: 1 2 3 4 5 6 7 8 9 |
| GO ID | Tissue | Disease Stage | Description | Gene Ratio | Bg Ratio | pvalue | p.adjust | Count |
| GO:0044403 | Colorectum | AD | biological process involved in symbiotic interaction | 99/3918 | 290/18723 | 1.02e-07 | 4.93e-06 | 99 |
| GO:0048872 | Colorectum | AD | homeostasis of number of cells | 87/3918 | 272/18723 | 1.16e-05 | 2.61e-04 | 87 |
| GO:0006066 | Colorectum | AD | alcohol metabolic process | 106/3918 | 353/18723 | 3.02e-05 | 5.57e-04 | 106 |
| GO:0016042 | Colorectum | AD | lipid catabolic process | 97/3918 | 320/18723 | 4.31e-05 | 7.56e-04 | 97 |
| GO:0007568 | Colorectum | AD | aging | 98/3918 | 339/18723 | 2.77e-04 | 3.39e-03 | 98 |
| GO:0044242 | Colorectum | AD | cellular lipid catabolic process | 66/3918 | 214/18723 | 3.96e-04 | 4.50e-03 | 66 |
| GO:0034308 | Colorectum | AD | primary alcohol metabolic process | 35/3918 | 102/18723 | 1.16e-03 | 1.05e-02 | 35 |
| GO:0035821 | Colorectum | AD | modulation of process of other organism | 34/3918 | 106/18723 | 4.73e-03 | 3.22e-02 | 34 |
| GO:0006650 | Colorectum | AD | glycerophospholipid metabolic process | 83/3918 | 306/18723 | 5.40e-03 | 3.55e-02 | 83 |
| GO:0006644 | Colorectum | AD | phospholipid metabolic process | 101/3918 | 383/18723 | 5.80e-03 | 3.67e-02 | 101 |
| GO:00444032 | Colorectum | MSS | biological process involved in symbiotic interaction | 93/3467 | 290/18723 | 1.72e-08 | 9.85e-07 | 93 |
| GO:00488722 | Colorectum | MSS | homeostasis of number of cells | 82/3467 | 272/18723 | 2.02e-06 | 6.28e-05 | 82 |
| GO:00075681 | Colorectum | MSS | aging | 90/3467 | 339/18723 | 1.51e-04 | 2.19e-03 | 90 |
| GO:00060662 | Colorectum | MSS | alcohol metabolic process | 92/3467 | 353/18723 | 2.57e-04 | 3.46e-03 | 92 |
| GO:00358211 | Colorectum | MSS | modulation of process of other organism | 33/3467 | 106/18723 | 1.18e-03 | 1.14e-02 | 33 |
| GO:00160422 | Colorectum | MSS | lipid catabolic process | 77/3467 | 320/18723 | 7.43e-03 | 4.71e-02 | 77 |
| GO:00444034 | Colorectum | FAP | biological process involved in symbiotic interaction | 66/2622 | 290/18723 | 3.47e-05 | 7.64e-04 | 66 |
| GO:00488724 | Colorectum | FAP | homeostasis of number of cells | 60/2622 | 272/18723 | 1.91e-04 | 2.79e-03 | 60 |
| GO:00442422 | Colorectum | FAP | cellular lipid catabolic process | 49/2622 | 214/18723 | 2.87e-04 | 3.77e-03 | 49 |
| GO:00075682 | Colorectum | FAP | aging | 69/2622 | 339/18723 | 7.66e-04 | 8.12e-03 | 69 |
| Page: 1 2 3 |
| Pathway ID | Tissue | Disease Stage | Description | Gene Ratio | Bg Ratio | pvalue | p.adjust | qvalue | Count |
| hsa04723 | Colorectum | AD | Retrograde endocannabinoid signaling | 59/2092 | 148/8465 | 2.94e-05 | 2.73e-04 | 1.74e-04 | 59 |
| hsa047231 | Colorectum | AD | Retrograde endocannabinoid signaling | 59/2092 | 148/8465 | 2.94e-05 | 2.73e-04 | 1.74e-04 | 59 |
| hsa047234 | Colorectum | MSS | Retrograde endocannabinoid signaling | 61/1875 | 148/8465 | 1.21e-07 | 1.93e-06 | 1.18e-06 | 61 |
| hsa047235 | Colorectum | MSS | Retrograde endocannabinoid signaling | 61/1875 | 148/8465 | 1.21e-07 | 1.93e-06 | 1.18e-06 | 61 |
| Page: 1 |
Top |
Cell-cell communication analysis |
| Identification of potential cell-cell interactions between two cell types and their ligand-receptor pairs for different disease states |
| Ligand | Receptor | LRpair | Pathway | Tissue | Disease Stage |
| Page: 1 |
Top |
Single-cell gene regulatory network inference analysis |
| Find out the significant the regulons (TFs) and the target genes of each regulon across cell types for different disease states |
| TF | Cell Type | Tissue | Disease Stage | Target Gene | RSS | Regulon Activity |
| ∗The dot plots of a searched regulon are shown for all cell subpopulations in each disease state of each tissue based on the regulon specific score inferred using pySCENIC and by calculating the average expression. |
| Page: 1 |
Top |
Somatic mutation of malignant transformation related genes |
| Annotation of somatic variants for genes involved in malignant transformation |
| Hugo Symbol | Variant Class | Variant Classification | dbSNP RS | HGVSc | HGVSp | HGVSp Short | SWISSPROT | BIOTYPE | SIFT | PolyPhen | Tumor Sample Barcode | Tissue | Histology | Sex | Age | Stage | Therapy Types | Drugs | Outcome |
| NAPEPLD | insertion | Nonsense_Mutation | novel | c.489_490insGGAGAGTTGTAAGGTCTTGATGTCAGGAAATACGTGCCAGCTT | p.Arg164GlyfsTer4 | p.R164Gfs*4 | Q6IQ20 | protein_coding | TCGA-A8-A08H-01 | Breast | breast invasive carcinoma | Female | >=65 | I/II | Unknown | Unknown | SD | ||
| NAPEPLD | deletion | Frame_Shift_Del | rs746683932 | c.842delN | p.Phe281SerfsTer14 | p.F281Sfs*14 | Q6IQ20 | protein_coding | TCGA-AN-A0AK-01 | Breast | breast invasive carcinoma | Female | >=65 | I/II | Unknown | Unknown | SD | ||
| NAPEPLD | deletion | Frame_Shift_Del | c.540_553delGGTCCTTATCAGTC | p.Val181GlnfsTer4 | p.V181Qfs*4 | Q6IQ20 | protein_coding | TCGA-BH-A0C0-01 | Breast | breast invasive carcinoma | Female | <65 | I/II | Chemotherapy | carboplatin | SD | |||
| NAPEPLD | deletion | Frame_Shift_Del | novel | c.404delN | p.Val135GlufsTer38 | p.V135Efs*38 | Q6IQ20 | protein_coding | TCGA-EW-A2FV-01 | Breast | breast invasive carcinoma | Female | <65 | III/IV | Chemotherapy | docetaxel | SD | ||
| NAPEPLD | SNV | Missense_Mutation | novel | c.784N>C | p.Asp262His | p.D262H | Q6IQ20 | protein_coding | deleterious(0.02) | benign(0.062) | TCGA-C5-A1MN-01 | Cervix | cervical & endocervical cancer | Female | <65 | III/IV | Chemotherapy | cisplatin | SD |
| NAPEPLD | SNV | Missense_Mutation | c.319N>T | p.Leu107Phe | p.L107F | Q6IQ20 | protein_coding | tolerated(0.06) | benign(0.04) | TCGA-AA-3672-01 | Colorectum | colon adenocarcinoma | Female | >=65 | III/IV | Unknown | Unknown | SD | |
| NAPEPLD | SNV | Missense_Mutation | rs201645773 | c.457C>T | p.Arg153Cys | p.R153C | Q6IQ20 | protein_coding | deleterious(0) | probably_damaging(0.997) | TCGA-AA-3872-01 | Colorectum | colon adenocarcinoma | Male | <65 | III/IV | Unknown | Unknown | SD |
| NAPEPLD | SNV | Missense_Mutation | c.68A>G | p.Lys23Arg | p.K23R | Q6IQ20 | protein_coding | tolerated_low_confidence(0.1) | benign(0.018) | TCGA-AA-3977-01 | Colorectum | colon adenocarcinoma | Male | >=65 | I/II | Unknown | Unknown | SD | |
| NAPEPLD | SNV | Missense_Mutation | c.802N>T | p.Gly268Cys | p.G268C | Q6IQ20 | protein_coding | tolerated(0.07) | benign(0.122) | TCGA-AM-5821-01 | Colorectum | colon adenocarcinoma | Female | >=65 | I/II | Unknown | Unknown | SD | |
| NAPEPLD | SNV | Missense_Mutation | rs746125875 | c.496C>T | p.Arg166Cys | p.R166C | Q6IQ20 | protein_coding | deleterious(0) | benign(0.052) | TCGA-CA-6717-01 | Colorectum | colon adenocarcinoma | Male | <65 | I/II | Chemotherapy | oxaliplatin | CR |
| Page: 1 2 3 4 5 6 7 |
Top |
Related drugs of malignant transformation related genes |
| Identification of chemicals and drugs interact with genes involved in malignant transfromation |
| (DGIdb 4.0) |
| Entrez ID | Symbol | Category | Interaction Types | Drug Claim Name | Drug Name | PMIDs |
| 222236 | NAPEPLD | ENZYME | inhibitor | 405560510 | HEXACHLOROPHENE | |
| 222236 | NAPEPLD | ENZYME | ETHANOL | ALCOHOL | 17302558 | |
| 222236 | NAPEPLD | ENZYME | inhibitor | 405560495 | ||
| 222236 | NAPEPLD | ENZYME | inhibitor | 135649999 | BITHIONOL | |
| 222236 | NAPEPLD | ENZYME | inhibitor | 405560496 |
| Page: 1 |

Copyright 2023-Present -The University of Texas Health Science Center at Houston |