
|
|||||
|
 | |
| |
| |
| |
| |
| |
|
Gene: NAPB |
Gene summary for NAPB |
| Gene information | Species | Human | Gene symbol | NAPB | Gene ID | 63908 |
| Gene name | NSF attachment protein beta | |
| Gene Alias | SNAP-BETA | |
| Cytomap | 20p11.21 | |
| Gene Type | protein-coding | GO ID | GO:0001505 | UniProtAcc | A0A087WZQ7 |
Top |
Malignant transformation analysis |
| Identification of the aberrant gene expression in precancerous and cancerous lesions by comparing the gene expression of stem-like cells in diseased tissues with normal stem cells |
| Entrez ID | Symbol | Replicates | Species | Organ | Tissue | Adj P-value | Log2FC | Malignancy |
| 63908 | NAPB | NAFLD1 | Human | Liver | NAFLD | 8.31e-06 | 4.15e-01 | -0.04 |
| 63908 | NAPB | HCC1_Meng | Human | Liver | HCC | 4.05e-12 | 3.45e-02 | 0.0246 |
| 63908 | NAPB | HCC2_Meng | Human | Liver | HCC | 1.33e-02 | 1.40e-02 | 0.0107 |
| 63908 | NAPB | S014 | Human | Liver | HCC | 9.76e-07 | 3.82e-01 | 0.2254 |
| 63908 | NAPB | S015 | Human | Liver | HCC | 7.63e-16 | 6.96e-01 | 0.2375 |
| 63908 | NAPB | S016 | Human | Liver | HCC | 3.79e-14 | 5.18e-01 | 0.2243 |
| 63908 | NAPB | S028 | Human | Liver | HCC | 1.99e-02 | 1.92e-01 | 0.2503 |
| Page: 1 |
| Tissue | Expression Dynamics | Abbreviation |
| Liver | 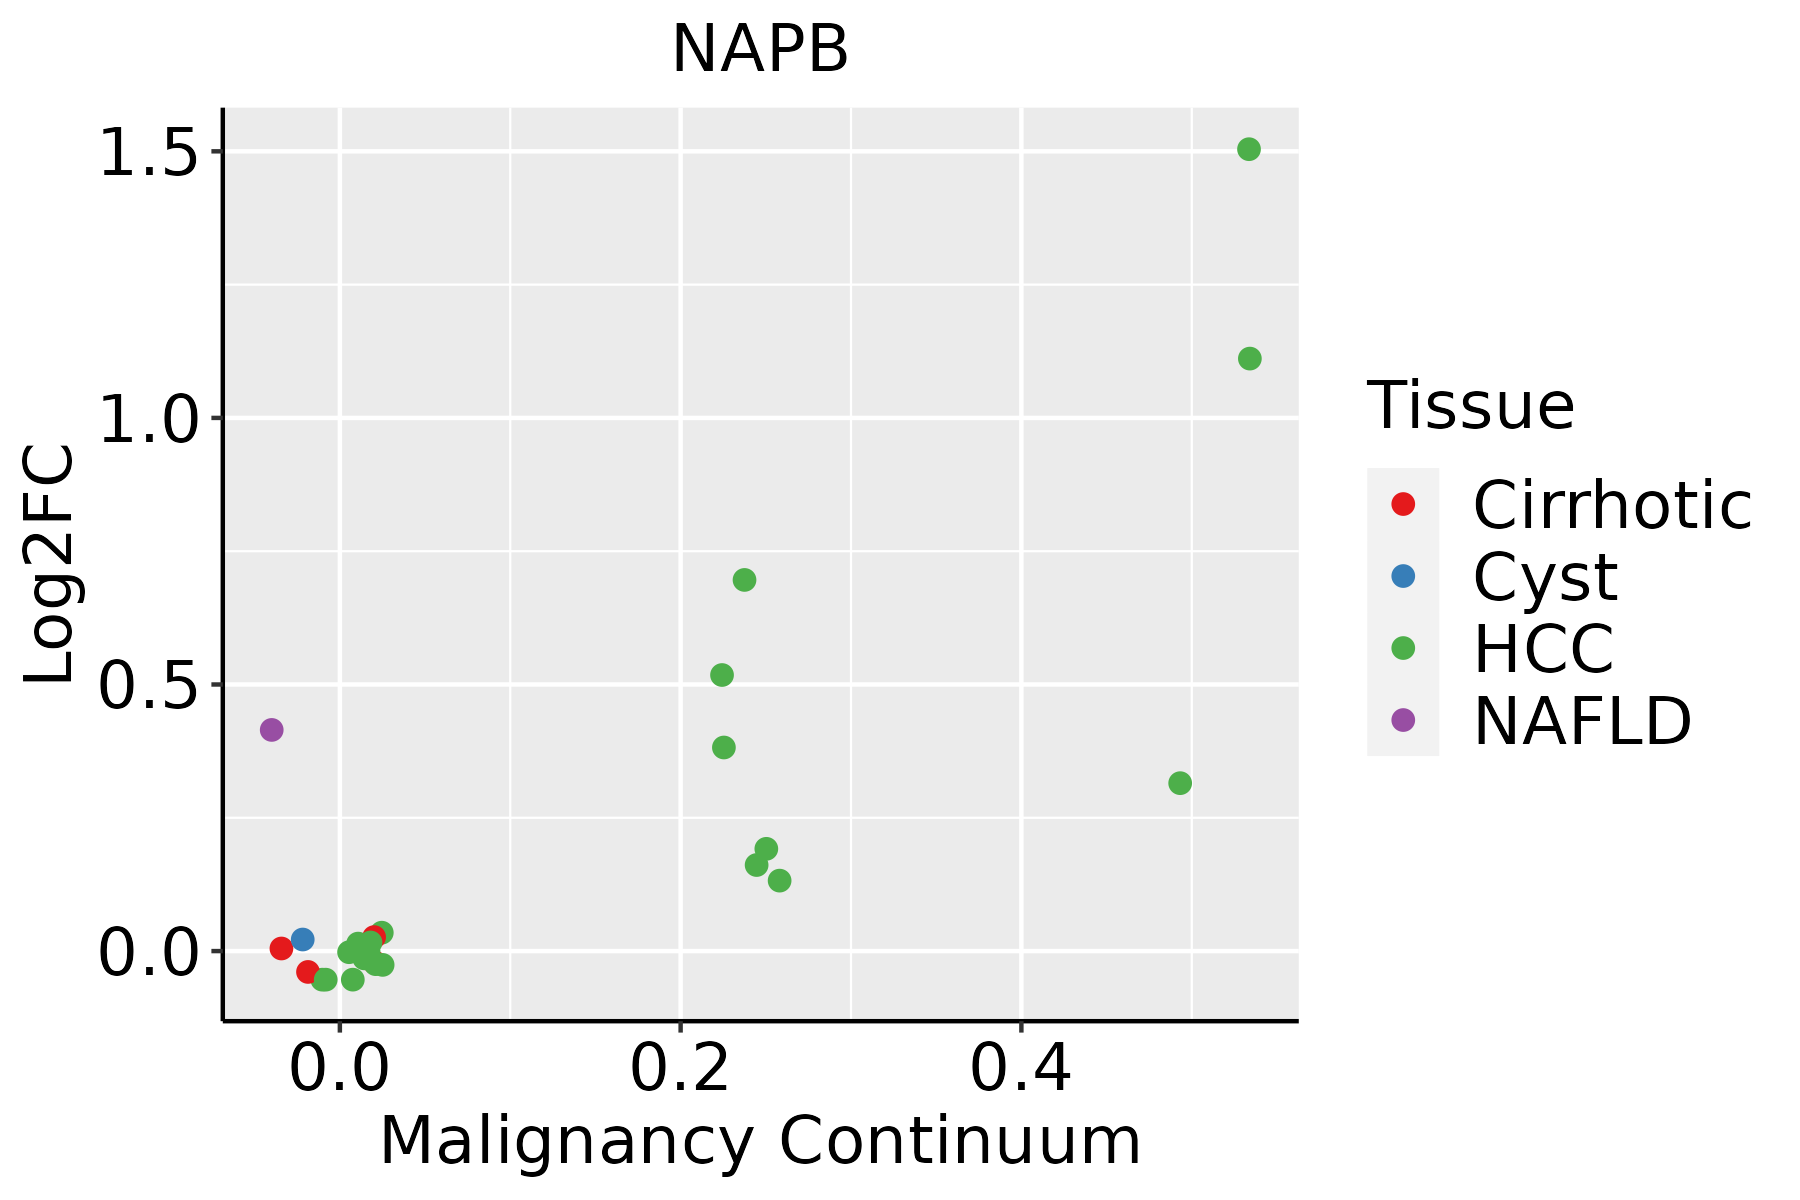 | HCC: Hepatocellular carcinoma |
| NAFLD: Non-alcoholic fatty liver disease |
| ∗log2FC in expression of this searched gene in stem-like cells from each diseased tissue sample relative to stem-like cells in normal samples in each tissue plotted against the malignancy continuum. Samples are colored based on if they are from different disease stage. |
Top |
Malignant transformation related pathway analysis |
| Find out the enriched GO biological processes and KEGG pathways involved in transition from healthy to precancer to cancer |
| Tissue | Disease Stage | Enriched GO biological Processes |
| Colorectum | AD |  |
| Colorectum | SER |  |
| Colorectum | MSS |  |
| Colorectum | MSI-H |  |
| Colorectum | FAP |  |
| ∗Top 15 enriched GO BP terms are showed in the bar plot of each disease state in each tissue. Each row represents a significant GO biological process which is colored according to the -log10(p.adjust). |
| Page: 1 2 3 4 5 6 7 8 9 |
| GO ID | Tissue | Disease Stage | Description | Gene Ratio | Bg Ratio | pvalue | p.adjust | Count |
| GO:00432547 | Liver | NAFLD | regulation of protein-containing complex assembly | 66/1882 | 428/18723 | 2.83e-04 | 4.53e-03 | 66 |
| GO:002241112 | Liver | HCC | cellular component disassembly | 282/7958 | 443/18723 | 1.02e-19 | 1.38e-17 | 282 |
| GO:004325422 | Liver | HCC | regulation of protein-containing complex assembly | 264/7958 | 428/18723 | 5.47e-16 | 4.39e-14 | 264 |
| GO:003298411 | Liver | HCC | protein-containing complex disassembly | 138/7958 | 224/18723 | 5.59e-09 | 1.46e-07 | 138 |
| GO:00436242 | Liver | HCC | cellular protein complex disassembly | 71/7958 | 136/18723 | 1.39e-02 | 4.95e-02 | 71 |
| Page: 1 |
| Pathway ID | Tissue | Disease Stage | Description | Gene Ratio | Bg Ratio | pvalue | p.adjust | qvalue | Count |
| Page: 1 |
Top |
Cell-cell communication analysis |
| Identification of potential cell-cell interactions between two cell types and their ligand-receptor pairs for different disease states |
| Ligand | Receptor | LRpair | Pathway | Tissue | Disease Stage |
| Page: 1 |
Top |
Single-cell gene regulatory network inference analysis |
| Find out the significant the regulons (TFs) and the target genes of each regulon across cell types for different disease states |
| TF | Cell Type | Tissue | Disease Stage | Target Gene | RSS | Regulon Activity |
| ∗The dot plots of a searched regulon are shown for all cell subpopulations in each disease state of each tissue based on the regulon specific score inferred using pySCENIC and by calculating the average expression. |
| Page: 1 |
Top |
Somatic mutation of malignant transformation related genes |
| Annotation of somatic variants for genes involved in malignant transformation |
| Hugo Symbol | Variant Class | Variant Classification | dbSNP RS | HGVSc | HGVSp | HGVSp Short | SWISSPROT | BIOTYPE | SIFT | PolyPhen | Tumor Sample Barcode | Tissue | Histology | Sex | Age | Stage | Therapy Types | Drugs | Outcome |
| NAPB | SNV | Missense_Mutation | c.427N>C | p.Glu143Gln | p.E143Q | protein_coding | deleterious(0.04) | possibly_damaging(0.877) | TCGA-IR-A3LH-01 | Cervix | cervical & endocervical cancer | Female | <65 | I/II | Chemotherapy | cisplatin | CR | ||
| NAPB | SNV | Missense_Mutation | c.86N>A | p.Arg29Gln | p.R29Q | protein_coding | deleterious(0.03) | benign(0.065) | TCGA-IR-A3LH-01 | Cervix | cervical & endocervical cancer | Female | <65 | I/II | Chemotherapy | cisplatin | CR | ||
| NAPB | SNV | Missense_Mutation | novel | c.325A>C | p.Asn109His | p.N109H | protein_coding | tolerated(0.13) | benign(0.393) | TCGA-AA-A00N-01 | Colorectum | colon adenocarcinoma | Male | >=65 | I/II | Unknown | Unknown | PD | |
| NAPB | SNV | Missense_Mutation | c.799G>A | p.Val267Met | p.V267M | protein_coding | deleterious(0) | benign(0.382) | TCGA-AA-A01P-01 | Colorectum | colon adenocarcinoma | Female | >=65 | III/IV | Unknown | Unknown | PD | ||
| NAPB | SNV | Missense_Mutation | c.896N>A | p.Gly299Glu | p.G299E | protein_coding | tolerated(0.37) | probably_damaging(1) | TCGA-NH-A6GC-01 | Colorectum | colon adenocarcinoma | Female | >=65 | I/II | Chemotherapy | fluorouracil | SD | ||
| NAPB | deletion | Frame_Shift_Del | c.170delA | p.Asn57IlefsTer52 | p.N57Ifs*52 | protein_coding | TCGA-AU-6004-01 | Colorectum | colon adenocarcinoma | Female | >=65 | I/II | Unknown | Unknown | SD | ||||
| NAPB | deletion | Frame_Shift_Del | c.293delA | p.Lys98ArgfsTer11 | p.K98Rfs*11 | protein_coding | TCGA-DM-A1HB-01 | Colorectum | colon adenocarcinoma | Male | >=65 | III/IV | Unknown | Unknown | SD | ||||
| NAPB | SNV | Missense_Mutation | novel | c.158N>G | p.Lys53Arg | p.K53R | protein_coding | deleterious(0) | possibly_damaging(0.69) | TCGA-A5-A1OF-01 | Endometrium | uterine corpus endometrioid carcinoma | Female | <65 | I/II | Unknown | Unknown | SD | |
| NAPB | SNV | Missense_Mutation | novel | c.778N>G | p.Ser260Gly | p.S260G | protein_coding | tolerated(0.05) | benign(0) | TCGA-AJ-A3EL-01 | Endometrium | uterine corpus endometrioid carcinoma | Female | <65 | I/II | Unknown | Unknown | SD | |
| NAPB | SNV | Missense_Mutation | novel | c.399G>T | p.Glu133Asp | p.E133D | protein_coding | deleterious(0.04) | benign(0.043) | TCGA-AJ-A5DW-01 | Endometrium | uterine corpus endometrioid carcinoma | Female | <65 | I/II | Unknown | Unknown | SD |
| Page: 1 2 3 4 |
Top |
Related drugs of malignant transformation related genes |
| Identification of chemicals and drugs interact with genes involved in malignant transfromation |
| (DGIdb 4.0) |
| Entrez ID | Symbol | Category | Interaction Types | Drug Claim Name | Drug Name | PMIDs |
| Page: 1 |

Copyright 2023-Present -The University of Texas Health Science Center at Houston |