
|
|||||
|
 | |
| |
| |
| |
| |
| |
|
Gene: NAPA |
Gene summary for NAPA |
| Gene information | Species | Human | Gene symbol | NAPA | Gene ID | 8775 |
| Gene name | NSF attachment protein alpha | |
| Gene Alias | SNAPA | |
| Cytomap | 19q13.32-q13.33 | |
| Gene Type | protein-coding | GO ID | GO:0001505 | UniProtAcc | A0A024R0R9 |
Top |
Malignant transformation analysis |
| Identification of the aberrant gene expression in precancerous and cancerous lesions by comparing the gene expression of stem-like cells in diseased tissues with normal stem cells |
| Entrez ID | Symbol | Replicates | Species | Organ | Tissue | Adj P-value | Log2FC | Malignancy |
| 8775 | NAPA | LZE2D | Human | Esophagus | HGIN | 4.06e-04 | 5.73e-01 | 0.0642 |
| 8775 | NAPA | LZE2T | Human | Esophagus | ESCC | 1.68e-06 | 9.18e-01 | 0.082 |
| 8775 | NAPA | LZE4T | Human | Esophagus | ESCC | 4.94e-36 | 9.53e-01 | 0.0811 |
| 8775 | NAPA | LZE5T | Human | Esophagus | ESCC | 1.44e-18 | 9.53e-01 | 0.0514 |
| 8775 | NAPA | LZE7T | Human | Esophagus | ESCC | 4.73e-20 | 8.10e-01 | 0.0667 |
| 8775 | NAPA | LZE8T | Human | Esophagus | ESCC | 2.18e-30 | 8.28e-01 | 0.067 |
| 8775 | NAPA | LZE20T | Human | Esophagus | ESCC | 2.05e-28 | 8.44e-01 | 0.0662 |
| 8775 | NAPA | LZE21D1 | Human | Esophagus | HGIN | 2.94e-02 | 5.59e-01 | 0.0632 |
| 8775 | NAPA | LZE22D1 | Human | Esophagus | HGIN | 5.37e-09 | 4.77e-01 | 0.0595 |
| 8775 | NAPA | LZE22T | Human | Esophagus | ESCC | 4.72e-15 | 9.88e-01 | 0.068 |
| 8775 | NAPA | LZE24T | Human | Esophagus | ESCC | 2.44e-52 | 1.37e+00 | 0.0596 |
| 8775 | NAPA | LZE22D3 | Human | Esophagus | HGIN | 2.46e-05 | 1.04e+00 | 0.0653 |
| 8775 | NAPA | LZE21T | Human | Esophagus | ESCC | 6.14e-12 | 6.80e-01 | 0.0655 |
| 8775 | NAPA | LZE6T | Human | Esophagus | ESCC | 1.35e-21 | 6.95e-01 | 0.0845 |
| 8775 | NAPA | P1T-E | Human | Esophagus | ESCC | 5.78e-38 | 1.62e+00 | 0.0875 |
| 8775 | NAPA | P2T-E | Human | Esophagus | ESCC | 1.14e-79 | 1.25e+00 | 0.1177 |
| 8775 | NAPA | P4T-E | Human | Esophagus | ESCC | 2.59e-55 | 1.06e+00 | 0.1323 |
| 8775 | NAPA | P5T-E | Human | Esophagus | ESCC | 4.09e-44 | 8.25e-01 | 0.1327 |
| 8775 | NAPA | P8T-E | Human | Esophagus | ESCC | 5.97e-107 | 1.82e+00 | 0.0889 |
| 8775 | NAPA | P9T-E | Human | Esophagus | ESCC | 8.44e-46 | 9.99e-01 | 0.1131 |
| Page: 1 2 3 4 5 6 7 8 9 |
| Tissue | Expression Dynamics | Abbreviation |
| Esophagus | 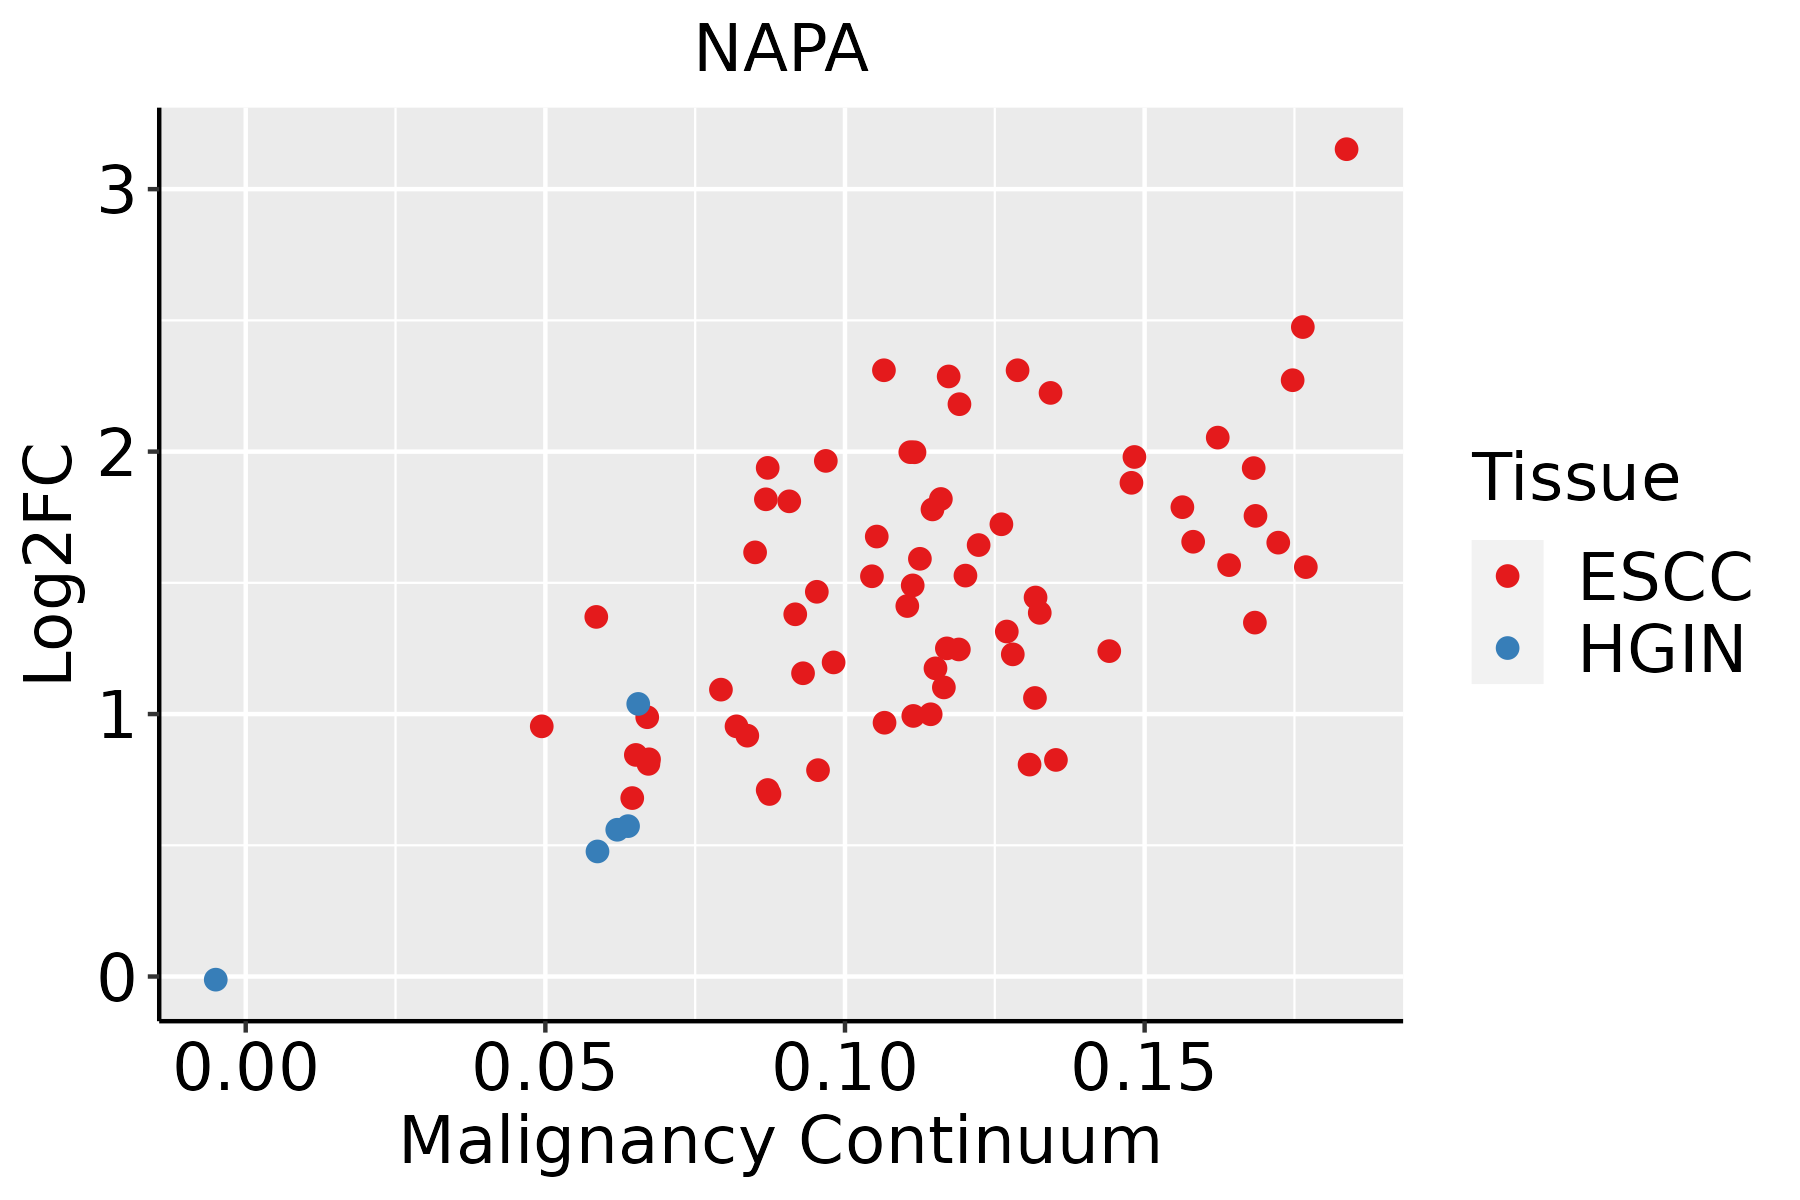 | ESCC: Esophageal squamous cell carcinoma |
| HGIN: High-grade intraepithelial neoplasias | ||
| LGIN: Low-grade intraepithelial neoplasias | ||
| GC | 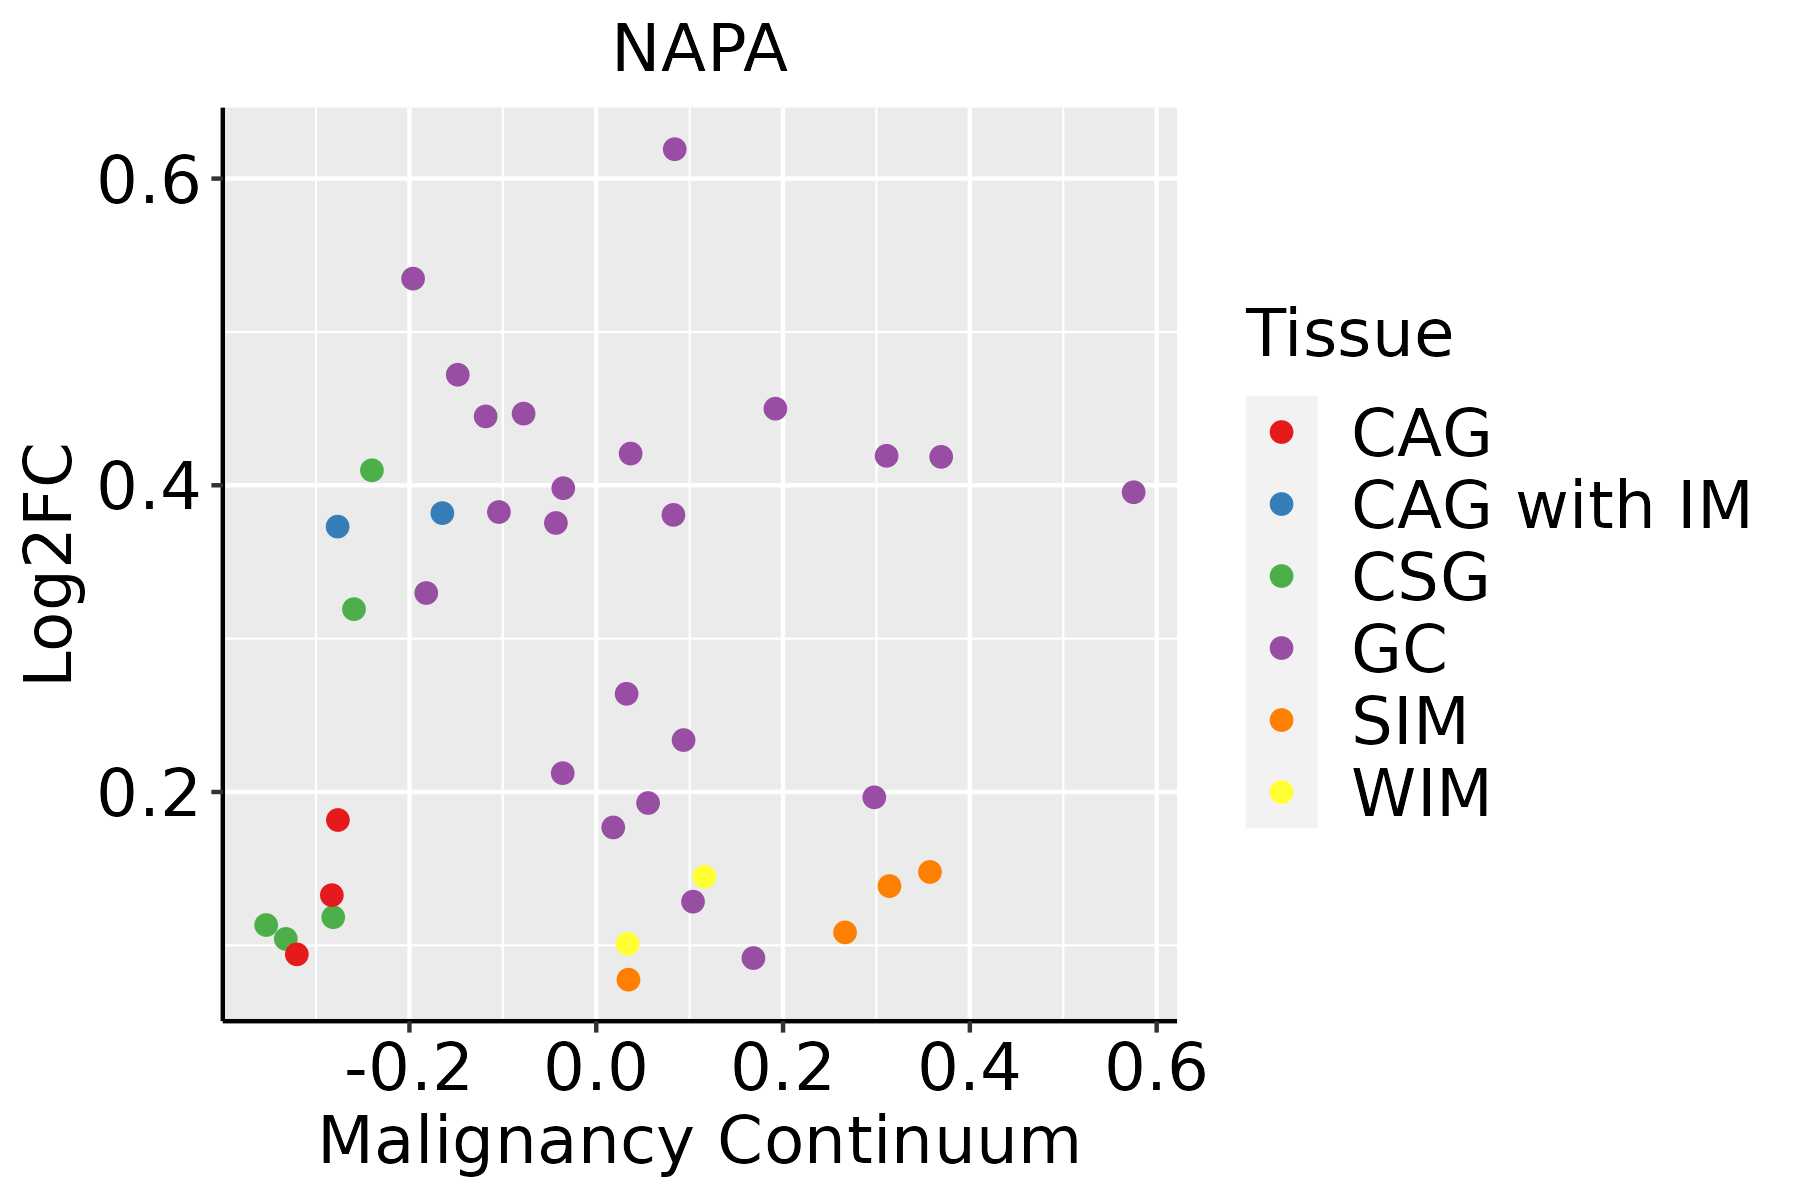 | CAG: Chronic atrophic gastritis |
| CAG with IM: Chronic atrophic gastritis with intestinal metaplasia | ||
| CSG: Chronic superficial gastritis | ||
| GC: Gastric cancer | ||
| SIM: Severe intestinal metaplasia | ||
| WIM: Wild intestinal metaplasia | ||
| Liver |  | HCC: Hepatocellular carcinoma |
| NAFLD: Non-alcoholic fatty liver disease | ||
| Lung |  | AAH: Atypical adenomatous hyperplasia |
| AIS: Adenocarcinoma in situ | ||
| IAC: Invasive lung adenocarcinoma | ||
| MIA: Minimally invasive adenocarcinoma | ||
| Oral Cavity | 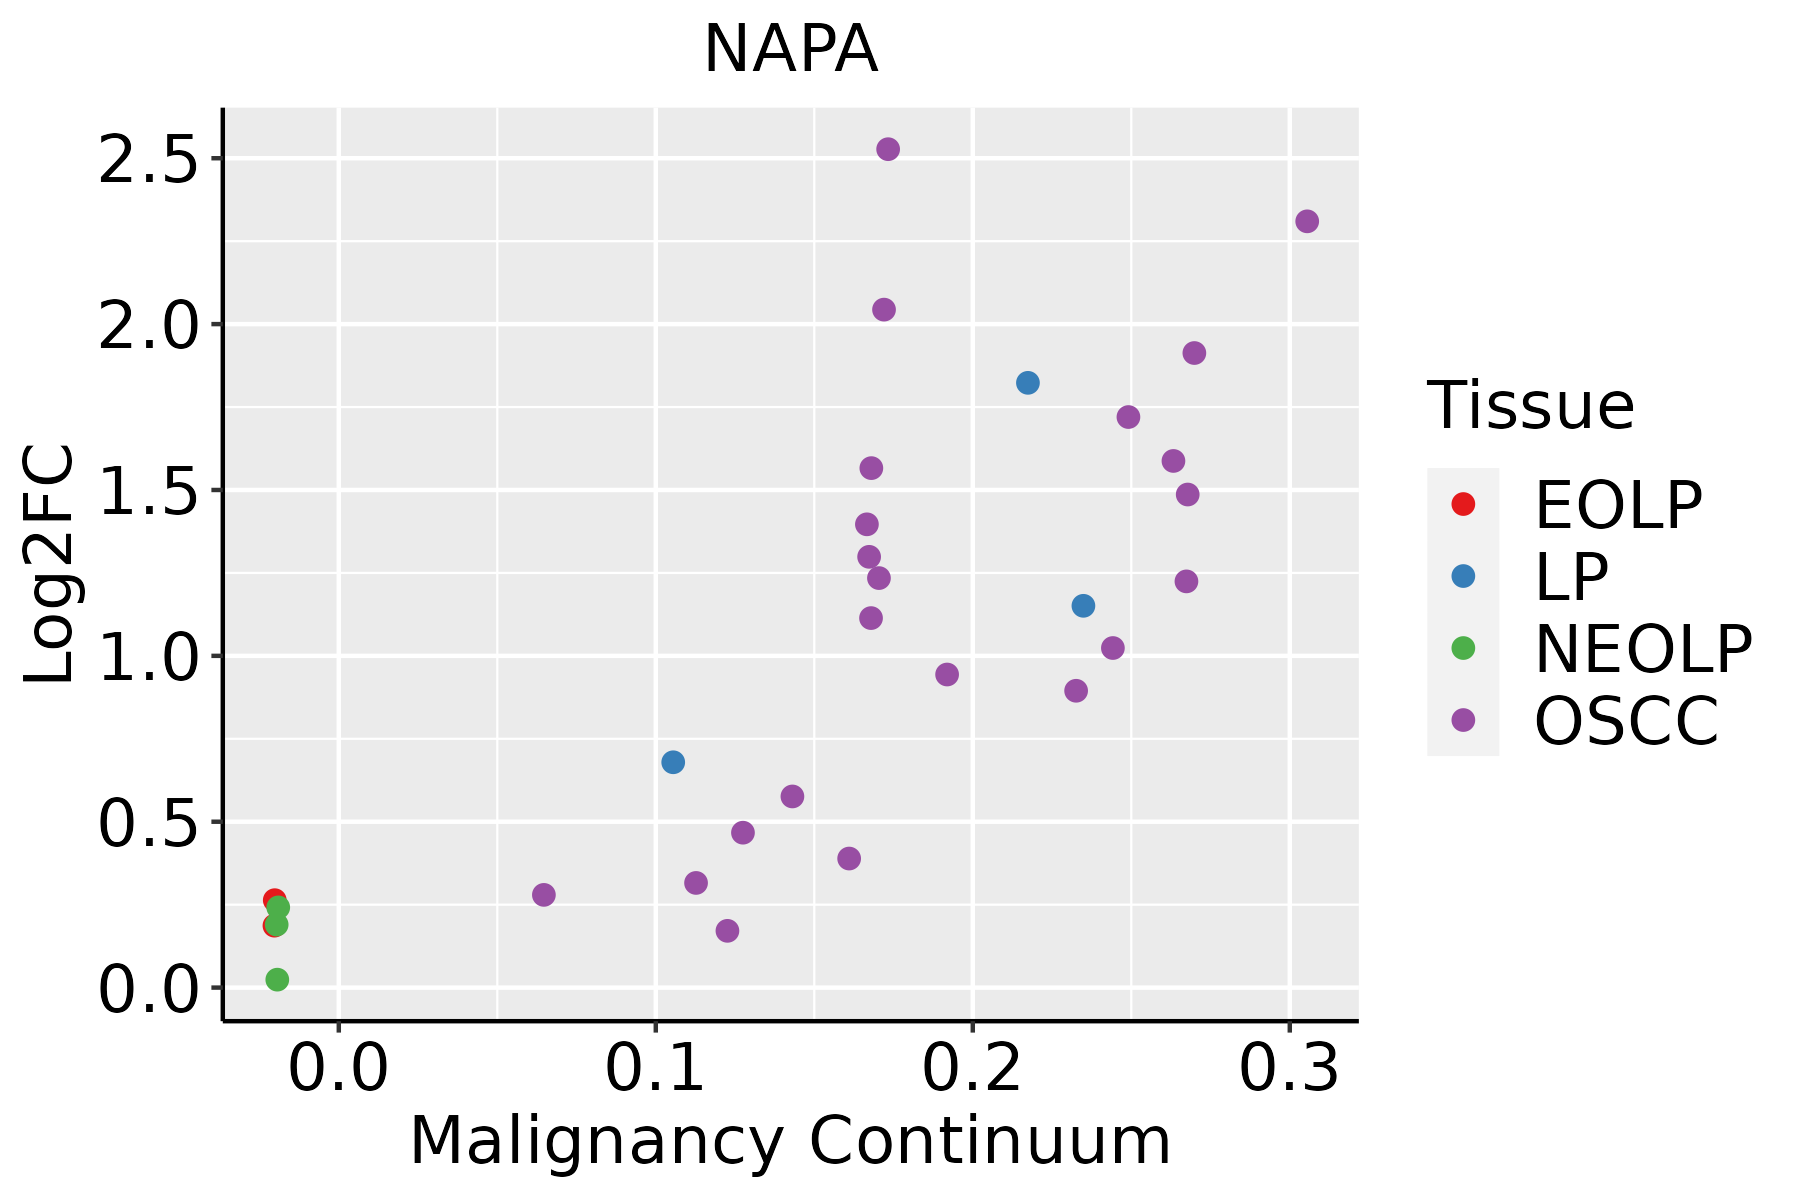 | EOLP: Erosive Oral lichen planus |
| LP: leukoplakia | ||
| NEOLP: Non-erosive oral lichen planus | ||
| OSCC: Oral squamous cell carcinoma | ||
| Prostate | 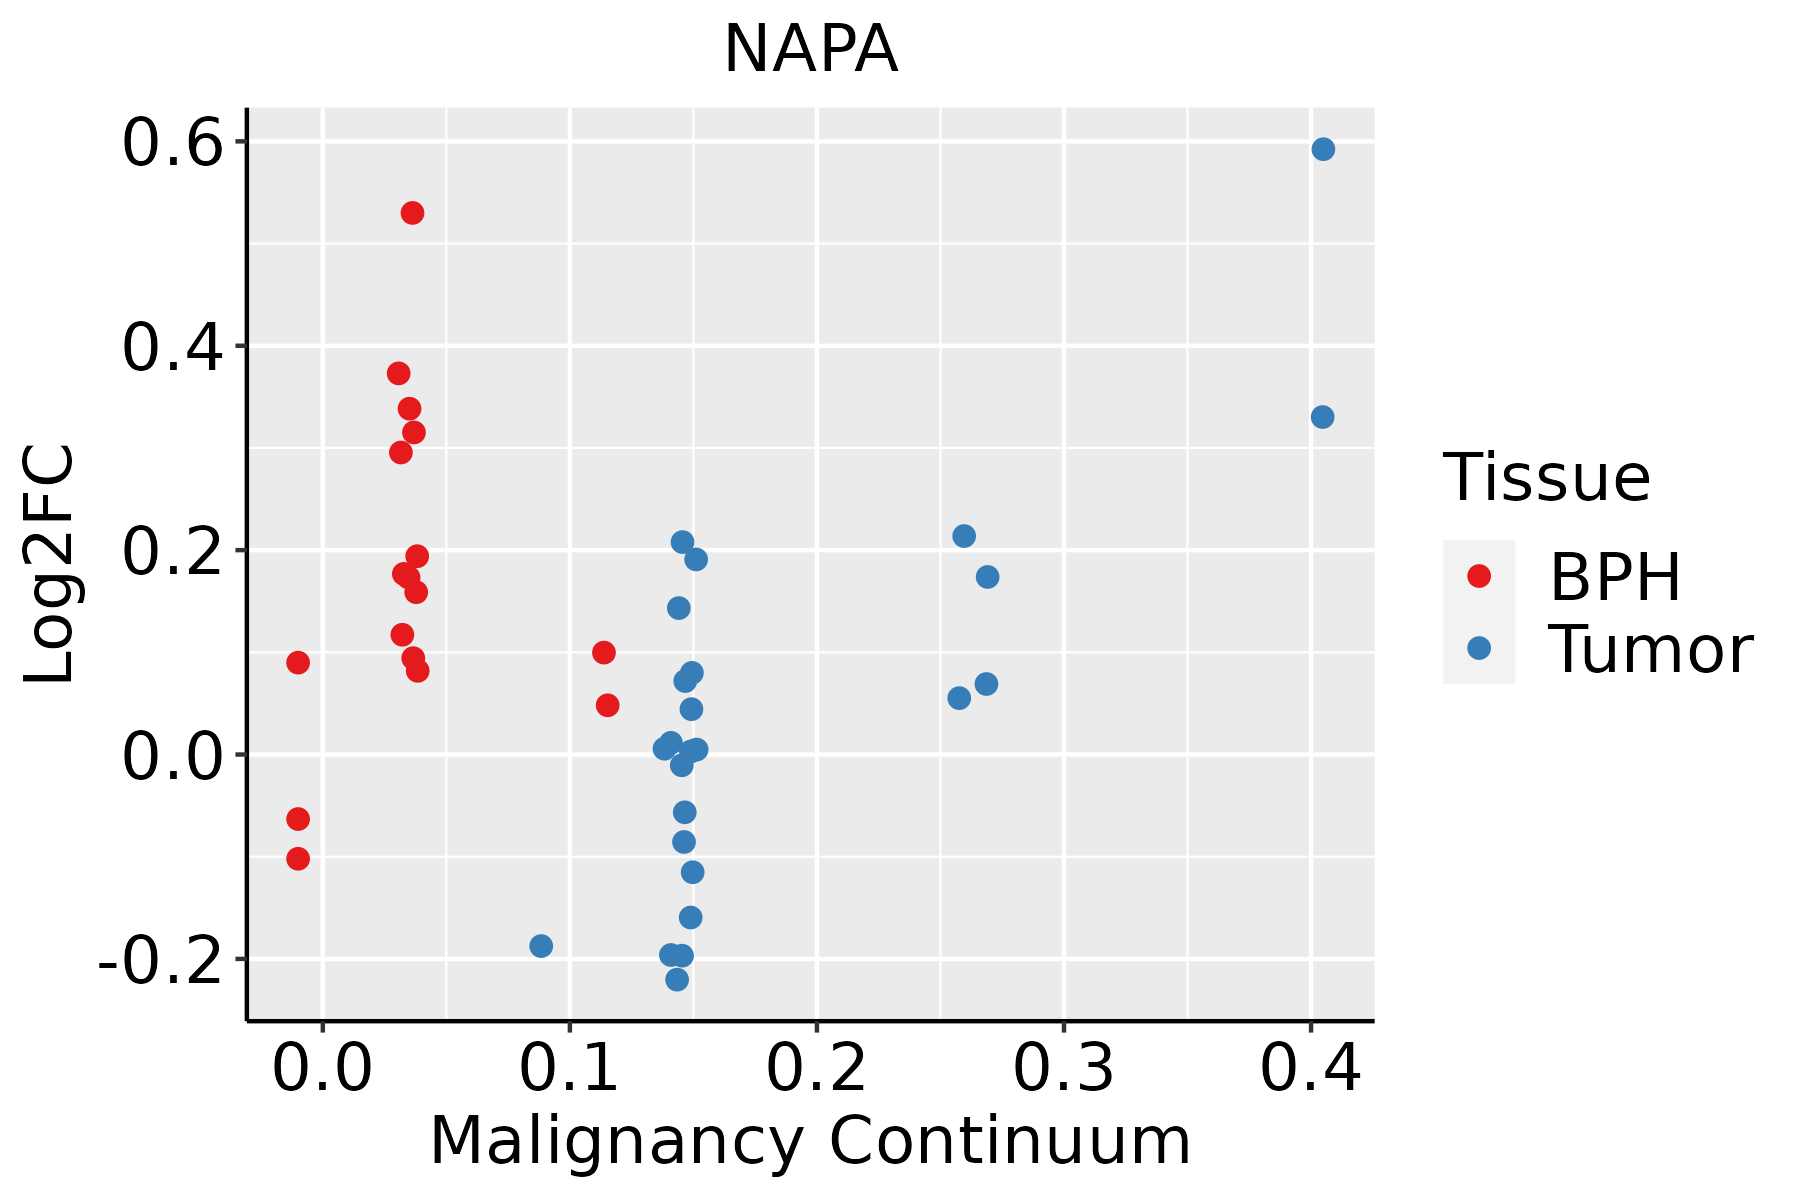 | BPH: Benign Prostatic Hyperplasia |
| Skin | 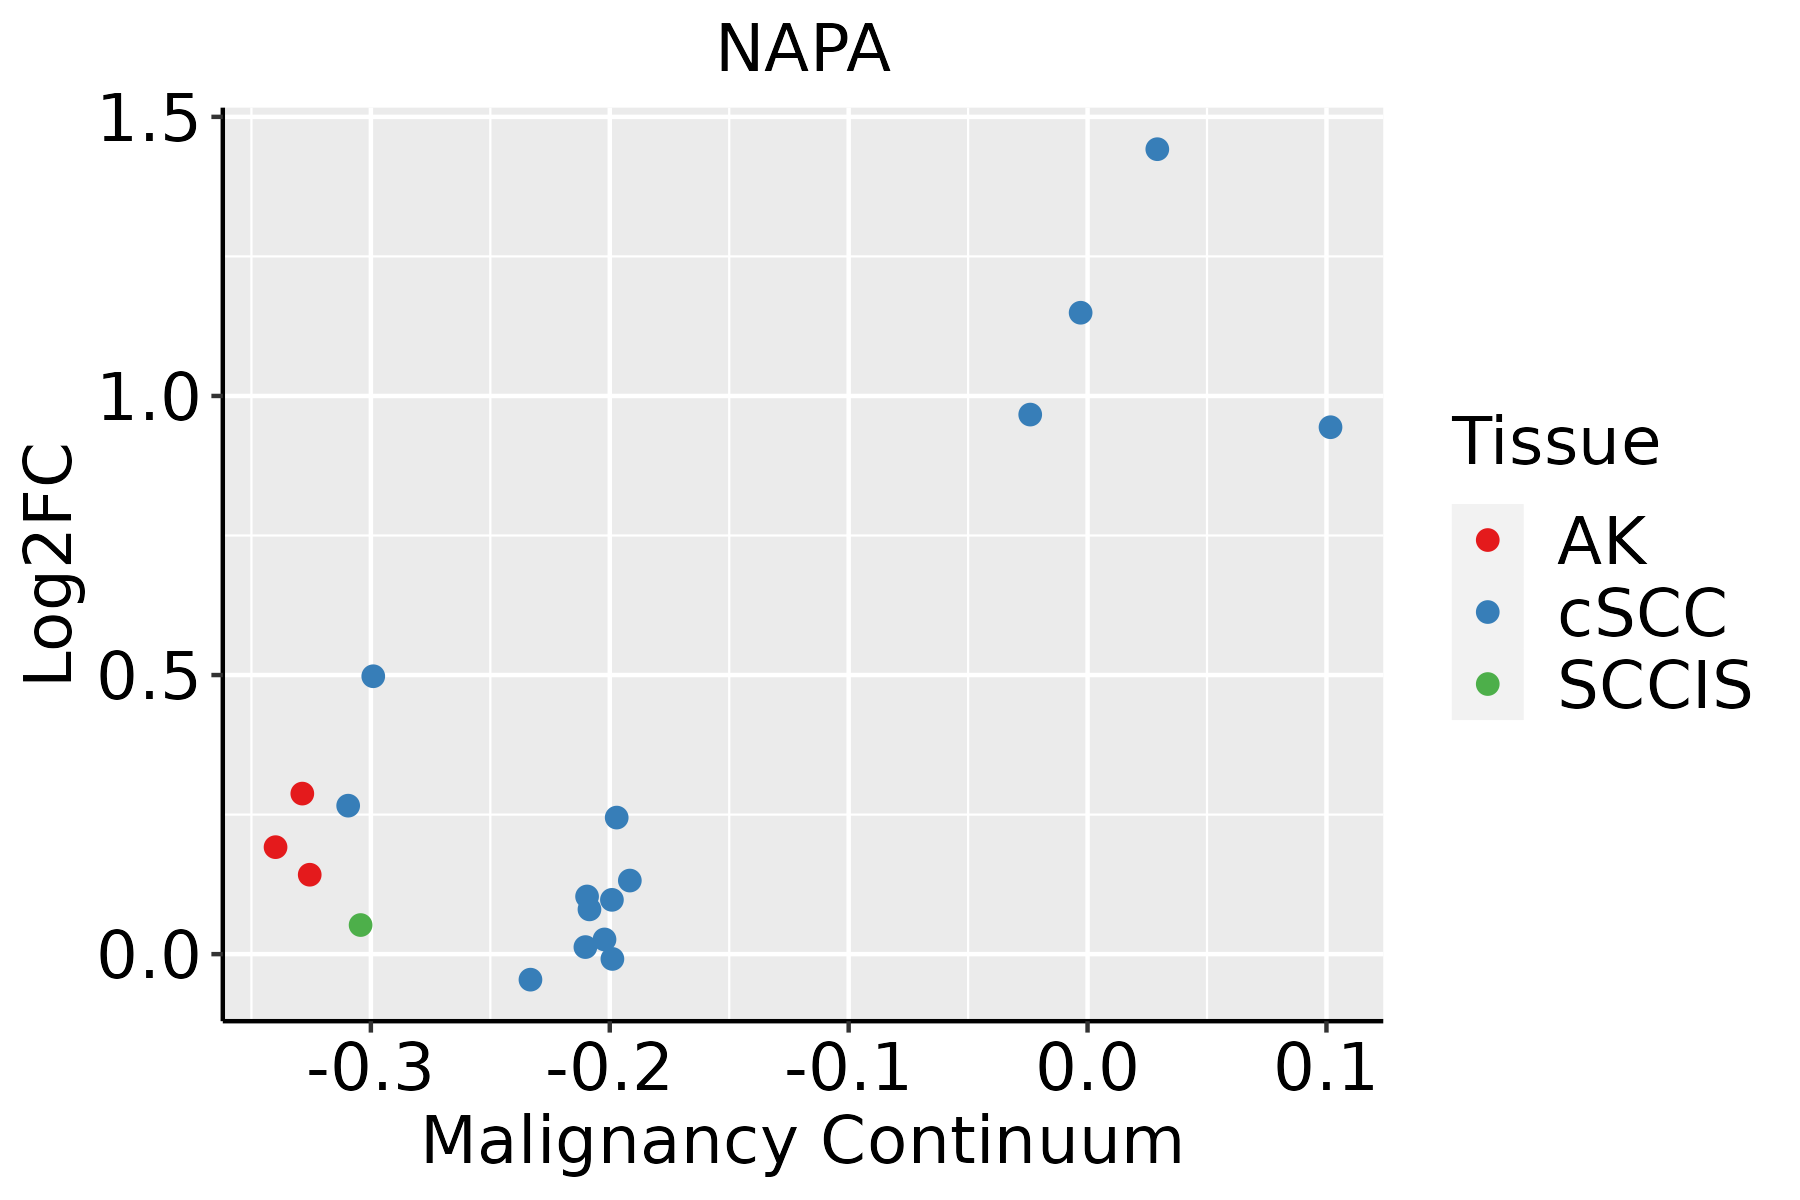 | AK: Actinic keratosis |
| cSCC: Cutaneous squamous cell carcinoma | ||
| SCCIS:squamous cell carcinoma in situ | ||
| Thyroid | 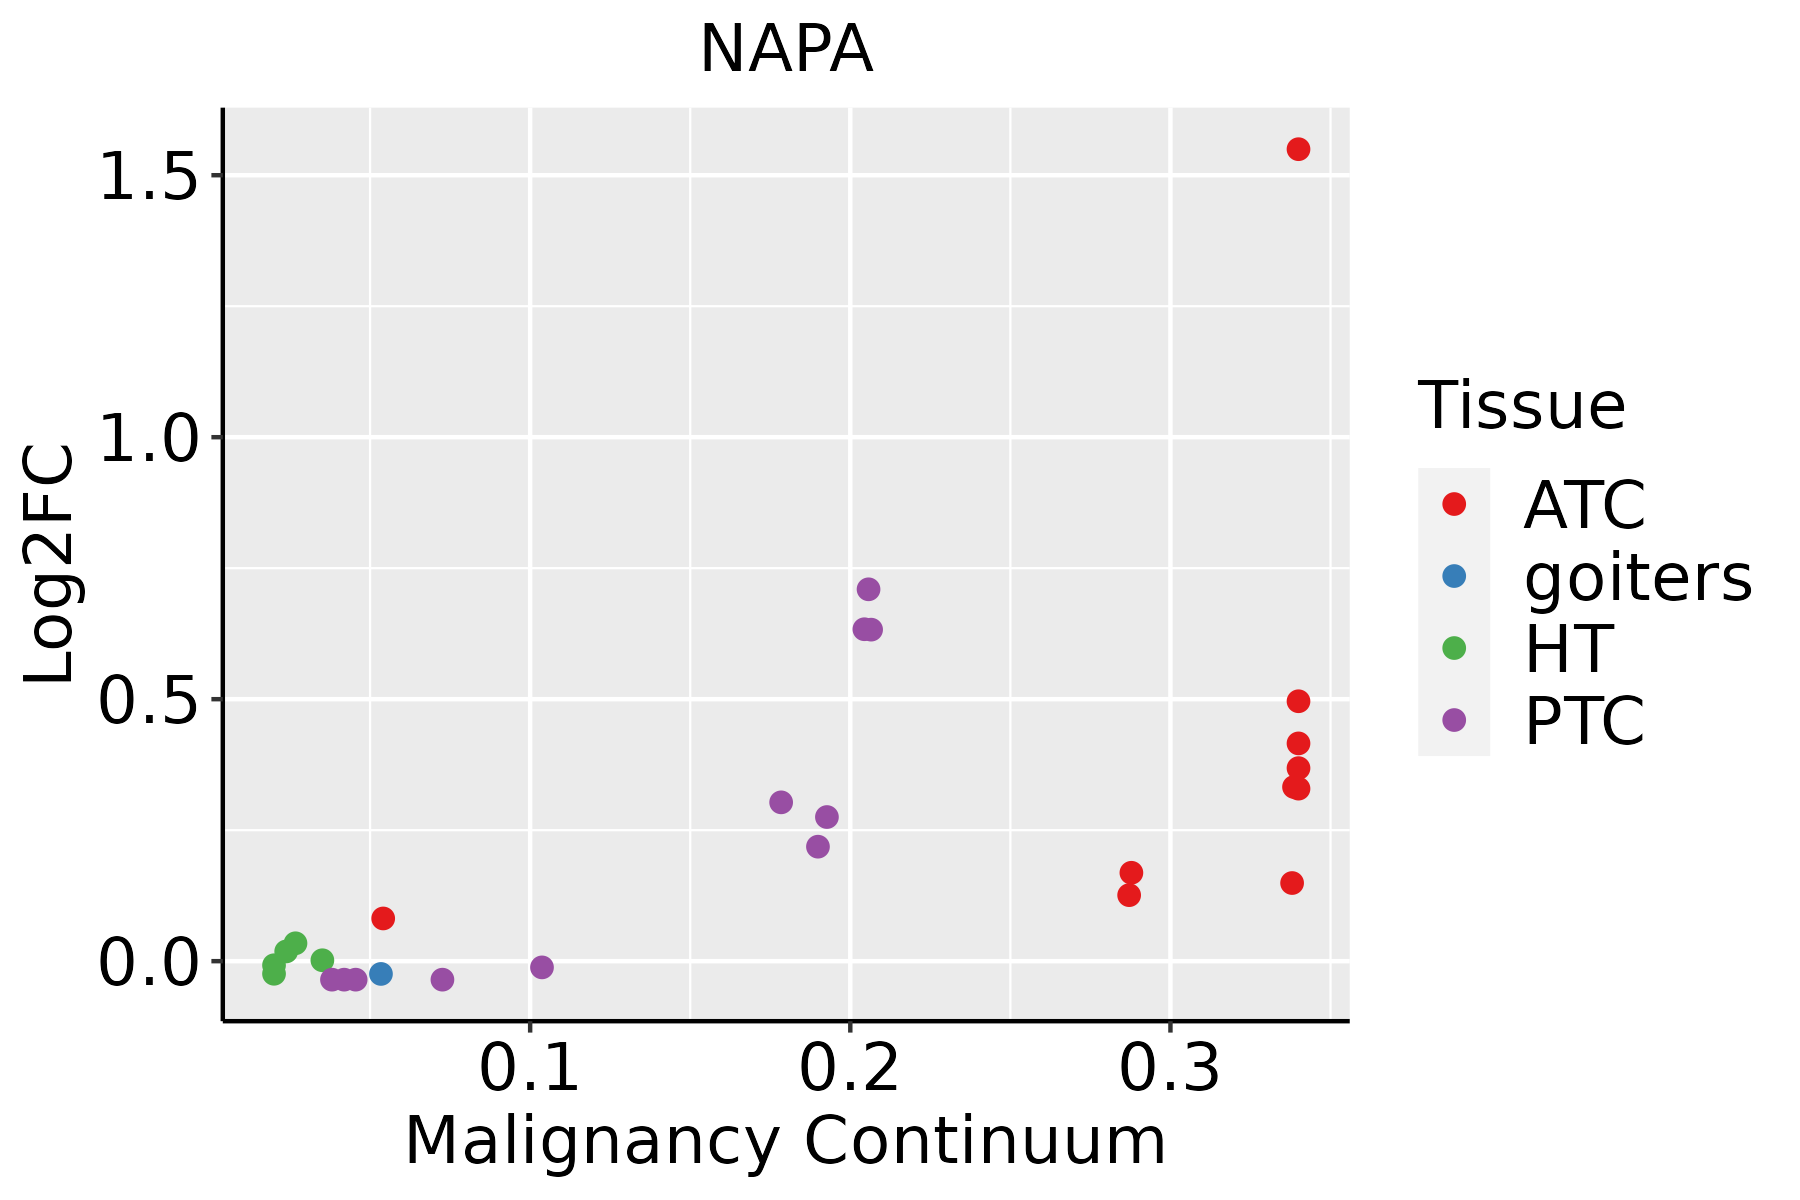 | ATC: Anaplastic thyroid cancer |
| HT: Hashimoto's thyroiditis | ||
| PTC: Papillary thyroid cancer |
| ∗log2FC in expression of this searched gene in stem-like cells from each diseased tissue sample relative to stem-like cells in normal samples in each tissue plotted against the malignancy continuum. Samples are colored based on if they are from different disease stage. |
Top |
Malignant transformation related pathway analysis |
| Find out the enriched GO biological processes and KEGG pathways involved in transition from healthy to precancer to cancer |
| Tissue | Disease Stage | Enriched GO biological Processes |
| Colorectum | AD |  |
| Colorectum | SER |  |
| Colorectum | MSS |  |
| Colorectum | MSI-H |  |
| Colorectum | FAP |  |
| ∗Top 15 enriched GO BP terms are showed in the bar plot of each disease state in each tissue. Each row represents a significant GO biological process which is colored according to the -log10(p.adjust). |
| Page: 1 2 3 4 5 6 7 8 9 |
| GO ID | Tissue | Disease Stage | Description | Gene Ratio | Bg Ratio | pvalue | p.adjust | Count |
| GO:004819317 | Esophagus | HGIN | Golgi vesicle transport | 83/2587 | 296/18723 | 8.59e-11 | 8.89e-09 | 83 |
| GO:002241120 | Esophagus | HGIN | cellular component disassembly | 102/2587 | 443/18723 | 8.31e-08 | 4.33e-06 | 102 |
| GO:004325427 | Esophagus | HGIN | regulation of protein-containing complex assembly | 94/2587 | 428/18723 | 2.39e-06 | 8.55e-05 | 94 |
| GO:003298415 | Esophagus | HGIN | protein-containing complex disassembly | 50/2587 | 224/18723 | 3.43e-04 | 5.56e-03 | 50 |
| GO:004819318 | Esophagus | ESCC | Golgi vesicle transport | 231/8552 | 296/18723 | 1.82e-30 | 9.63e-28 | 231 |
| GO:0022411111 | Esophagus | ESCC | cellular component disassembly | 305/8552 | 443/18723 | 1.94e-23 | 4.57e-21 | 305 |
| GO:0043254111 | Esophagus | ESCC | regulation of protein-containing complex assembly | 278/8552 | 428/18723 | 3.81e-16 | 2.77e-14 | 278 |
| GO:003298416 | Esophagus | ESCC | protein-containing complex disassembly | 151/8552 | 224/18723 | 3.45e-11 | 1.15e-09 | 151 |
| GO:00068914 | Esophagus | ESCC | intra-Golgi vesicle-mediated transport | 26/8552 | 33/18723 | 1.06e-04 | 7.43e-04 | 26 |
| GO:00610254 | Esophagus | ESCC | membrane fusion | 98/8552 | 163/18723 | 1.39e-04 | 9.41e-04 | 98 |
| GO:00436245 | Esophagus | ESCC | cellular protein complex disassembly | 78/8552 | 136/18723 | 4.00e-03 | 1.62e-02 | 78 |
| GO:00434627 | Esophagus | ESCC | regulation of ATPase activity | 30/8552 | 46/18723 | 5.91e-03 | 2.18e-02 | 30 |
| GO:004819311 | Liver | Cirrhotic | Golgi vesicle transport | 153/4634 | 296/18723 | 1.02e-23 | 6.43e-21 | 153 |
| GO:00224117 | Liver | Cirrhotic | cellular component disassembly | 182/4634 | 443/18723 | 1.59e-14 | 1.54e-12 | 182 |
| GO:004325412 | Liver | Cirrhotic | regulation of protein-containing complex assembly | 169/4634 | 428/18723 | 7.40e-12 | 4.99e-10 | 169 |
| GO:00329846 | Liver | Cirrhotic | protein-containing complex disassembly | 82/4634 | 224/18723 | 4.78e-05 | 5.54e-04 | 82 |
| GO:00327812 | Liver | Cirrhotic | positive regulation of ATPase activity | 16/4634 | 27/18723 | 1.41e-04 | 1.36e-03 | 16 |
| GO:00434623 | Liver | Cirrhotic | regulation of ATPase activity | 21/4634 | 46/18723 | 1.61e-03 | 1.04e-02 | 21 |
| GO:004819321 | Liver | HCC | Golgi vesicle transport | 217/7958 | 296/18723 | 2.58e-27 | 1.02e-24 | 217 |
| GO:002241112 | Liver | HCC | cellular component disassembly | 282/7958 | 443/18723 | 1.02e-19 | 1.38e-17 | 282 |
| Page: 1 2 3 4 5 6 |
| Pathway ID | Tissue | Disease Stage | Description | Gene Ratio | Bg Ratio | pvalue | p.adjust | qvalue | Count |
| Page: 1 |
Top |
Cell-cell communication analysis |
| Identification of potential cell-cell interactions between two cell types and their ligand-receptor pairs for different disease states |
| Ligand | Receptor | LRpair | Pathway | Tissue | Disease Stage |
| Page: 1 |
Top |
Single-cell gene regulatory network inference analysis |
| Find out the significant the regulons (TFs) and the target genes of each regulon across cell types for different disease states |
| TF | Cell Type | Tissue | Disease Stage | Target Gene | RSS | Regulon Activity |
| ∗The dot plots of a searched regulon are shown for all cell subpopulations in each disease state of each tissue based on the regulon specific score inferred using pySCENIC and by calculating the average expression. |
| Page: 1 |
Top |
Somatic mutation of malignant transformation related genes |
| Annotation of somatic variants for genes involved in malignant transformation |
| Hugo Symbol | Variant Class | Variant Classification | dbSNP RS | HGVSc | HGVSp | HGVSp Short | SWISSPROT | BIOTYPE | SIFT | PolyPhen | Tumor Sample Barcode | Tissue | Histology | Sex | Age | Stage | Therapy Types | Drugs | Outcome |
| NAPA | SNV | Missense_Mutation | novel | c.791N>T | p.Lys264Met | p.K264M | P54920 | protein_coding | deleterious(0) | probably_damaging(0.944) | TCGA-AC-A8OP-01 | Breast | breast invasive carcinoma | Female | >=65 | I/II | Unknown | Unknown | SD |
| NAPA | SNV | Missense_Mutation | c.698N>T | p.Pro233Leu | p.P233L | P54920 | protein_coding | deleterious(0) | possibly_damaging(0.625) | TCGA-B6-A0X5-01 | Breast | breast invasive carcinoma | Female | <65 | I/II | Unknown | Unknown | PD | |
| NAPA | SNV | Missense_Mutation | c.49N>T | p.Ala17Ser | p.A17S | P54920 | protein_coding | deleterious(0.01) | probably_damaging(0.998) | TCGA-EW-A1OZ-01 | Breast | breast invasive carcinoma | Female | <65 | I/II | Targeted Molecular therapy | trastuzumab | SD | |
| NAPA | SNV | Missense_Mutation | c.547N>C | p.Asp183His | p.D183H | P54920 | protein_coding | deleterious(0.04) | benign(0.013) | TCGA-EW-A1PB-01 | Breast | breast invasive carcinoma | Female | >=65 | III/IV | Unknown | Unknown | SD | |
| NAPA | SNV | Missense_Mutation | rs757031862 | c.799N>A | p.Asp267Asn | p.D267N | P54920 | protein_coding | tolerated(0.05) | probably_damaging(0.923) | TCGA-2W-A8YY-01 | Cervix | cervical & endocervical cancer | Female | <65 | I/II | Chemotherapy | cisplatin | CR |
| NAPA | SNV | Missense_Mutation | c.244G>A | p.Ala82Thr | p.A82T | P54920 | protein_coding | deleterious(0.02) | possibly_damaging(0.902) | TCGA-AA-3977-01 | Colorectum | colon adenocarcinoma | Male | >=65 | I/II | Unknown | Unknown | SD | |
| NAPA | SNV | Missense_Mutation | c.697N>T | p.Pro233Ser | p.P233S | P54920 | protein_coding | deleterious(0) | probably_damaging(0.947) | TCGA-CK-4951-01 | Colorectum | colon adenocarcinoma | Female | >=65 | I/II | Unknown | Unknown | PD | |
| NAPA | SNV | Missense_Mutation | c.127N>A | p.Glu43Lys | p.E43K | P54920 | protein_coding | deleterious(0.01) | benign(0.265) | TCGA-AG-3892-01 | Colorectum | rectum adenocarcinoma | Female | <65 | I/II | Unknown | Unknown | SD | |
| NAPA | SNV | Missense_Mutation | novel | c.610G>T | p.Asp204Tyr | p.D204Y | P54920 | protein_coding | deleterious(0.03) | possibly_damaging(0.694) | TCGA-A5-A0G2-01 | Endometrium | uterine corpus endometrioid carcinoma | Female | <65 | III/IV | Unknown | Unknown | SD |
| NAPA | SNV | Missense_Mutation | novel | c.505G>A | p.Ala169Thr | p.A169T | P54920 | protein_coding | deleterious(0.01) | probably_damaging(0.959) | TCGA-A5-A0G2-01 | Endometrium | uterine corpus endometrioid carcinoma | Female | <65 | III/IV | Unknown | Unknown | SD |
| Page: 1 2 3 |
Top |
Related drugs of malignant transformation related genes |
| Identification of chemicals and drugs interact with genes involved in malignant transfromation |
| (DGIdb 4.0) |
| Entrez ID | Symbol | Category | Interaction Types | Drug Claim Name | Drug Name | PMIDs |
| Page: 1 |

Copyright 2023-Present -The University of Texas Health Science Center at Houston |