
|
|||||
|
 | |
| |
| |
| |
| |
| |
|
Gene: NAMPT |
Gene summary for NAMPT |
| Gene information | Species | Human | Gene symbol | NAMPT | Gene ID | 10135 |
| Gene name | nicotinamide phosphoribosyltransferase | |
| Gene Alias | 1110035O14Rik | |
| Cytomap | 7q22.3 | |
| Gene Type | protein-coding | GO ID | GO:0000003 | UniProtAcc | A0A024R718 |
Top |
Malignant transformation analysis |
| Identification of the aberrant gene expression in precancerous and cancerous lesions by comparing the gene expression of stem-like cells in diseased tissues with normal stem cells |
| Entrez ID | Symbol | Replicates | Species | Organ | Tissue | Adj P-value | Log2FC | Malignancy |
| 10135 | NAMPT | GSM4909281 | Human | Breast | IDC | 1.29e-09 | -4.37e-01 | 0.21 |
| 10135 | NAMPT | GSM4909282 | Human | Breast | IDC | 4.52e-10 | -4.00e-01 | -0.0288 |
| 10135 | NAMPT | GSM4909285 | Human | Breast | IDC | 1.88e-13 | -4.70e-01 | 0.21 |
| 10135 | NAMPT | GSM4909286 | Human | Breast | IDC | 4.76e-18 | -5.48e-01 | 0.1081 |
| 10135 | NAMPT | GSM4909287 | Human | Breast | IDC | 6.48e-07 | -3.93e-01 | 0.2057 |
| 10135 | NAMPT | GSM4909290 | Human | Breast | IDC | 1.21e-05 | -4.33e-01 | 0.2096 |
| 10135 | NAMPT | GSM4909291 | Human | Breast | IDC | 1.70e-07 | -4.85e-01 | 0.1753 |
| 10135 | NAMPT | GSM4909293 | Human | Breast | IDC | 8.04e-04 | -2.38e-01 | 0.1581 |
| 10135 | NAMPT | GSM4909294 | Human | Breast | IDC | 9.38e-10 | -3.96e-01 | 0.2022 |
| 10135 | NAMPT | GSM4909296 | Human | Breast | IDC | 5.19e-11 | -3.36e-01 | 0.1524 |
| 10135 | NAMPT | GSM4909297 | Human | Breast | IDC | 9.06e-34 | -6.35e-01 | 0.1517 |
| 10135 | NAMPT | GSM4909298 | Human | Breast | IDC | 1.25e-21 | -5.97e-01 | 0.1551 |
| 10135 | NAMPT | GSM4909301 | Human | Breast | IDC | 1.66e-10 | -4.63e-01 | 0.1577 |
| 10135 | NAMPT | GSM4909302 | Human | Breast | IDC | 5.41e-04 | -3.21e-01 | 0.1545 |
| 10135 | NAMPT | GSM4909304 | Human | Breast | IDC | 3.27e-03 | -3.78e-01 | 0.1636 |
| 10135 | NAMPT | GSM4909306 | Human | Breast | IDC | 4.13e-12 | -5.11e-01 | 0.1564 |
| 10135 | NAMPT | GSM4909307 | Human | Breast | IDC | 6.15e-26 | -6.28e-01 | 0.1569 |
| 10135 | NAMPT | GSM4909308 | Human | Breast | IDC | 1.15e-05 | -3.76e-01 | 0.158 |
| 10135 | NAMPT | GSM4909309 | Human | Breast | IDC | 2.02e-08 | -4.03e-01 | 0.0483 |
| 10135 | NAMPT | GSM4909311 | Human | Breast | IDC | 6.20e-46 | -7.02e-01 | 0.1534 |
| Page: 1 2 3 4 5 6 7 8 9 10 11 12 13 14 |
| Tissue | Expression Dynamics | Abbreviation |
| Breast | 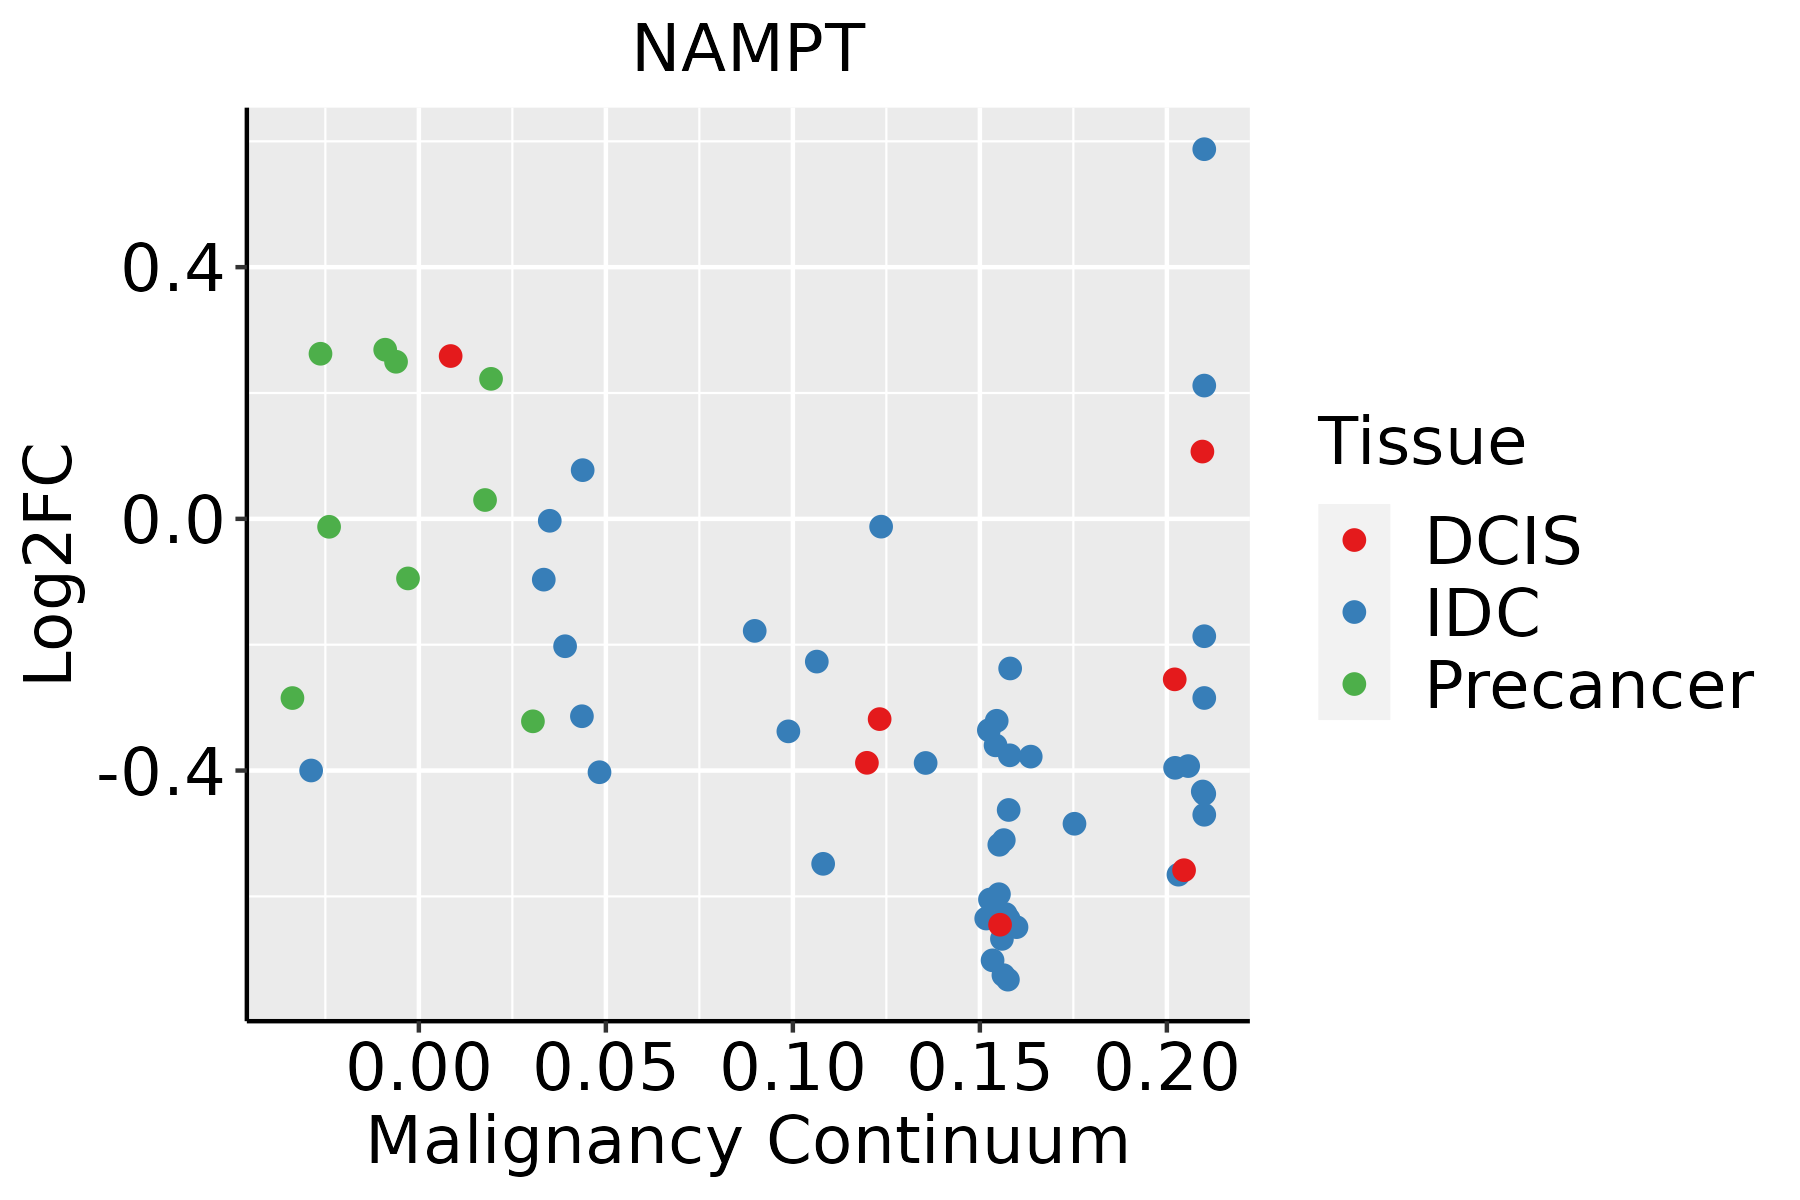 | IDC: Invasive ductal carcinoma |
| DCIS: Ductal carcinoma in situ | ||
| Precancer(BRCA1-mut): Precancerous lesion from BRCA1 mutation carriers | ||
| Endometrium |  | AEH: Atypical endometrial hyperplasia |
| EEC: Endometrioid Cancer | ||
| Esophagus | 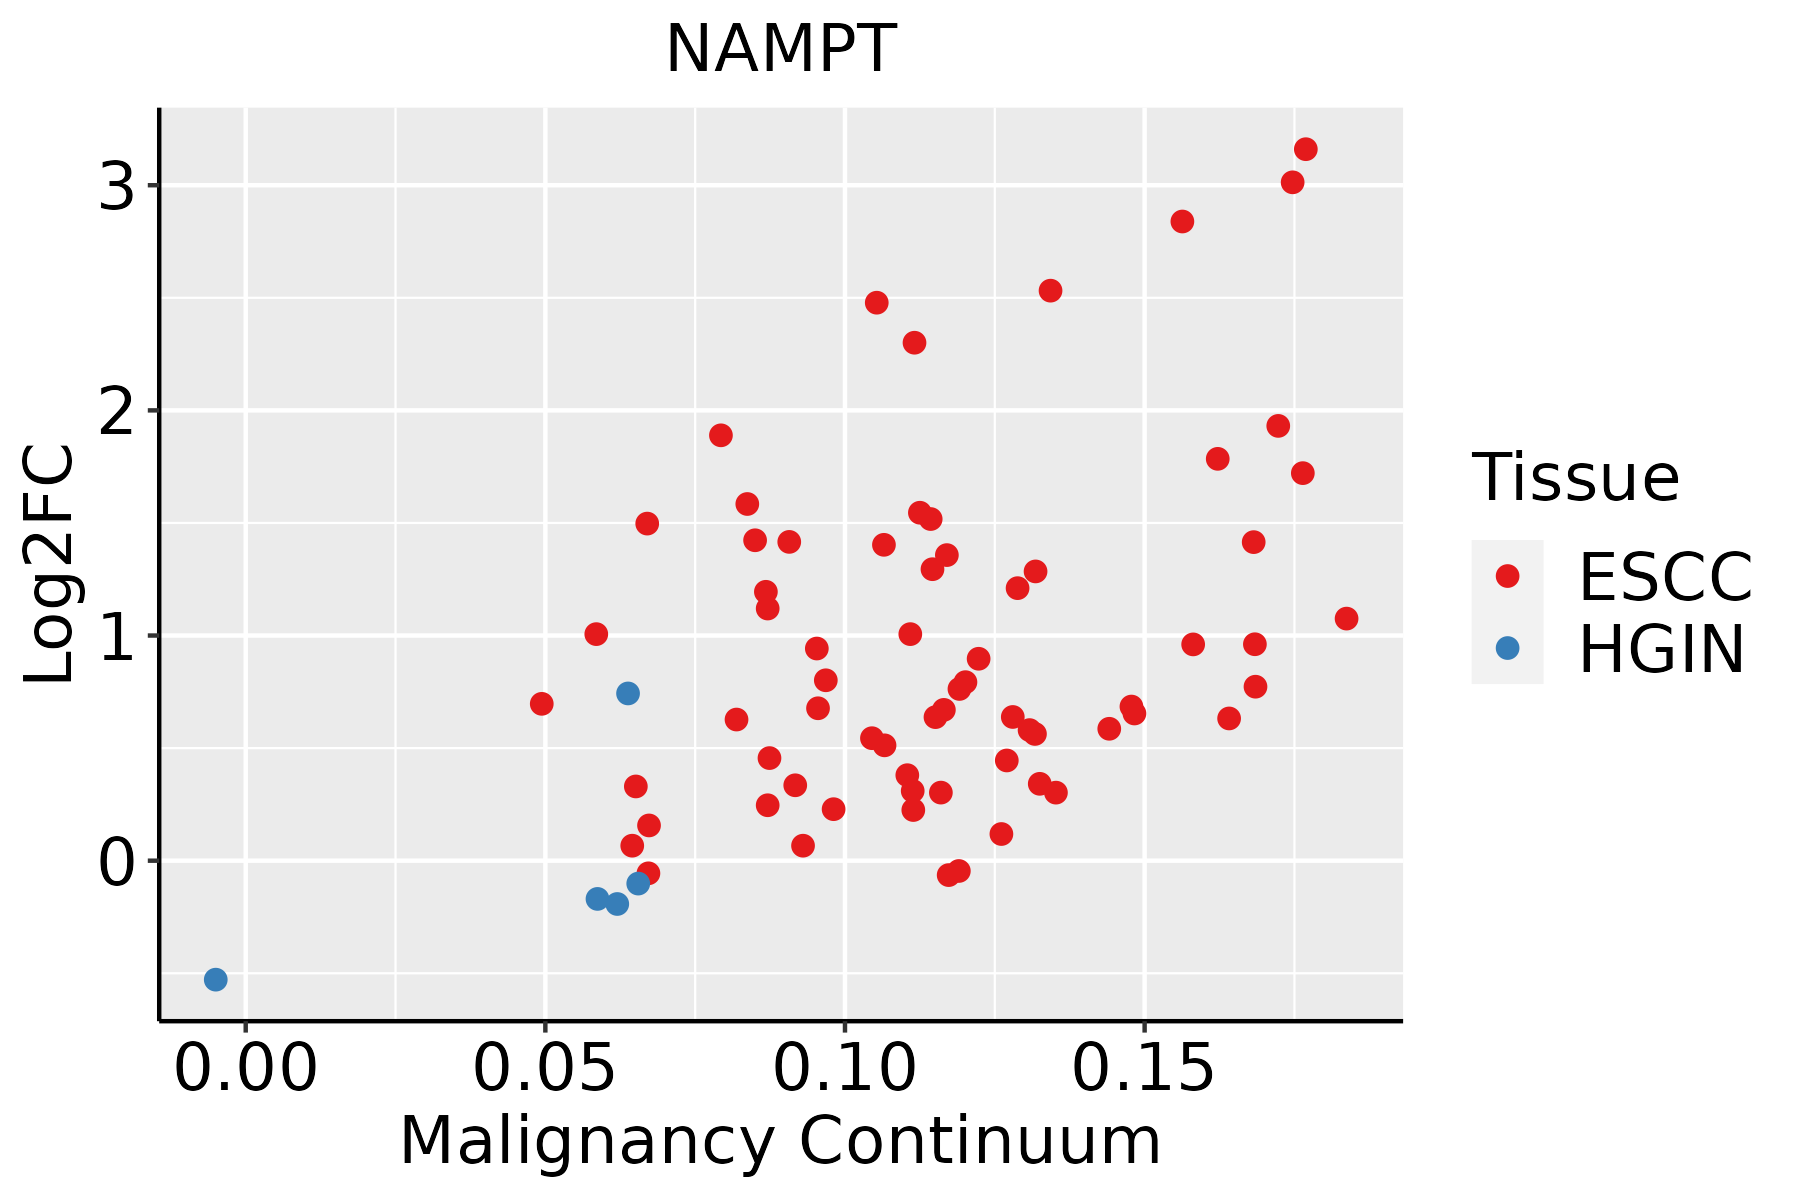 | ESCC: Esophageal squamous cell carcinoma |
| HGIN: High-grade intraepithelial neoplasias | ||
| LGIN: Low-grade intraepithelial neoplasias | ||
| GC |  | CAG: Chronic atrophic gastritis |
| CAG with IM: Chronic atrophic gastritis with intestinal metaplasia | ||
| CSG: Chronic superficial gastritis | ||
| GC: Gastric cancer | ||
| SIM: Severe intestinal metaplasia | ||
| WIM: Wild intestinal metaplasia | ||
| Liver | 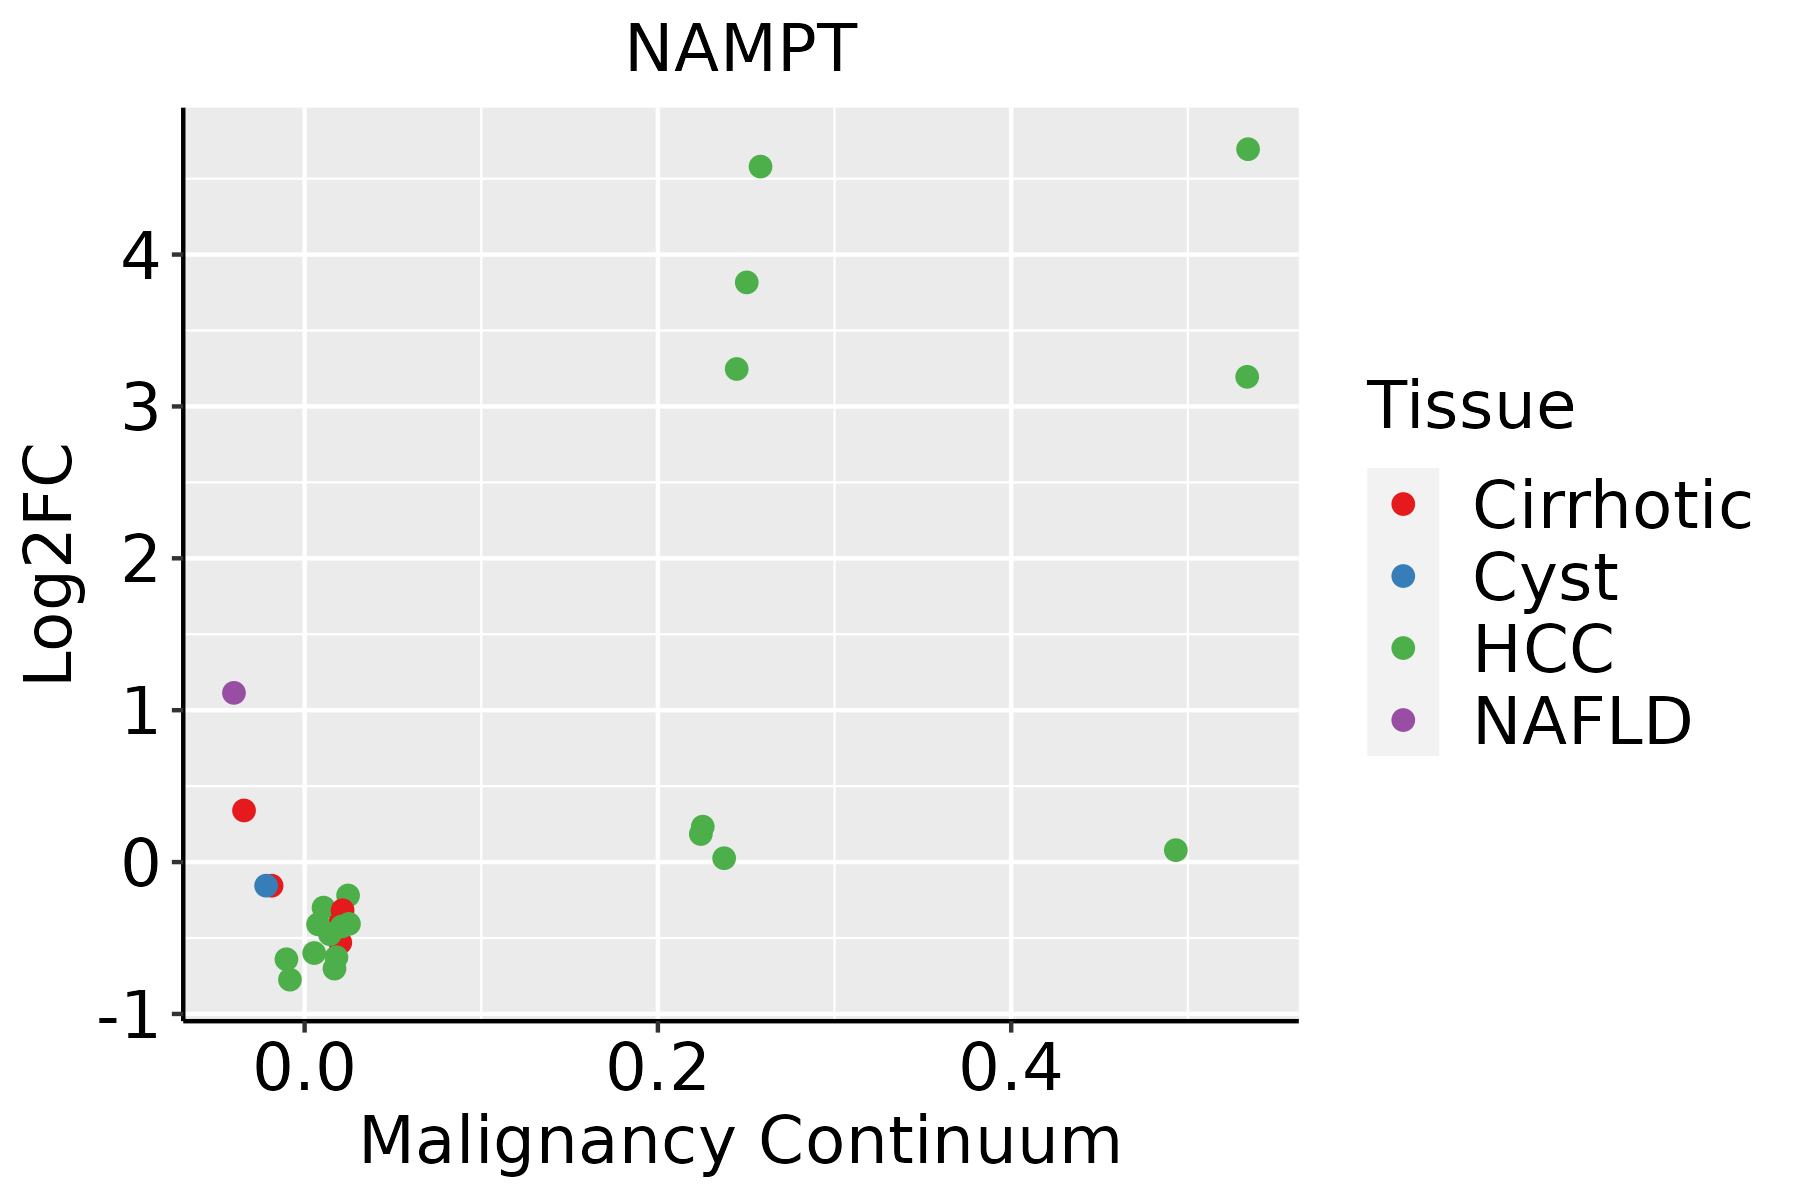 | HCC: Hepatocellular carcinoma |
| NAFLD: Non-alcoholic fatty liver disease | ||
| Lung | 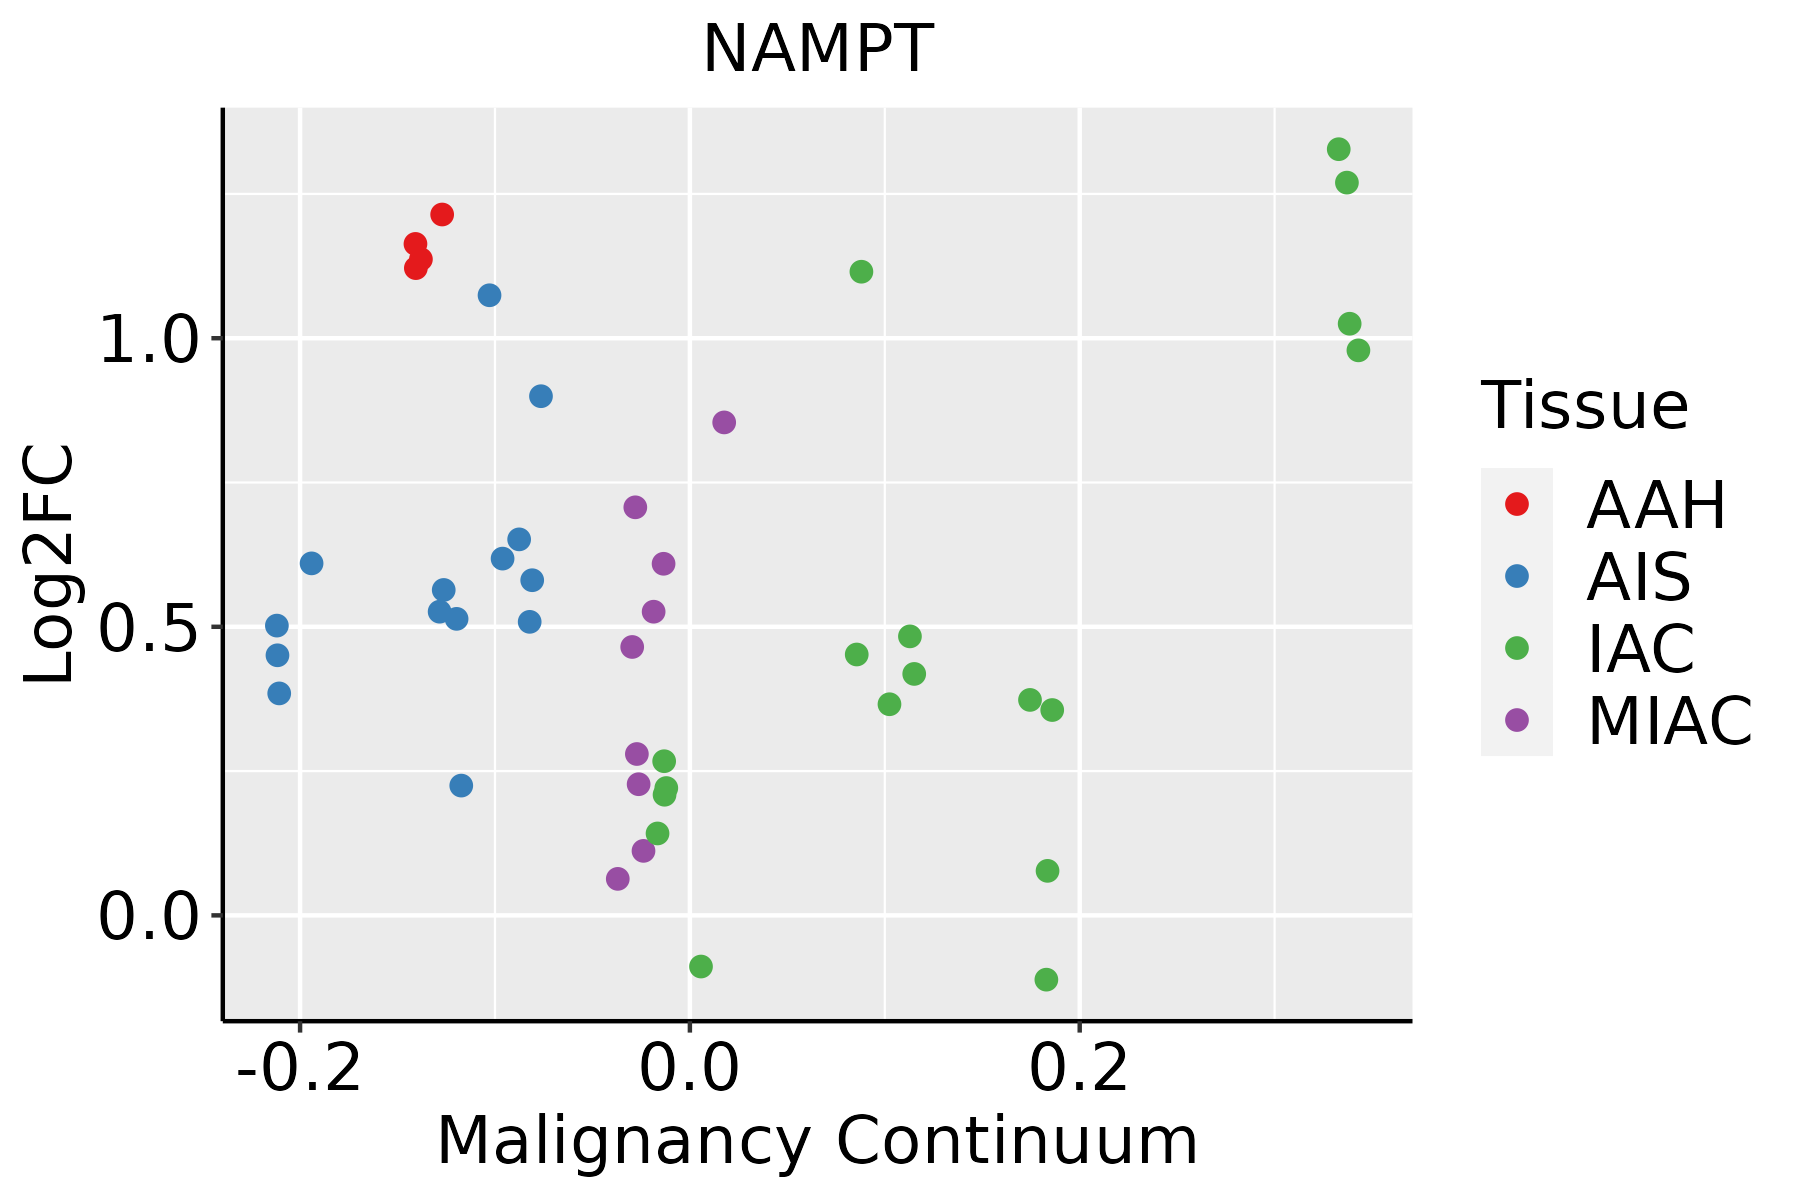 | AAH: Atypical adenomatous hyperplasia |
| AIS: Adenocarcinoma in situ | ||
| IAC: Invasive lung adenocarcinoma | ||
| MIA: Minimally invasive adenocarcinoma | ||
| Oral Cavity |  | EOLP: Erosive Oral lichen planus |
| LP: leukoplakia | ||
| NEOLP: Non-erosive oral lichen planus | ||
| OSCC: Oral squamous cell carcinoma | ||
| Prostate | 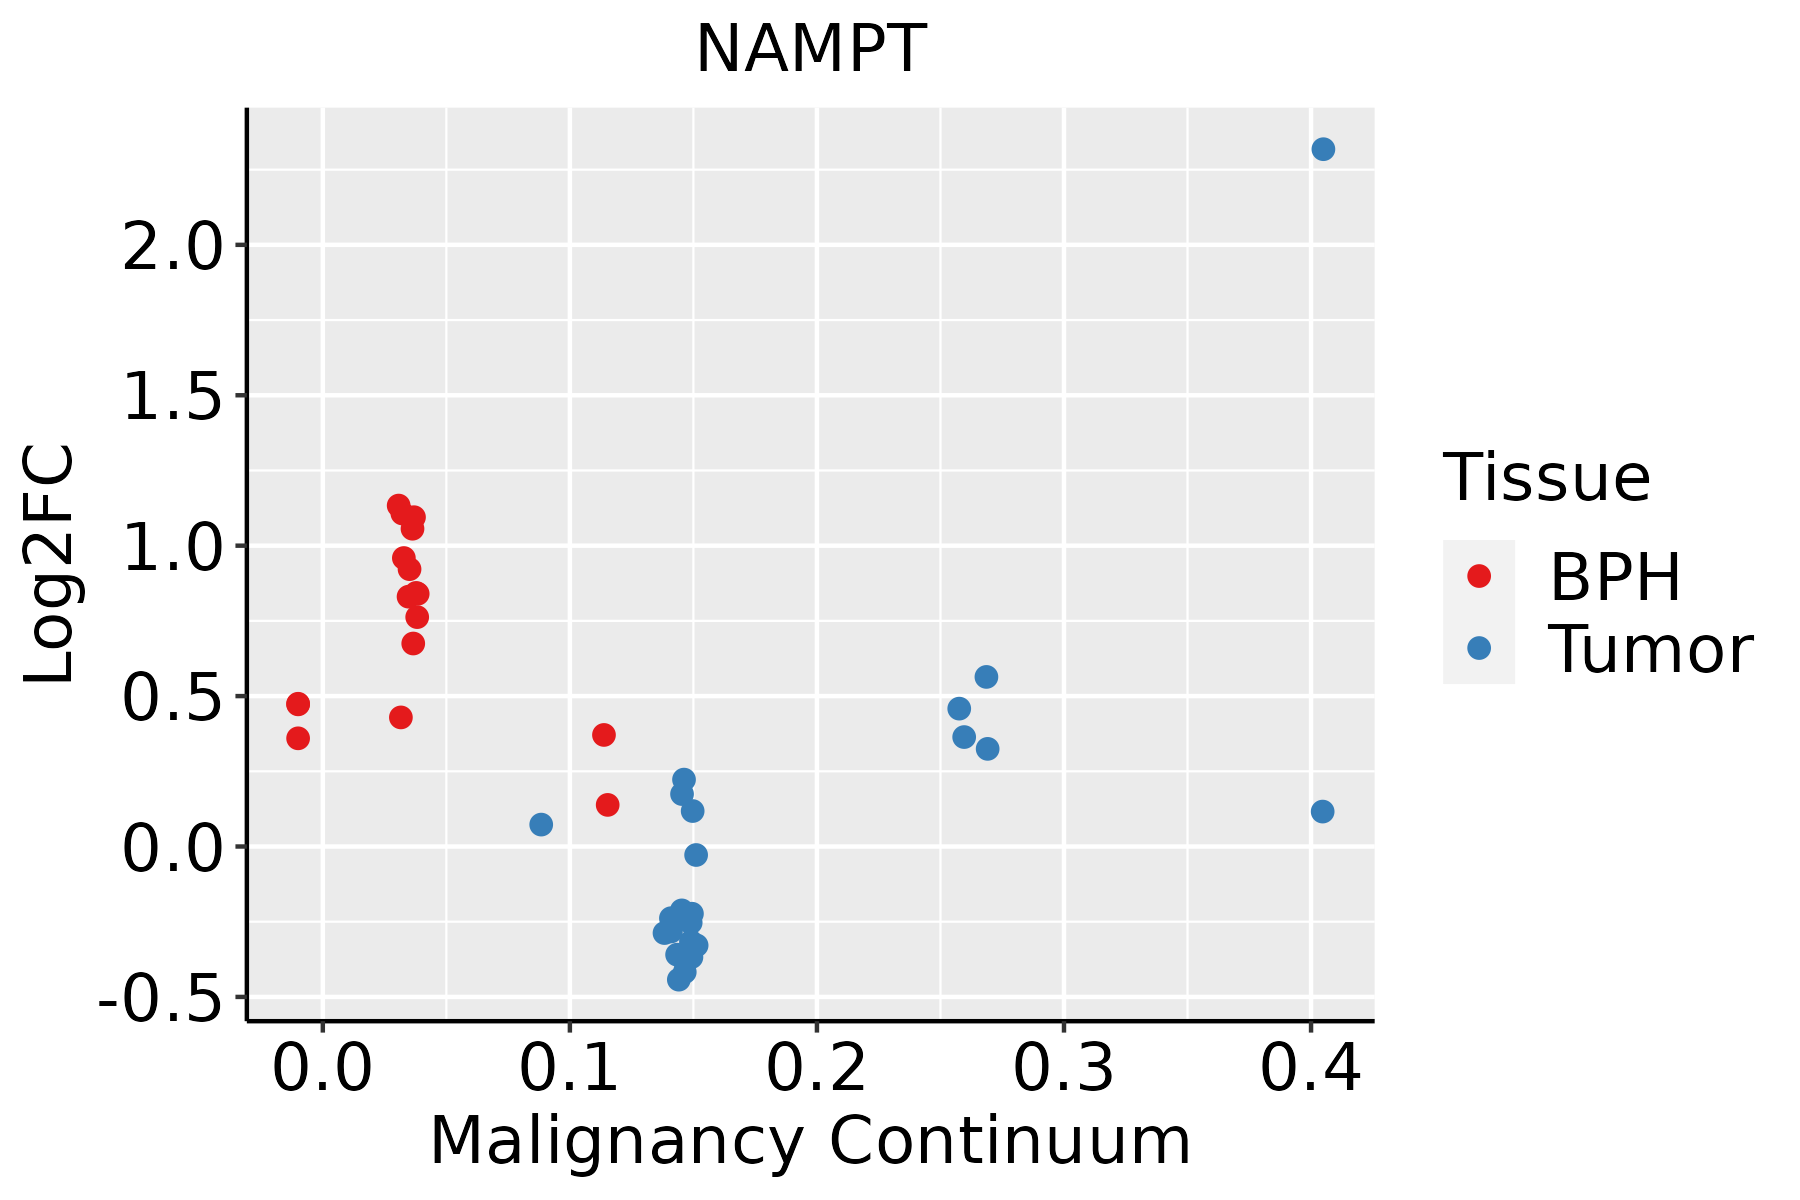 | BPH: Benign Prostatic Hyperplasia |
| Skin | 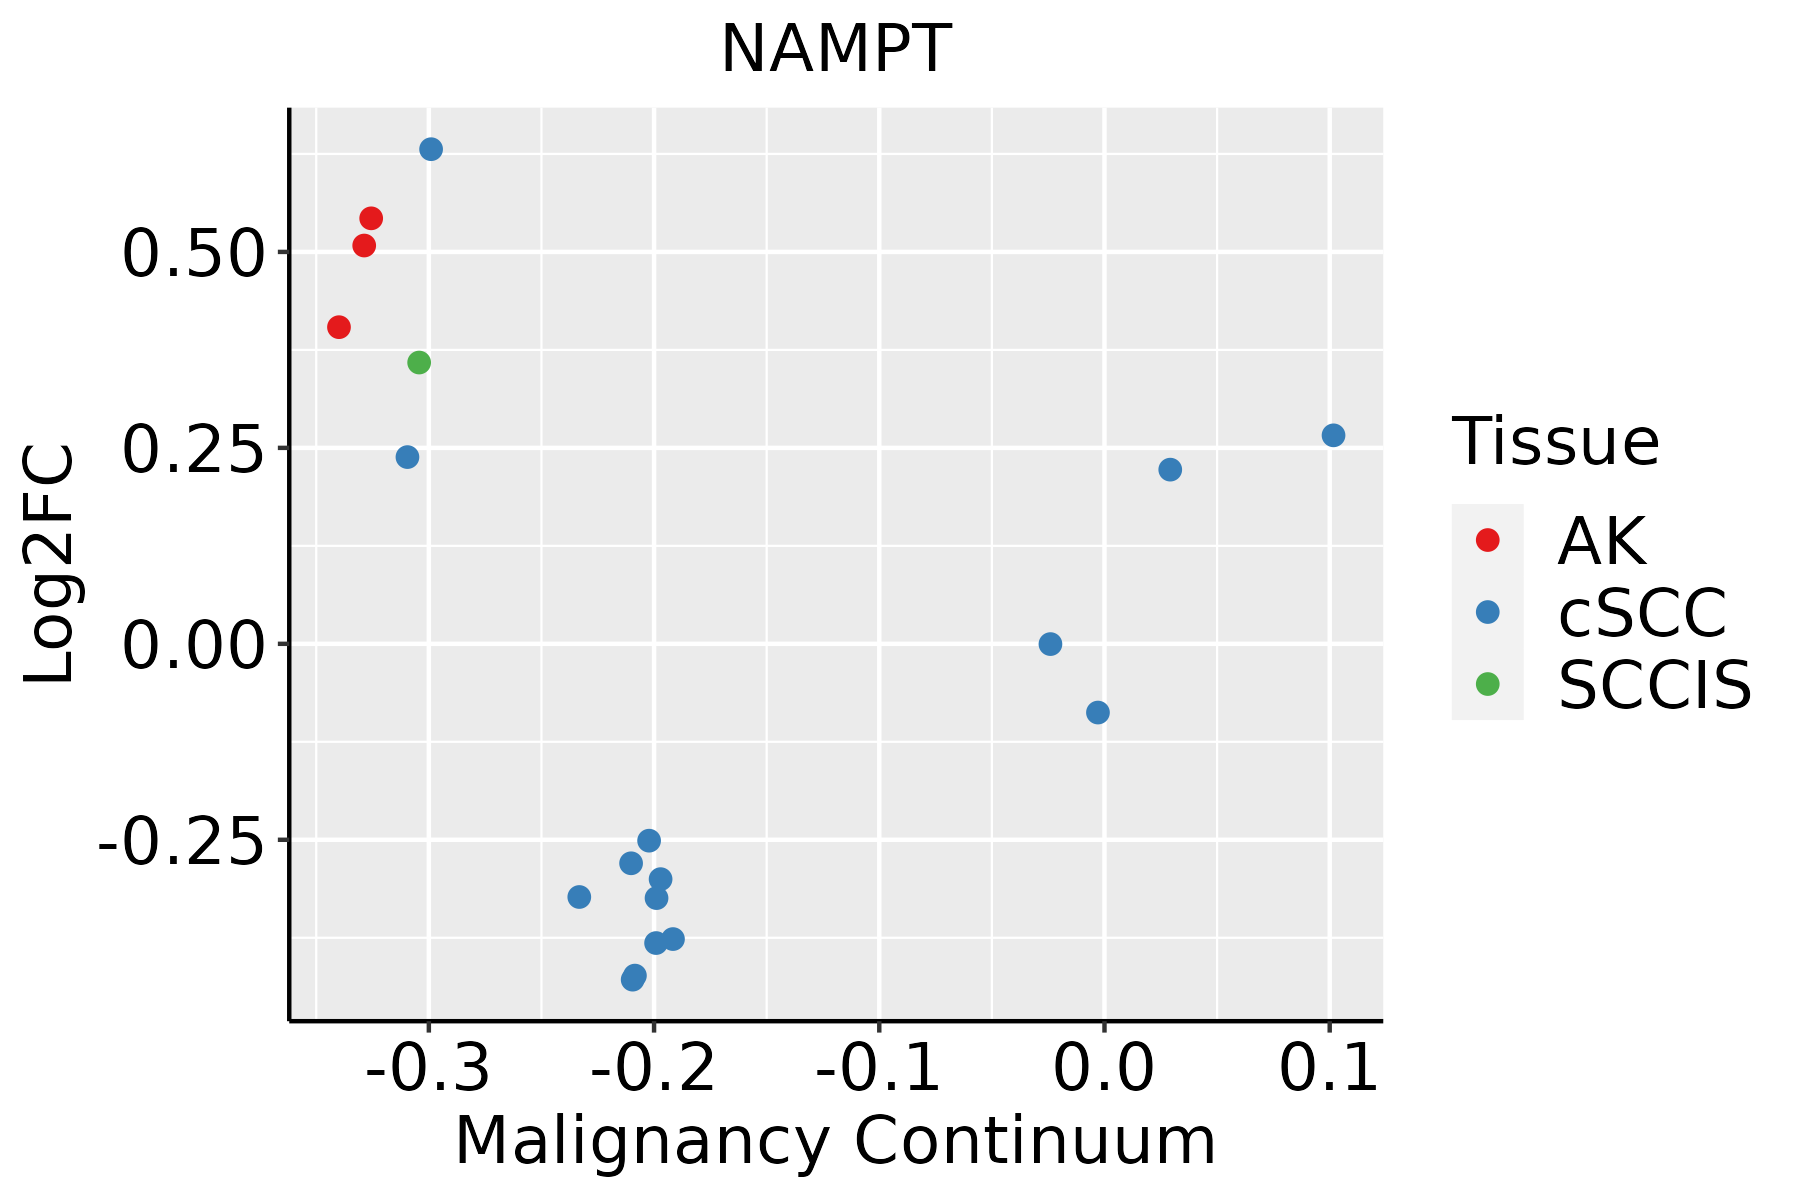 | AK: Actinic keratosis |
| cSCC: Cutaneous squamous cell carcinoma | ||
| SCCIS:squamous cell carcinoma in situ | ||
| Thyroid |  | ATC: Anaplastic thyroid cancer |
| HT: Hashimoto's thyroiditis | ||
| PTC: Papillary thyroid cancer |
| ∗log2FC in expression of this searched gene in stem-like cells from each diseased tissue sample relative to stem-like cells in normal samples in each tissue plotted against the malignancy continuum. Samples are colored based on if they are from different disease stage. |
Top |
Malignant transformation related pathway analysis |
| Find out the enriched GO biological processes and KEGG pathways involved in transition from healthy to precancer to cancer |
| Tissue | Disease Stage | Enriched GO biological Processes |
| Colorectum | AD |  |
| Colorectum | SER |  |
| Colorectum | MSS |  |
| Colorectum | MSI-H |  |
| Colorectum | FAP |  |
| ∗Top 15 enriched GO BP terms are showed in the bar plot of each disease state in each tissue. Each row represents a significant GO biological process which is colored according to the -log10(p.adjust). |
| Page: 1 2 3 4 5 6 7 8 9 |
| GO ID | Tissue | Disease Stage | Description | Gene Ratio | Bg Ratio | pvalue | p.adjust | Count |
| GO:00362939 | Breast | Precancer | response to decreased oxygen levels | 53/1080 | 322/18723 | 4.09e-12 | 6.84e-10 | 53 |
| GO:00704829 | Breast | Precancer | response to oxygen levels | 55/1080 | 347/18723 | 7.47e-12 | 1.11e-09 | 55 |
| GO:00362948 | Breast | Precancer | cellular response to decreased oxygen levels | 31/1080 | 161/18723 | 2.61e-09 | 2.11e-07 | 31 |
| GO:00714538 | Breast | Precancer | cellular response to oxygen levels | 32/1080 | 177/18723 | 7.32e-09 | 5.52e-07 | 32 |
| GO:00709979 | Breast | Precancer | neuron death | 50/1080 | 361/18723 | 7.75e-09 | 5.70e-07 | 50 |
| GO:00091179 | Breast | Precancer | nucleotide metabolic process | 56/1080 | 489/18723 | 7.40e-07 | 3.00e-05 | 56 |
| GO:00067539 | Breast | Precancer | nucleoside phosphate metabolic process | 56/1080 | 497/18723 | 1.24e-06 | 4.70e-05 | 56 |
| GO:00075653 | Breast | Precancer | female pregnancy | 29/1080 | 193/18723 | 2.07e-06 | 7.31e-05 | 29 |
| GO:00447063 | Breast | Precancer | multi-multicellular organism process | 31/1080 | 220/18723 | 3.73e-06 | 1.19e-04 | 31 |
| GO:00075688 | Breast | Precancer | aging | 41/1080 | 339/18723 | 5.95e-06 | 1.71e-04 | 41 |
| GO:00313309 | Breast | Precancer | negative regulation of cellular catabolic process | 34/1080 | 262/18723 | 8.16e-06 | 2.20e-04 | 34 |
| GO:00091655 | Breast | Precancer | nucleotide biosynthetic process | 32/1080 | 254/18723 | 2.72e-05 | 6.21e-04 | 32 |
| GO:19012935 | Breast | Precancer | nucleoside phosphate biosynthetic process | 32/1080 | 256/18723 | 3.18e-05 | 6.97e-04 | 32 |
| GO:00342849 | Breast | Precancer | response to monosaccharide | 29/1080 | 225/18723 | 4.19e-05 | 9.00e-04 | 29 |
| GO:00097439 | Breast | Precancer | response to carbohydrate | 31/1080 | 253/18723 | 6.15e-05 | 1.25e-03 | 31 |
| GO:00093148 | Breast | Precancer | response to radiation | 47/1080 | 456/18723 | 8.39e-05 | 1.62e-03 | 47 |
| GO:00712147 | Breast | Precancer | cellular response to abiotic stimulus | 37/1080 | 331/18723 | 9.12e-05 | 1.73e-03 | 37 |
| GO:01040047 | Breast | Precancer | cellular response to environmental stimulus | 37/1080 | 331/18723 | 9.12e-05 | 1.73e-03 | 37 |
| GO:00098959 | Breast | Precancer | negative regulation of catabolic process | 36/1080 | 320/18723 | 9.92e-05 | 1.83e-03 | 36 |
| GO:00102125 | Breast | Precancer | response to ionizing radiation | 21/1080 | 148/18723 | 1.19e-04 | 2.13e-03 | 21 |
| Page: 1 2 3 4 5 6 7 8 9 10 11 12 13 14 15 16 17 18 19 20 21 22 23 24 25 26 27 28 29 30 31 32 33 34 35 36 37 38 39 40 41 42 43 44 45 |
| Pathway ID | Tissue | Disease Stage | Description | Gene Ratio | Bg Ratio | pvalue | p.adjust | qvalue | Count |
| hsa046219 | Esophagus | HGIN | NOD-like receptor signaling pathway | 45/1383 | 186/8465 | 3.40e-03 | 2.54e-02 | 2.02e-02 | 45 |
| hsa0462114 | Esophagus | HGIN | NOD-like receptor signaling pathway | 45/1383 | 186/8465 | 3.40e-03 | 2.54e-02 | 2.02e-02 | 45 |
| hsa0462122 | Esophagus | ESCC | NOD-like receptor signaling pathway | 116/4205 | 186/8465 | 2.90e-04 | 1.03e-03 | 5.30e-04 | 116 |
| hsa0462132 | Esophagus | ESCC | NOD-like receptor signaling pathway | 116/4205 | 186/8465 | 2.90e-04 | 1.03e-03 | 5.30e-04 | 116 |
| hsa046212 | Lung | IAC | NOD-like receptor signaling pathway | 38/1053 | 186/8465 | 1.23e-03 | 8.24e-03 | 5.47e-03 | 38 |
| hsa0462111 | Lung | IAC | NOD-like receptor signaling pathway | 38/1053 | 186/8465 | 1.23e-03 | 8.24e-03 | 5.47e-03 | 38 |
| hsa046218 | Oral cavity | OSCC | NOD-like receptor signaling pathway | 108/3704 | 186/8465 | 5.13e-05 | 2.07e-04 | 1.05e-04 | 108 |
| hsa0462113 | Oral cavity | OSCC | NOD-like receptor signaling pathway | 108/3704 | 186/8465 | 5.13e-05 | 2.07e-04 | 1.05e-04 | 108 |
| hsa0462121 | Oral cavity | LP | NOD-like receptor signaling pathway | 73/2418 | 186/8465 | 9.80e-04 | 4.53e-03 | 2.92e-03 | 73 |
| hsa0462131 | Oral cavity | LP | NOD-like receptor signaling pathway | 73/2418 | 186/8465 | 9.80e-04 | 4.53e-03 | 2.92e-03 | 73 |
| hsa046214 | Oral cavity | EOLP | NOD-like receptor signaling pathway | 48/1218 | 186/8465 | 2.51e-05 | 1.31e-04 | 7.70e-05 | 48 |
| hsa046215 | Oral cavity | EOLP | NOD-like receptor signaling pathway | 48/1218 | 186/8465 | 2.51e-05 | 1.31e-04 | 7.70e-05 | 48 |
| hsa046216 | Oral cavity | NEOLP | NOD-like receptor signaling pathway | 39/1112 | 186/8465 | 1.79e-03 | 7.91e-03 | 4.98e-03 | 39 |
| hsa046217 | Oral cavity | NEOLP | NOD-like receptor signaling pathway | 39/1112 | 186/8465 | 1.79e-03 | 7.91e-03 | 4.98e-03 | 39 |
| hsa04621 | Stomach | WIM | NOD-like receptor signaling pathway | 15/284 | 186/8465 | 1.44e-03 | 1.30e-02 | 1.04e-02 | 15 |
| hsa046211 | Stomach | WIM | NOD-like receptor signaling pathway | 15/284 | 186/8465 | 1.44e-03 | 1.30e-02 | 1.04e-02 | 15 |
| Page: 1 |
Top |
Cell-cell communication analysis |
| Identification of potential cell-cell interactions between two cell types and their ligand-receptor pairs for different disease states |
| Ligand | Receptor | LRpair | Pathway | Tissue | Disease Stage |
| NAMPT | INSR | NAMPT_INSR | VISFATIN | Breast | ADJ |
| NAMPT | ITGA5_ITGB1 | NAMPT_ITGA5_ITGB1 | VISFATIN | Breast | ADJ |
| NAMPT | ITGA5_ITGB1 | NAMPT_ITGA5_ITGB1 | VISFATIN | Breast | DCIS |
| NAMPT | INSR | NAMPT_INSR | VISFATIN | Breast | Healthy |
| NAMPT | ITGA5_ITGB1 | NAMPT_ITGA5_ITGB1 | VISFATIN | Breast | Healthy |
| NAMPT | INSR | NAMPT_INSR | VISFATIN | Breast | IDC |
| NAMPT | ITGA5_ITGB1 | NAMPT_ITGA5_ITGB1 | VISFATIN | Breast | IDC |
| NAMPT | INSR | NAMPT_INSR | VISFATIN | Breast | Precancer |
| NAMPT | ITGA5_ITGB1 | NAMPT_ITGA5_ITGB1 | VISFATIN | Breast | Precancer |
| NAMPT | INSR | NAMPT_INSR | VISFATIN | Cervix | ADJ |
| NAMPT | ITGA5_ITGB1 | NAMPT_ITGA5_ITGB1 | VISFATIN | Cervix | ADJ |
| NAMPT | INSR | NAMPT_INSR | VISFATIN | Cervix | Healthy |
| NAMPT | INSR | NAMPT_INSR | VISFATIN | Cervix | Precancer |
| NAMPT | ITGA5_ITGB1 | NAMPT_ITGA5_ITGB1 | VISFATIN | Cervix | Precancer |
| NAMPT | INSR | NAMPT_INSR | VISFATIN | CRC | ADJ |
| NAMPT | ITGA5_ITGB1 | NAMPT_ITGA5_ITGB1 | VISFATIN | CRC | ADJ |
| NAMPT | INSR | NAMPT_INSR | VISFATIN | CRC | CRC |
| NAMPT | ITGA5_ITGB1 | NAMPT_ITGA5_ITGB1 | VISFATIN | CRC | CRC |
| NAMPT | INSR | NAMPT_INSR | VISFATIN | CRC | FAP |
| NAMPT | INSR | NAMPT_INSR | VISFATIN | CRC | Healthy |
| Page: 1 2 3 4 5 |
Top |
Single-cell gene regulatory network inference analysis |
| Find out the significant the regulons (TFs) and the target genes of each regulon across cell types for different disease states |
| TF | Cell Type | Tissue | Disease Stage | Target Gene | RSS | Regulon Activity |
| ∗The dot plots of a searched regulon are shown for all cell subpopulations in each disease state of each tissue based on the regulon specific score inferred using pySCENIC and by calculating the average expression. |
| Page: 1 |
Top |
Somatic mutation of malignant transformation related genes |
| Annotation of somatic variants for genes involved in malignant transformation |
| Hugo Symbol | Variant Class | Variant Classification | dbSNP RS | HGVSc | HGVSp | HGVSp Short | SWISSPROT | BIOTYPE | SIFT | PolyPhen | Tumor Sample Barcode | Tissue | Histology | Sex | Age | Stage | Therapy Types | Drugs | Outcome |
| NAMPT | SNV | Missense_Mutation | novel | c.397N>C | p.Thr133Pro | p.T133P | P43490 | protein_coding | deleterious(0) | possibly_damaging(0.497) | TCGA-A2-A3XY-01 | Breast | breast invasive carcinoma | Female | <65 | I/II | Chemotherapy | adriamycin | PD |
| NAMPT | SNV | Missense_Mutation | c.318N>C | p.Glu106Asp | p.E106D | P43490 | protein_coding | tolerated(0.48) | benign(0) | TCGA-BH-A0BL-01 | Breast | breast invasive carcinoma | Female | <65 | I/II | Chemotherapy | adriamycin | CR | |
| NAMPT | SNV | Missense_Mutation | c.1237N>C | p.Val413Leu | p.V413L | P43490 | protein_coding | deleterious(0.01) | probably_damaging(0.996) | TCGA-D8-A1JC-01 | Breast | breast invasive carcinoma | Female | <65 | III/IV | Chemotherapy | adriamycin | SD | |
| NAMPT | SNV | Missense_Mutation | novel | c.722N>T | p.Ser241Phe | p.S241F | P43490 | protein_coding | deleterious(0) | probably_damaging(1) | TCGA-D8-A27V-01 | Breast | breast invasive carcinoma | Female | <65 | I/II | Hormone Therapy | tamoxiphen | SD |
| NAMPT | SNV | Missense_Mutation | novel | c.182N>T | p.Gly61Val | p.G61V | P43490 | protein_coding | deleterious(0) | probably_damaging(1) | TCGA-PL-A8LZ-01 | Breast | breast invasive carcinoma | Female | <65 | III/IV | Chemotherapy | paclitaxel | SD |
| NAMPT | SNV | Missense_Mutation | c.857N>T | p.Ala286Val | p.A286V | P43490 | protein_coding | deleterious(0.02) | probably_damaging(0.997) | TCGA-AA-A010-01 | Colorectum | colon adenocarcinoma | Female | <65 | I/II | Chemotherapy | folinic | CR | |
| NAMPT | SNV | Missense_Mutation | novel | c.1211T>C | p.Val404Ala | p.V404A | P43490 | protein_coding | tolerated(0.74) | benign(0.096) | TCGA-CA-6717-01 | Colorectum | colon adenocarcinoma | Male | <65 | I/II | Chemotherapy | oxaliplatin | CR |
| NAMPT | SNV | Missense_Mutation | c.686A>C | p.Lys229Thr | p.K229T | P43490 | protein_coding | tolerated(0.09) | possibly_damaging(0.49) | TCGA-F5-6814-01 | Colorectum | rectum adenocarcinoma | Male | <65 | I/II | Unknown | Unknown | SD | |
| NAMPT | SNV | Missense_Mutation | c.571N>A | p.His191Asn | p.H191N | P43490 | protein_coding | deleterious(0.01) | probably_damaging(0.997) | TCGA-A5-A0GU-01 | Endometrium | uterine corpus endometrioid carcinoma | Female | <65 | I/II | Unknown | Unknown | SD | |
| NAMPT | SNV | Missense_Mutation | novel | c.238N>G | p.Ile80Val | p.I80V | P43490 | protein_coding | tolerated(0.21) | probably_damaging(0.94) | TCGA-A5-A0VP-01 | Endometrium | uterine corpus endometrioid carcinoma | Female | >=65 | I/II | Unknown | Unknown | SD |
| Page: 1 2 3 4 |
Top |
Related drugs of malignant transformation related genes |
| Identification of chemicals and drugs interact with genes involved in malignant transfromation |
| (DGIdb 4.0) |
| Entrez ID | Symbol | Category | Interaction Types | Drug Claim Name | Drug Name | PMIDs |
| 10135 | NAMPT | DRUGGABLE GENOME | GMX1777 | TEGLARINAD CHLORIDE | ||
| 10135 | NAMPT | DRUGGABLE GENOME | GMX1777 | TEGLARINAD CHLORIDE | ||
| 10135 | NAMPT | DRUGGABLE GENOME | CHS-828 | CHS-828 | ||
| 10135 | NAMPT | DRUGGABLE GENOME | Daporinad | DAPORINAD | ||
| 10135 | NAMPT | DRUGGABLE GENOME | inhibitor | CHEMBL190412 | TEGLARINAD CHLORIDE |
| Page: 1 |

Copyright 2023-Present -The University of Texas Health Science Center at Houston |