
|
|||||
|
 | |
| |
| |
| |
| |
| |
|
Gene: NAIP |
Gene summary for NAIP |
| Gene information | Species | Human | Gene symbol | NAIP | Gene ID | 4671 |
| Gene name | NLR family apoptosis inhibitory protein | |
| Gene Alias | BIRC1 | |
| Cytomap | 5q13.2 | |
| Gene Type | protein-coding | GO ID | GO:0002376 | UniProtAcc | Q13075 |
Top |
Malignant transformation analysis |
| Identification of the aberrant gene expression in precancerous and cancerous lesions by comparing the gene expression of stem-like cells in diseased tissues with normal stem cells |
| Entrez ID | Symbol | Replicates | Species | Organ | Tissue | Adj P-value | Log2FC | Malignancy |
| 4671 | NAIP | NAFLD1 | Human | Liver | NAFLD | 2.33e-03 | 4.98e-01 | -0.04 |
| 4671 | NAIP | HCC1_Meng | Human | Liver | HCC | 4.46e-26 | 6.32e-02 | 0.0246 |
| 4671 | NAIP | HCC2 | Human | Liver | HCC | 1.25e-14 | 1.50e+00 | 0.5341 |
| 4671 | NAIP | HCC5 | Human | Liver | HCC | 1.11e-02 | 1.17e+00 | 0.4932 |
| 4671 | NAIP | HTA12-23-1 | Human | Pancreas | PDAC | 1.35e-04 | 6.43e-01 | 0.3405 |
| 4671 | NAIP | HTA12-25-1 | Human | Pancreas | PDAC | 1.49e-05 | 6.00e-01 | 0.313 |
| 4671 | NAIP | HTA12-26-1 | Human | Pancreas | PDAC | 3.14e-24 | 1.02e+00 | 0.3728 |
| 4671 | NAIP | HTA12-29-1 | Human | Pancreas | PDAC | 2.69e-24 | 5.97e-01 | 0.3722 |
| 4671 | NAIP | PTC01 | Human | Thyroid | PTC | 1.09e-02 | 8.56e-02 | 0.1899 |
| 4671 | NAIP | PTC03 | Human | Thyroid | PTC | 1.02e-02 | 1.55e-01 | 0.1784 |
| 4671 | NAIP | PTC04 | Human | Thyroid | PTC | 1.02e-18 | 2.82e-01 | 0.1927 |
| 4671 | NAIP | PTC05 | Human | Thyroid | PTC | 3.36e-15 | 5.29e-01 | 0.2065 |
| 4671 | NAIP | PTC06 | Human | Thyroid | PTC | 9.66e-10 | 2.49e-01 | 0.2057 |
| 4671 | NAIP | PTC07 | Human | Thyroid | PTC | 1.29e-07 | 1.87e-01 | 0.2044 |
| 4671 | NAIP | ATC11 | Human | Thyroid | ATC | 4.17e-02 | 2.54e-01 | 0.3386 |
| 4671 | NAIP | ATC13 | Human | Thyroid | ATC | 6.38e-17 | 3.85e-01 | 0.34 |
| 4671 | NAIP | ATC2 | Human | Thyroid | ATC | 1.85e-07 | 5.68e-01 | 0.34 |
| 4671 | NAIP | ATC5 | Human | Thyroid | ATC | 1.54e-20 | 3.93e-01 | 0.34 |
| Page: 1 |
| Tissue | Expression Dynamics | Abbreviation |
| Liver | 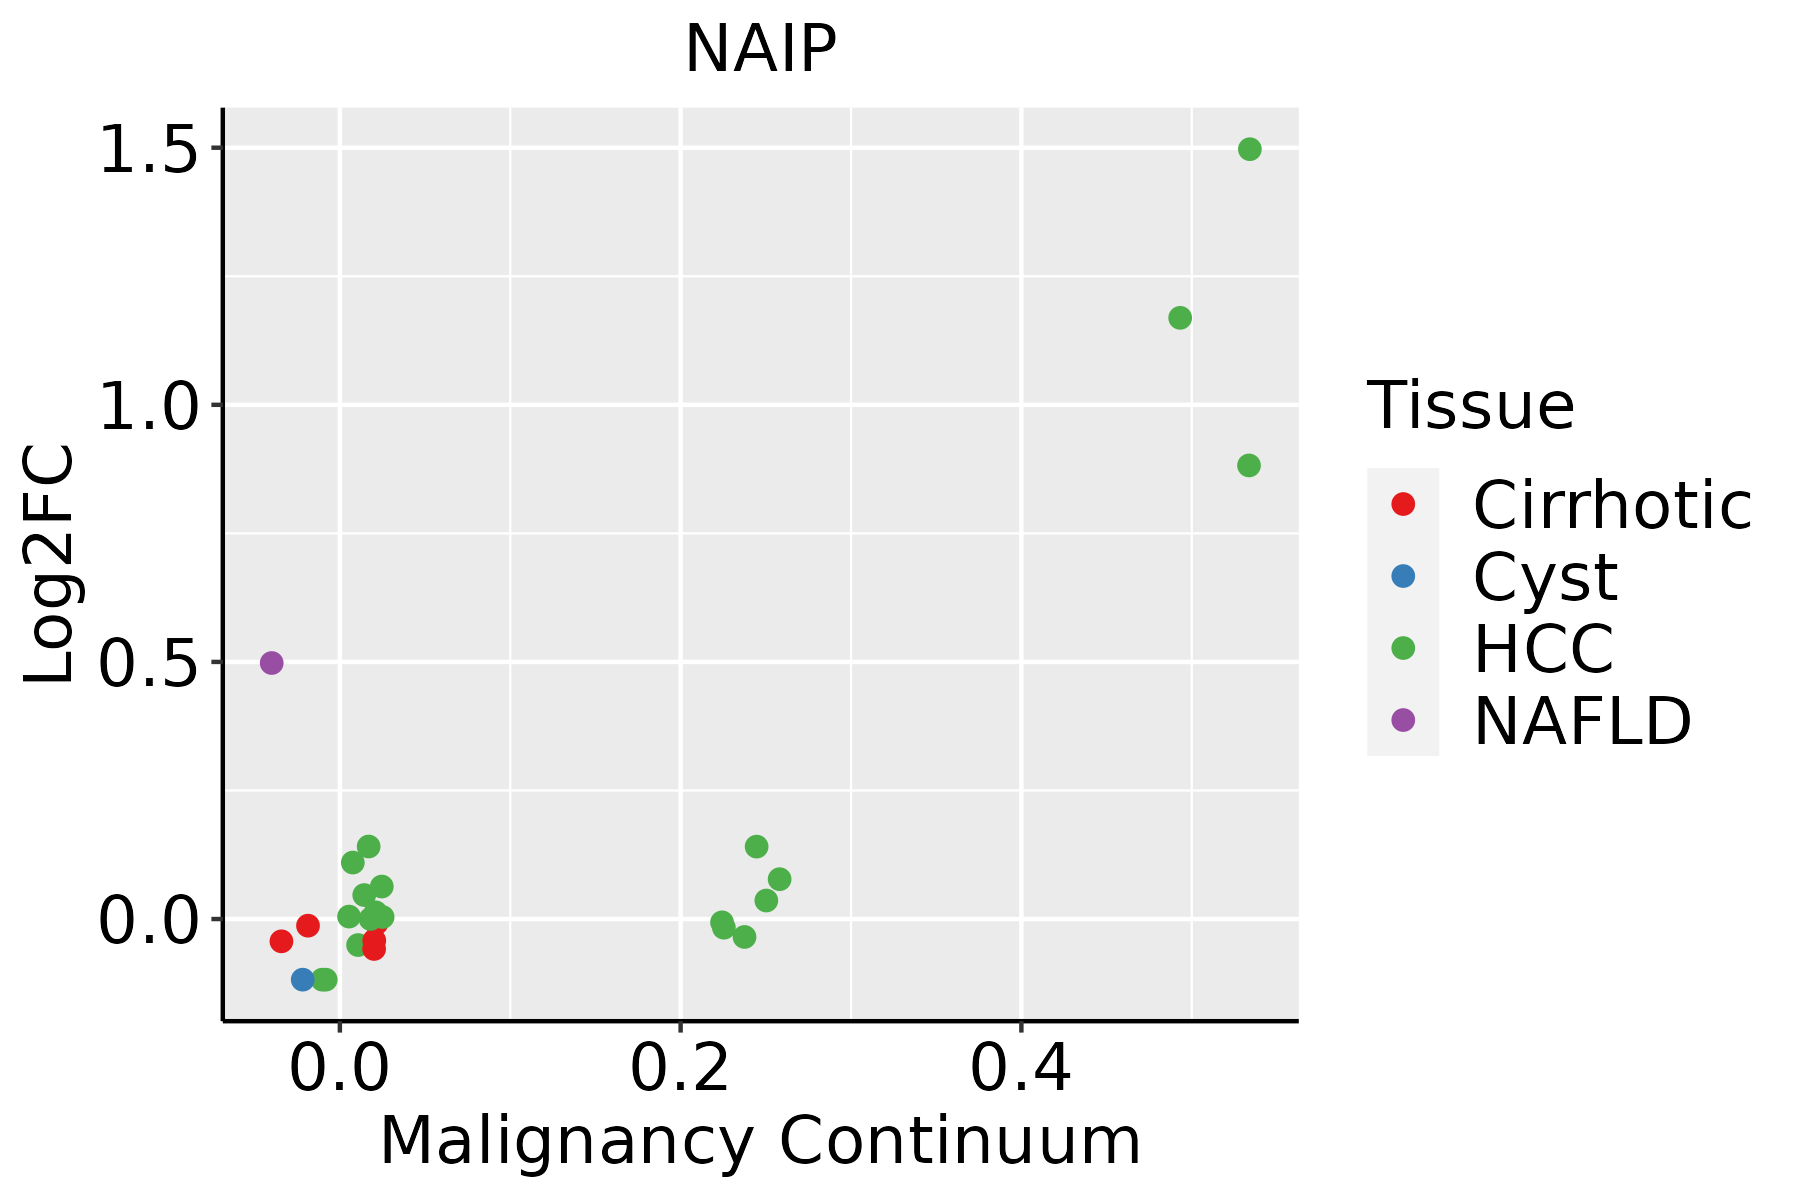 | HCC: Hepatocellular carcinoma |
| NAFLD: Non-alcoholic fatty liver disease | ||
| Thyroid | 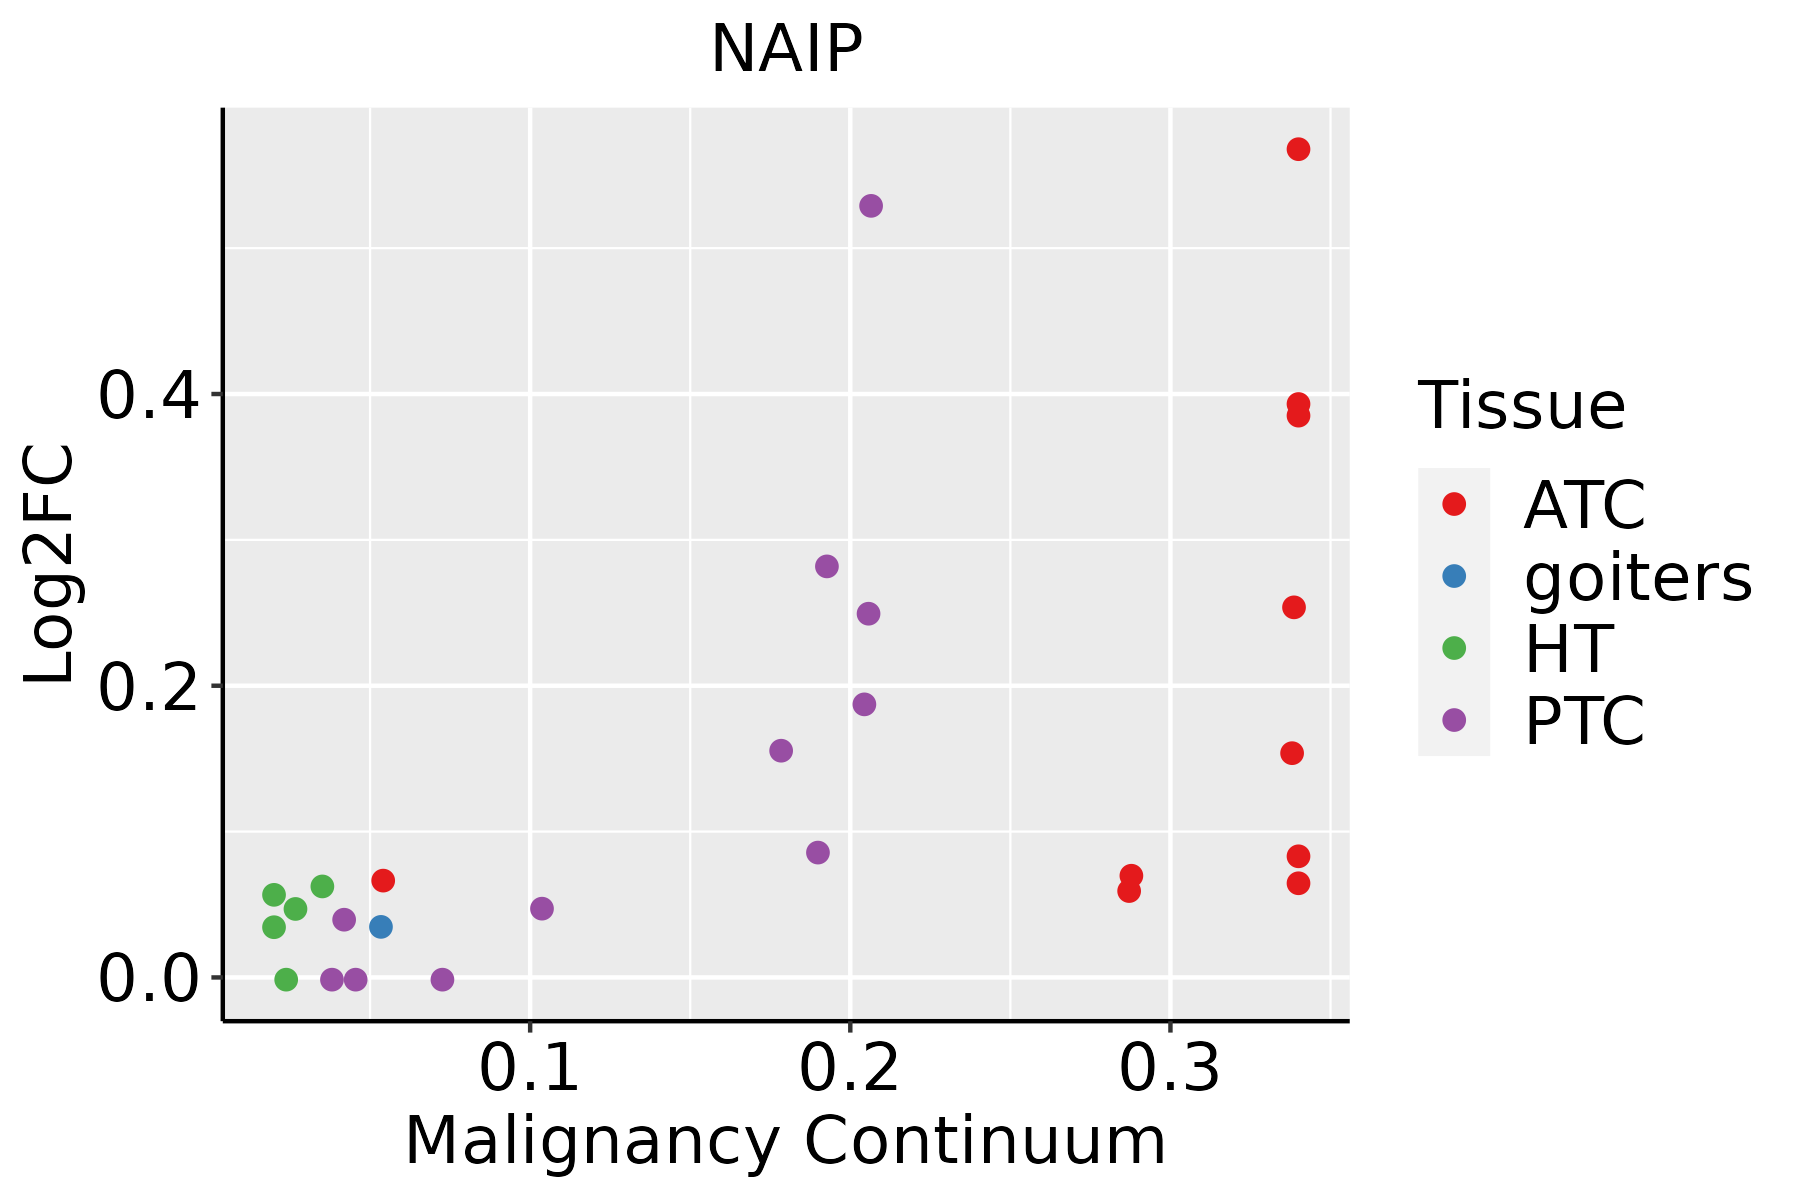 | ATC: Anaplastic thyroid cancer |
| HT: Hashimoto's thyroiditis | ||
| PTC: Papillary thyroid cancer |
| ∗log2FC in expression of this searched gene in stem-like cells from each diseased tissue sample relative to stem-like cells in normal samples in each tissue plotted against the malignancy continuum. Samples are colored based on if they are from different disease stage. |
Top |
Malignant transformation related pathway analysis |
| Find out the enriched GO biological processes and KEGG pathways involved in transition from healthy to precancer to cancer |
| Tissue | Disease Stage | Enriched GO biological Processes |
| Colorectum | AD |  |
| Colorectum | SER |  |
| Colorectum | MSS |  |
| Colorectum | MSI-H |  |
| Colorectum | FAP |  |
| ∗Top 15 enriched GO BP terms are showed in the bar plot of each disease state in each tissue. Each row represents a significant GO biological process which is colored according to the -log10(p.adjust). |
| Page: 1 2 3 4 5 6 7 8 9 |
| GO ID | Tissue | Disease Stage | Description | Gene Ratio | Bg Ratio | pvalue | p.adjust | Count |
| GO:00458617 | Liver | NAFLD | negative regulation of proteolysis | 66/1882 | 351/18723 | 4.02e-07 | 2.58e-05 | 66 |
| GO:00513467 | Liver | NAFLD | negative regulation of hydrolase activity | 62/1882 | 379/18723 | 8.11e-05 | 1.66e-03 | 62 |
| GO:00525477 | Liver | NAFLD | regulation of peptidase activity | 72/1882 | 461/18723 | 1.03e-04 | 2.03e-03 | 72 |
| GO:00525487 | Liver | NAFLD | regulation of endopeptidase activity | 67/1882 | 432/18723 | 2.17e-04 | 3.70e-03 | 67 |
| GO:00109517 | Liver | NAFLD | negative regulation of endopeptidase activity | 42/1882 | 252/18723 | 7.29e-04 | 9.29e-03 | 42 |
| GO:00104667 | Liver | NAFLD | negative regulation of peptidase activity | 43/1882 | 262/18723 | 8.76e-04 | 1.07e-02 | 43 |
| GO:00709977 | Liver | NAFLD | neuron death | 52/1882 | 361/18723 | 5.08e-03 | 3.96e-02 | 52 |
| GO:007099722 | Liver | HCC | neuron death | 202/7958 | 361/18723 | 1.44e-07 | 2.70e-06 | 202 |
| GO:004328112 | Liver | HCC | regulation of cysteine-type endopeptidase activity involved in apoptotic process | 125/7958 | 209/18723 | 3.12e-07 | 5.42e-06 | 125 |
| GO:190121412 | Liver | HCC | regulation of neuron death | 179/7958 | 319/18723 | 5.65e-07 | 9.01e-06 | 179 |
| GO:200011612 | Liver | HCC | regulation of cysteine-type endopeptidase activity | 137/7958 | 235/18723 | 6.91e-07 | 1.08e-05 | 137 |
| GO:005254722 | Liver | HCC | regulation of peptidase activity | 247/7958 | 461/18723 | 8.28e-07 | 1.27e-05 | 247 |
| GO:004315412 | Liver | HCC | negative regulation of cysteine-type endopeptidase activity involved in apoptotic process | 54/7958 | 78/18723 | 1.61e-06 | 2.27e-05 | 54 |
| GO:005254822 | Liver | HCC | regulation of endopeptidase activity | 230/7958 | 432/18723 | 3.58e-06 | 4.68e-05 | 230 |
| GO:200011712 | Liver | HCC | negative regulation of cysteine-type endopeptidase activity | 57/7958 | 86/18723 | 7.14e-06 | 8.47e-05 | 57 |
| GO:004586122 | Liver | HCC | negative regulation of proteolysis | 186/7958 | 351/18723 | 4.19e-05 | 4.11e-04 | 186 |
| GO:005140212 | Liver | HCC | neuron apoptotic process | 135/7958 | 246/18723 | 5.64e-05 | 5.26e-04 | 135 |
| GO:004352312 | Liver | HCC | regulation of neuron apoptotic process | 117/7958 | 212/18723 | 1.25e-04 | 1.03e-03 | 117 |
| GO:005134622 | Liver | HCC | negative regulation of hydrolase activity | 195/7958 | 379/18723 | 2.44e-04 | 1.82e-03 | 195 |
| GO:190121512 | Liver | HCC | negative regulation of neuron death | 113/7958 | 208/18723 | 3.68e-04 | 2.54e-03 | 113 |
| Page: 1 2 3 |
| Pathway ID | Tissue | Disease Stage | Description | Gene Ratio | Bg Ratio | pvalue | p.adjust | qvalue | Count |
| hsa0513214 | Liver | NAFLD | Salmonella infection | 55/1043 | 249/8465 | 8.48e-06 | 3.09e-04 | 2.49e-04 | 55 |
| hsa0513014 | Liver | NAFLD | Pathogenic Escherichia coli infection | 45/1043 | 197/8465 | 2.31e-05 | 6.88e-04 | 5.54e-04 | 45 |
| hsa0513114 | Liver | NAFLD | Shigellosis | 48/1043 | 247/8465 | 7.82e-04 | 1.17e-02 | 9.39e-03 | 48 |
| hsa0513215 | Liver | NAFLD | Salmonella infection | 55/1043 | 249/8465 | 8.48e-06 | 3.09e-04 | 2.49e-04 | 55 |
| hsa0513015 | Liver | NAFLD | Pathogenic Escherichia coli infection | 45/1043 | 197/8465 | 2.31e-05 | 6.88e-04 | 5.54e-04 | 45 |
| hsa0513115 | Liver | NAFLD | Shigellosis | 48/1043 | 247/8465 | 7.82e-04 | 1.17e-02 | 9.39e-03 | 48 |
| hsa0513242 | Liver | HCC | Salmonella infection | 178/4020 | 249/8465 | 5.90e-15 | 1.98e-13 | 1.10e-13 | 178 |
| hsa0513042 | Liver | HCC | Pathogenic Escherichia coli infection | 129/4020 | 197/8465 | 2.02e-07 | 2.50e-06 | 1.39e-06 | 129 |
| hsa0513142 | Liver | HCC | Shigellosis | 150/4020 | 247/8465 | 1.53e-05 | 1.04e-04 | 5.81e-05 | 150 |
| hsa0513252 | Liver | HCC | Salmonella infection | 178/4020 | 249/8465 | 5.90e-15 | 1.98e-13 | 1.10e-13 | 178 |
| hsa0513052 | Liver | HCC | Pathogenic Escherichia coli infection | 129/4020 | 197/8465 | 2.02e-07 | 2.50e-06 | 1.39e-06 | 129 |
| hsa0513152 | Liver | HCC | Shigellosis | 150/4020 | 247/8465 | 1.53e-05 | 1.04e-04 | 5.81e-05 | 150 |
| Page: 1 |
Top |
Cell-cell communication analysis |
| Identification of potential cell-cell interactions between two cell types and their ligand-receptor pairs for different disease states |
| Ligand | Receptor | LRpair | Pathway | Tissue | Disease Stage |
| Page: 1 |
Top |
Single-cell gene regulatory network inference analysis |
| Find out the significant the regulons (TFs) and the target genes of each regulon across cell types for different disease states |
| TF | Cell Type | Tissue | Disease Stage | Target Gene | RSS | Regulon Activity |
| ∗The dot plots of a searched regulon are shown for all cell subpopulations in each disease state of each tissue based on the regulon specific score inferred using pySCENIC and by calculating the average expression. |
| Page: 1 |
Top |
Somatic mutation of malignant transformation related genes |
| Annotation of somatic variants for genes involved in malignant transformation |
| Hugo Symbol | Variant Class | Variant Classification | dbSNP RS | HGVSc | HGVSp | HGVSp Short | SWISSPROT | BIOTYPE | SIFT | PolyPhen | Tumor Sample Barcode | Tissue | Histology | Sex | Age | Stage | Therapy Types | Drugs | Outcome |
| NAIP | SNV | Missense_Mutation | novel | c.27C>A | p.Asp9Glu | p.D9E | Q13075 | protein_coding | tolerated(1) | benign(0.001) | TCGA-B6-A401-01 | Breast | breast invasive carcinoma | Female | <65 | I/II | Chemotherapy | cyclophosphamide | SD |
| NAIP | SNV | Missense_Mutation | c.660N>C | p.Trp220Cys | p.W220C | Q13075 | protein_coding | deleterious(0) | probably_damaging(0.999) | TCGA-EK-A2PI-01 | Cervix | cervical & endocervical cancer | Female | <65 | III/IV | Unknown | Unknown | SD | |
| NAIP | SNV | Missense_Mutation | c.340N>G | p.Ile114Val | p.I114V | Q13075 | protein_coding | tolerated(0.37) | benign(0.005) | TCGA-AA-3664-01 | Colorectum | colon adenocarcinoma | Female | >=65 | I/II | Unknown | Unknown | SD | |
| NAIP | SNV | Missense_Mutation | novel | c.195N>T | p.Lys65Asn | p.K65N | Q13075 | protein_coding | deleterious(0.01) | probably_damaging(0.918) | TCGA-AA-A00N-01 | Colorectum | colon adenocarcinoma | Male | >=65 | I/II | Unknown | Unknown | PD |
| NAIP | SNV | Missense_Mutation | rs745325912 | c.172N>T | p.Arg58Cys | p.R58C | Q13075 | protein_coding | deleterious(0) | probably_damaging(0.997) | TCGA-AJ-A3BH-01 | Endometrium | uterine corpus endometrioid carcinoma | Female | Unknown | I/II | Unknown | Unknown | SD |
| NAIP | SNV | Missense_Mutation | novel | c.173G>A | p.Arg58His | p.R58H | Q13075 | protein_coding | deleterious(0) | probably_damaging(0.997) | TCGA-AP-A0LM-01 | Endometrium | uterine corpus endometrioid carcinoma | Female | <65 | III/IV | Chemotherapy | cisplatin | SD |
| NAIP | SNV | Missense_Mutation | rs745325912 | c.172N>T | p.Arg58Cys | p.R58C | Q13075 | protein_coding | deleterious(0) | probably_damaging(0.997) | TCGA-B5-A11E-01 | Endometrium | uterine corpus endometrioid carcinoma | Female | <65 | I/II | Unknown | Unknown | SD |
| NAIP | SNV | Missense_Mutation | novel | c.533N>A | p.Pro178His | p.P178H | Q13075 | protein_coding | deleterious(0) | probably_damaging(1) | TCGA-B5-A3FC-01 | Endometrium | uterine corpus endometrioid carcinoma | Female | <65 | I/II | Unknown | Unknown | SD |
| NAIP | SNV | Missense_Mutation | novel | c.482N>T | p.Ala161Val | p.A161V | Q13075 | protein_coding | tolerated(0.08) | benign(0.401) | TCGA-DF-A2KN-01 | Endometrium | uterine corpus endometrioid carcinoma | Female | Unknown | I/II | Unknown | Unknown | SD |
| NAIP | SNV | Missense_Mutation | novel | c.218N>G | p.Tyr73Cys | p.Y73C | Q13075 | protein_coding | deleterious(0.02) | possibly_damaging(0.87) | TCGA-DF-A2KN-01 | Endometrium | uterine corpus endometrioid carcinoma | Female | Unknown | I/II | Unknown | Unknown | SD |
| Page: 1 2 3 |
Top |
Related drugs of malignant transformation related genes |
| Identification of chemicals and drugs interact with genes involved in malignant transfromation |
| (DGIdb 4.0) |
| Entrez ID | Symbol | Category | Interaction Types | Drug Claim Name | Drug Name | PMIDs |
| Page: 1 |

Copyright 2023-Present -The University of Texas Health Science Center at Houston |